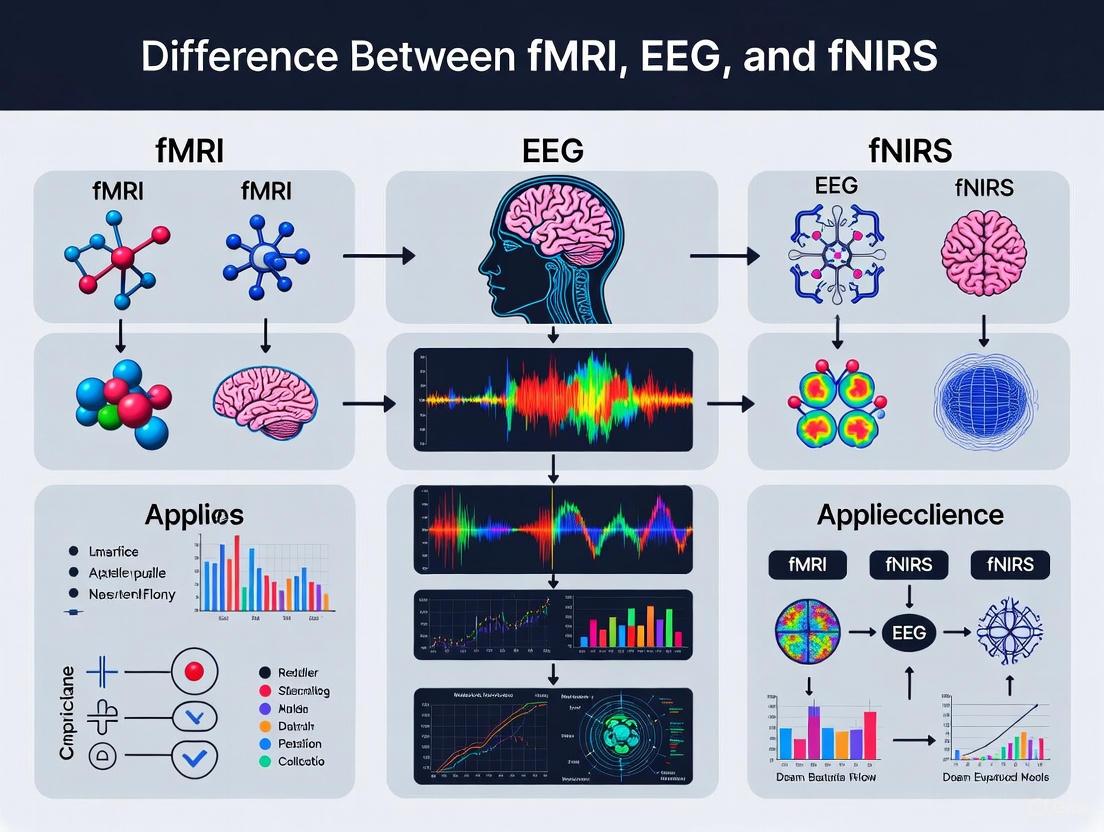
fMRI vs. EEG vs. fNIRS: A Comprehensive Guide to Neuroimaging Modalities for Research and Clinical Applications
This article provides a detailed comparison of three foundational neuroimaging techniques—functional Magnetic Resonance Imaging (fMRI), Electroencephalography (EEG), and functional Near-Infrared Spectroscopy (fNIRS)—tailored for researchers, scientists, and drug development professionals.
fMRI vs. EEG vs. fNIRS: A Comprehensive Guide to Neuroimaging Modalities for Research and Clinical Applications
Abstract
This article provides a detailed comparison of three foundational neuroimaging techniques—functional Magnetic Resonance Imaging (fMRI), Electroencephalography (EEG), and functional Near-Infrared Spectroscopy (fNIRS)—tailored for researchers, scientists, and drug development professionals. It explores the fundamental principles, strengths, and limitations of each modality, covering their specific methodological applications from basic research to clinical trials. The content further addresses practical challenges in implementation and data fusion, and offers guidance on modality selection and validation through multimodal approaches. By synthesizing current research and future directions, this guide serves as a strategic resource for optimizing neuroimaging strategies in both biomedical and clinical research contexts.
Understanding the Core Principles: How fMRI, EEG, and fNIRS Measure Brain Activity
The quest to visualize and quantify brain function relies on two distinct classes of physiological signals: the fast electrophysiological currents generated by neural firing and the slower hemodynamic responses that support metabolic demand. Electrophysiological signals represent the direct, instantaneous electrical activity of neurons, primarily measured by techniques like electroencephalography (EEG). In contrast, hemodynamic signals reflect the indirect, blood-borne metabolic consequences of neural activity, typically measured by functional magnetic resonance imaging (fMRI) and functional near-infrared spectroscopy (fNIRS). This fundamental biophysical distinction governs every aspect of neuroimaging, from temporal resolution and spatial specificity to the appropriate experimental design and analytical approach. Understanding the origin, relationship, and practical implications of these signals is paramount for researchers and drug development professionals selecting the optimal tools for probing brain function in health and disease.
The connection between these signals is governed by neurovascular coupling, the biological process that links local neural activity to subsequent changes in cerebral blood flow. When a brain region becomes active, a complex cascade of events leads to an increased delivery of oxygenated blood to that area, typically peaking 2 to 6 seconds after the neural event. This hemodynamic response is the primary source of contrast for both fMRI and fNIRS. While electrophysiological methods capture the neural activity itself with millisecond precision, hemodynamic methods provide a delayed, spatially mapped metabolic portrait of that activity. The integration of these complementary views—either through simultaneous multi-modal acquisition or through informed interpretation of single-modality data—offers a more comprehensive understanding of brain dynamics than either could provide alone.
Core Biophysical Principles
The Electrophysiological Signal
Electrophysiological signals originate from the synchronized firing of populations of neurons, specifically the postsynaptic potentials in cortical pyramidal cells. When these neurons fire in synchrony, the summed electrical currents create a potential large enough to be detected through the skull and scalp by sensitive electrodes. EEG measures these voltage fluctuations, which typically range from 10 to 100 microvolts. The electrical properties of biological tissues, including the skull and scalp, act as a low-pass filter, smearing and attenuating the signal, which fundamentally limits the spatial resolution of EEG.
The electrophysiological signal is characterized by its oscillatory nature, with different frequency bands correlating with distinct brain states. These rhythms are categorized into bands including delta (0.5-4 Hz), theta (4-7 Hz), alpha (8-12 Hz), beta (13-30 Hz), and gamma (>30 Hz). Each rhythm is associated with different cognitive or behavioral states; for example, the posterior dominant alpha rhythm is characteristic of a relaxed, awake state with eyes closed and is attenuated by eye opening or mental effort. The key advantage of electrophysiological signals is their exquisite temporal resolution, which is on the order of milliseconds, allowing for the direct observation of neural processing in real-time.
The Hemodynamic Signal
The hemodynamic signal is an indirect metabolic correlate of neural activity, rooted in the brain's intricate vascular system. The primary physiological phenomenon is the hemodynamic response: when a neural population becomes active, its metabolic demands for oxygen and glucose increase. This triggers a complex neurovascular coupling process, leading to a localized increase in cerebral blood flow that actually overcompensates for the oxygen demand. The result is a localized change in the relative concentrations of oxygenated hemoglobin (HbO) and deoxygenated hemoglobin (HbR).
This hemodynamic response has a characteristic time course, beginning approximately 1-2 seconds after neural activity, peaking at 4-6 seconds, and then undershooting before returning to baseline. Different neuroimaging techniques capture this signal in distinct ways:
- fMRI measures the Blood-Oxygen-Level-Dependent (BOLD) contrast, which relies on the different magnetic properties of HbO and HbR. Deoxygenated hemoglobin is paramagnetic and creates distortions in the local magnetic field, while oxygenated hemoglobin is diamagnetic. The BOLD signal thus primarily reflects changes in deoxygenated hemoglobin.
- fNIRS uses near-infrared light to measure changes in the absorption spectra of HbO and HbR directly, providing separate concentration measurements for both molecules.
The fundamental principle governing blood flow during this response is described by Ohm's law of fluid flow: Flow = Pressure / Resistance. The increased blood flow to active regions is achieved through a reduction in vascular resistance, primarily via the dilation of arterioles. While the hemodynamic response provides excellent spatial localization of brain activity, its temporal resolution is limited by the sluggishness of the vascular response, which unfolds over several seconds.
Quantitative Technical Comparison
The biophysical differences between electrophysiological and hemodynamic signals manifest in distinct performance characteristics for the neuroimaging techniques that measure them. The table below provides a direct, quantitative comparison of these core properties.
Table 1: Quantitative Comparison of Neuroimaging Modalities Based on Signal Origin
| Feature | EEG (Electrophysiological) | fMRI (Hemodynamic) | fNIRS (Hemodynamic) |
|---|---|---|---|
| What It Measures | Electrical potentials from synchronized neuronal firing [1] | Blood-Oxygen-Level-Dependent (BOLD) contrast [2] [3] | Changes in oxy- and deoxy-hemoglobin concentration [2] [4] |
| Spatial Resolution | Low (centimeters) [2] [1] | High (millimeters) [2] | Moderate (centimeters) [2] [1] |
| Temporal Resolution | High (milliseconds) [2] [1] | Low (seconds) [2] | Low (seconds) [2] [1] |
| Depth of Measurement | Cortical surface [1] | Whole brain [5] | Outer cortex (1-2.5 cm) [4] [1] |
| Primary Signal Source | Postsynaptic potentials in cortical pyramidal cells [1] | Changes in deoxygenated hemoglobin due to blood flow [3] | Absorption changes in HbO and HbR in micro-vessels [4] |
| Typical Setup Time | Moderate to long (can be 10+ minutes with gel) [2] | Long (preparation and calibration) [3] | Short (under a minute) [2] |
| Tolerance to Movement | Low - highly susceptible to artifacts [1] | Very low - requires complete stillness [3] | Moderate - relatively robust to movement [3] [1] |
This comparison highlights the inherent trade-offs in neuroimaging. EEG's millisecond temporal resolution is ideal for tracking the rapid dynamics of brain communication but provides a blurry spatial picture. Conversely, fMRI can localize activity to small, specific brain structures but cannot track the rapid sequence of neural events. fNIRS occupies a middle ground, offering better spatial resolution than EEG and greater portability and motion tolerance than fMRI, though it cannot image deep brain structures.
Experimental Protocols and Methodologies
Protocol 1: Simultaneous fNIRS and ERP during a Stroop Task
This protocol is designed to capture both the hemodynamic and electrophysiological correlates of cognitive conflict and control.
- Objective: To investigate the relationship between hemodynamic responses in the prefrontal cortex (PFC) and event-related potentials (ERPs) during the Chinese-character color-word Stroop task [6].
- Experimental Design:
- Task: A modified Stroop task with three conditions: congruent, incongruent, and neutral stimuli. Subjects are required to name the color of the presented character while ignoring its semantic meaning.
- Design: Event-related or block design.
- Measurements:
- fNIRS: Continuous-wave fNIRS is used to monitor relative changes in oxy- (HbO), deoxy- (HbR), and total hemoglobin concentration in the PFC.
- ERP: EEG is recorded simultaneously to characterize electrophysiological components, specifically P450, N500, and P600.
- Procedure:
- Set up the EEG cap and fNIRS optodes on the participant's scalp, ensuring proper placement over the PFC according to the international 10-20 system.
- Synchronize the fNIRS and EEG acquisition systems using a shared trigger or clock signal.
- Conduct a baseline recording with the participant at rest.
- Present the Stroop task stimuli in a randomized order. Each trial involves a brief presentation of a character, followed by an inter-trial interval.
- Record the participant's behavioral responses (accuracy and reaction time).
- Conclude with another resting-state recording.
- Data Analysis:
- fNIRS Data: Preprocess the optical data to convert raw light intensity changes into hemoglobin concentration changes using the modified Beer-Lambert law. Analyze the amplitude and timing of HbO and HbR responses for each stimulus condition.
- ERP Data: Preprocess the EEG data (filtering, artifact removal, epoching). Average the epochs time-locked to the stimulus onset to extract the ERP components (P450, N500, P600).
- Correlation Analysis: Perform statistical correlation analysis between the hemodynamic parameters (e.g., HbO amplitude) and the electrophysiological parameters (e.g., P600 amplitude) across the different conditions and subjects.
This protocol revealed that the P600 ERP component correlated significantly with hemodynamic parameters in the PFC, suggesting a link between this late positive potential and the conflict-solving function of the PFC. It also found that deoxy-Hb concentration showed higher sensitivity to the Stroop task than other hemodynamic signals [6].
Protocol 2: fNIRS of Brain Activation during a Balance Task
This protocol leverages the portability of fNIRS to study brain function during whole-body movement, a scenario where fMRI is impractical.
- Objective: To measure brain activation in vestibular and motor cortices during an active balancing task using fNIRS [4].
- Experimental Design:
- Task: A video game-based balance task (Nintendo Wii Fit skiing game) requiring the participant to shift their center of mass to control an avatar on a screen.
- Conditions: Beginner and advanced difficulty levels, with standing rest periods before and after each trial.
- Control Task (subset of participants): Watch the video game while standing still to control for visual stimulation.
- Procedure:
- Fit the participant with a 32-channel fNIRS head cap, ensuring optodes cover regions of interest (frontal, motor, sensory, and temporal cortices).
- Register the 3D position of the fNIRS probe on the participant's head for anatomical co-registration.
- Have the participant stand on the balance board.
- Begin with a 30-second standing rest period.
- Start the skiing game; the task duration is self-paced (~40-60 seconds).
- Follow with a 30-second post-task standing rest.
- Repeat for multiple trials at different difficulty levels.
- Data Analysis:
- Process fNIRS data to obtain HbO and HbR time courses.
- Use a general linear model (GLM) to compare the hemodynamic response during the active task period to the rest periods.
- Statistically compare activation between different difficulty levels and across brain regions.
This study successfully identified activation in the superior temporal gyrus, a region implicated in vestibular function, which was modulated by the difficulty of the balance task. This demonstrates fNIRS's unique capability to image cortical activity during whole-body movement [4].
Signaling Pathways and Workflows
The following diagrams, created using Graphviz DOT language, illustrate the core signaling pathways and experimental workflows for hemodynamic and electrophysiological neuroimaging.
Hemodynamic Neurovascular Coupling Pathway
This diagram outlines the Neurovascular Coupling Pathway from a neural event to the measurable hemodynamic signal. The process begins with a neural event leading to increased neural activity and glutamate release. This triggers signaling processes in astrocytes, which ultimately cause arteriole dilation. This dilation reduces vascular resistance, leading to a large increase in cerebral blood flow. The change in blood flow and volume alters the local concentration of oxygenated and deoxygenated hemoglobin, which is the final common path detected by both fMRI (as the BOLD signal) and fNIRS (as an optical absorption change).
Electrophysiological Signal Generation and Measurement
This diagram illustrates the Electrophysiological Signal Pathway measured by EEG. The process is initiated by a stimulus, leading to the synchronized firing of large populations of neurons, particularly cortical pyramidal cells. The primary signal source is the summation of postsynaptic potentials from these cells. These individual currents summate to create a combined electrical field strong enough to propagate through the biological tissues. This signal undergoes significant distortion and attenuation as it volume conducts through the brain, cerebrospinal fluid, skull, and scalp. The final result is a weak electrical potential in the microvolt range that is detected by electrodes on the scalp.
Multimodal Experimental Workflow
This Multimodal Experimental Workflow diagram shows how hemodynamic and electrophysiological data are acquired and integrated. A participant performs a task, generating brain activity. This single neural event gives rise to two parallel physiological processes: a fast electrophysiological signal measured by EEG/MEG with millisecond resolution, and a slow hemodynamic signal, mediated by neurovascular coupling, which peaks 4-6 seconds later and is measured by fMRI/fNIRS. The signals from both modalities are synchronized during acquisition and then combined during joint analysis to provide a spatiotemporally rich account of brain function.
The Scientist's Toolkit: Research Reagent Solutions
The following table details key materials and solutions used in experiments leveraging hemodynamic and electrophysiological signals, with a focus on their specific functions in the research context.
Table 2: Essential Research Reagents and Materials for Neuroimaging Studies
| Item | Function/Application | Relevant Modality |
|---|---|---|
| EEG Electrodes (Ag/AgCl) | Sensors placed on the scalp to detect electrical potentials. High-quality electrodes ensure stable impedance and low-noise recording. | EEG [7] |
| Electrode Gel/Grounding Solution | Electrolyte gel or solution applied to electrodes to facilitate electrical conduction between the scalp and the electrode, reducing impedance. | EEG [2] |
| fNIRS Optodes | Fiber optic components comprising light sources (emitters) and detectors placed on the scalp to deliver near-infrared light and measure its attenuation after passing through brain tissue. | fNIRS [4] |
| fNIRS Head Cap | A flexible cap (often plastic/Velcro) that holds fNIRS optodes in a precise geometric arrangement on the scalp, often based on the international 10-20 system. | fNIRS [4] |
| 3D Digitizer (e.g., Polhemus FastSCAN) | A magnetic or optical stylus system used to record the precise 3D locations of EEG electrodes or fNIRS optodes on the participant's head. This is critical for anatomical co-registration of the data with brain atlases or individual MRI scans. | EEG, fNIRS [4] |
| Synchronization Trigger Box | Hardware device that generates a TTL pulse or other shared signal to synchronize the timing of stimulus presentation, task events, and data acquisition across multiple recording systems (e.g., fNIRS and EEG). | Multimodal (EEG+fNIRS) [1] |
| Anatomical Atlas Software (e.g., AtlasViewer) | Software solutions that use digitized probe positions and standard brain atlases (or individual MRIs) to estimate the underlying brain regions measured by each fNIRS channel or EEG electrode. | fNIRS, EEG [3] |
The distinction between hemodynamic and electrophysiological signals is not merely technical but fundamental to interpreting brain function. Hemodynamic methods like fMRI and fNIRS provide a high-spatial-resolution, indirect map of the brain's metabolic landscape, ideal for pinpointing where cognitive processes occur. Electrophysiological methods like EEG offer a high-temporal-resolution, direct measurement of the brain's electrical storm, essential for understanding when and how these processes unfold. The choice between them—or the decision to integrate them multimodally—is therefore dictated by the research question itself.
For the neuroscientist, this means that studies of sustained brain states, localization of function, or investigations involving movement are well-served by hemodynamic tools. In contrast, research into rapid perceptual processes, neural oscillations, or real-time brain-computer interfaces demands the temporal fidelity of EEG. For the drug development professional, these principles inform the selection of biomarkers for clinical trials; hemodynamic signals may better reflect sustained changes in brain metabolism or network connectivity, while electrophysiological signals can offer immediate feedback on a drug's impact on neural excitability and transmission. As neuroimaging evolves, the most powerful insights will continue to come from studies that strategically exploit the complementary nature of these two foundational windows into the working brain.
Functional Magnetic Resonance Imaging (fMRI) has established itself as a cornerstone of modern cognitive neuroscience, providing a non-invasive window into human brain function. At the heart of most fMRI research lies the Blood-Oxygen-Level-Dependent (BOLD) contrast, an indirect measure of neural activity that has revolutionized our ability to map brain function with high spatial precision. The BOLD signal originates from the intricate physiological coupling between neuronal activity, metabolic demand, and subsequent hemodynamic changes in cerebral blood flow, volume, and oxygenation [8]. When a brain region becomes active, a cascade of vascular events leads to an influx of oxygenated blood that exceeds the local metabolic demand, resulting in a measurable change in the ratio of oxygenated to deoxygenated hemoglobin [9]. This neurovascular coupling forms the fundamental basis of BOLD contrast imaging.
Within the landscape of functional neuroimaging, fMRI exists alongside other prominent modalities, each with distinct strengths and limitations. Electroencephalography (EEG) measures the electrical activity generated by synchronized firing of neuronal populations with millisecond temporal resolution, but with limited spatial accuracy due to the dispersion of electrical signals through the skull and scalp [10] [11]. Functional Near-Infrared Spectroscopy (fNIRS) shares fMRI's foundation in hemodynamic response measurement but utilizes near-infrared light to detect changes in hemoglobin concentrations, offering a portable alternative with trade-offs in penetration depth and spatial resolution [3] [9]. Understanding the BOLD signal's mechanisms, advances, and limitations is therefore essential for contextualizing its role within the multimodal toolkit of modern neuroscience and drug development research.
The Core Biophysics of the BOLD Signal
Physiological Origins and the Hemodynamic Response
The BOLD signal is an indirect measure of neural activity that relies on the tight coupling between neuronal activation and subsequent vascular changes. The underlying physiology can be summarized as follows: during increased neural activity, there is a rise in metabolic demand for oxygen and glucose. This triggers a complex signaling cascade involving astrocytes and vascular cells, leading to a pronounced increase in local cerebral blood flow (CBF) and volume (CBV) that overshoots the actual oxygen consumption [8] [9]. The result is a localized decrease in the concentration of deoxyhemoglobin (dHb), the paramagnetic component of blood that creates magnetic field inhomogeneities.
The BOLD signal fundamentally arises from the different magnetic properties of oxygenated and deoxygenated hemoglobin. Oxygenated hemoglobin is diamagnetic (slightly repelled by a magnetic field), while deoxygenated hemoglobin is paramagnetic (attracted to a magnetic field) [9]. This paramagnetism causes deoxyhemoglobin to act as an endogenous contrast agent that distorts the surrounding magnetic field, accelerating the dephasing of hydrogen proton spins and reducing the MRI signal intensity. During neural activation, the surplus of oxygenated blood reduces the concentration of deoxyhemoglobin, leading to a more homogeneous local magnetic field, slower spin dephasing, and consequently an increase in the measured T2*-weighted MRI signal [8] [9]. This signal change is relatively small, typically ranging from 0.5% to 5% at common field strengths (1.5T-3T), but is consistently detectable with appropriate experimental designs.
From Magnetic Susceptibility to Signal Acquisition
The transition from physiological changes to measurable MRI signal involves sophisticated biophysical processes. The magnetic susceptibility difference between oxygenated and deoxygenated blood creates microscopic magnetic field gradients around blood vessels. These gradients cause intravoxel dephasing, where hydrogen protons in water molecules precess at different frequencies depending on their spatial position relative to blood vessels. The net signal detected in fMRI experiments represents the integrated effect of countless such spin dephasing events across the imaging voxel [12].
The complex nature of the BOLD signal presents both opportunities and challenges for high-resolution mapping. The signal exhibits differential sensitivity across the vascular hierarchy, with substantial contributions from larger draining veins that may be displaced from the actual site of neural activity. This vascular bias has driven the development of high-field systems and advanced acquisition techniques to better localize the parenchymal response originating from the capillary bed [8]. Furthermore, the BOLD signal represents a composite measure influenced by multiple physiological variables including cerebral blood flow (CBF), cerebral blood volume (CBV), and the cerebral metabolic rate of oxygen consumption (CMRO2). Disentangling these contributions requires complementary techniques such as arterial spin labeling (for CBF) or vascular space occupancy (for CBV), which provide additional constraints for interpreting the BOLD response [8].
Diagram Title: BOLD Signal Physiological Cascade
Technical Advances in High-Resolution Spatial Mapping
Pushing the Spatial Boundaries of fMRI
High-resolution fMRI represents a significant advancement beyond conventional neuroimaging, enabling the discrimination of brain activity at the scale of cortical layers and columns. While standard human fMRI typically employs voxel sizes of 3×3×3 mm³, high-resolution protocols now achieve submillimeter resolutions (often 0.5-0.8 mm isotropic), with animal studies pushing further to 50-500 μm ranges [8]. This enhanced spatial precision reveals anatomical features previously obscured in conventional fMRI, including distinct vascular compartments (arteries, veins, and capillaries) and the layered organization of the cerebral cortex [8].
The transition to high-resolution fMRI carries profound implications for BOLD signal interpretation and modeling. At conventional resolutions, the contributions of various vascular components and cortical layers are averaged within each voxel, permitting relatively simple hemodynamic models. In contrast, high-resolution data exposes the intrinsic heterogeneity of these elements, necessitating more sophisticated, multi-compartment models that explicitly represent laminar differences in neurovascular coupling, metabolism, and hemodynamic response properties [8]. These advanced models must account for the differential sensitivity of BOLD signals across cortical depths and their relationship to specific neural computations, such as feedforward versus feedback processing that are segregated across cortical layers [8].
Methodological Innovations and Challenges
The pursuit of higher spatial resolution in fMRI involves navigating significant technical trade-offs and leveraging technological innovations. Key challenges include the limited signal-to-noise ratio (SNR) at small voxel sizes, increased sensitivity to physiological noise and subject motion, and the need to maintain reasonable temporal resolution and brain coverage [8]. The development of ultra-high field scanners (7T and beyond) for human research has been instrumental in addressing these limitations, providing both increased intrinsic SNR and enhanced BOLD contrast-to-noise ratio [8].
Advanced acquisition and reconstruction techniques further enable high-resolution mapping. Simultaneous multi-slice acquisitions accelerate data collection, while specialized RF coils improve spatial encoding efficiency. Additionally, the move toward high-resolution has prompted renewed interest in the complex-valued nature of the MRI signal, particularly the phase component that is typically discarded in conventional analyses. Numerical simulations suggest that the phase signal exhibits distinctive spatial variation patterns at high resolutions that may provide complementary information to the standard magnitude signal [12]. However, practical utilization of phase data remains challenging due to issues such as phase wrapping and the complex relationship between phase variations and underlying vascular architecture [12].
Table 1: Technical Considerations in High-Resolution fMRI
| Parameter | Conventional fMRI | High-Resolution fMRI | Implications for BOLD Signal |
|---|---|---|---|
| Typical Voxel Size | 3×3×3 mm³ | 0.5-1.0 mm isotropic (human); 50-500 μm (animals) | Reduced partial volume effects; reveals vascular architecture [8] |
| Spatial Localization | Lumps multiple cortical layers/columns | Distinguishes layers/columns | Enables layer-specific neurovascular coupling studies [8] |
| Vascular Contributions | Mixed arterial, capillary, venous signals | Can separate vascular compartments | Improves localization to parenchymal activity [8] |
| Modeling Complexity | Simple hemodynamic models | Multi-compartment models required | Incorporates laminar differences in metabolism/hemodynamics [8] |
| Phase Signal Utility | Typically discarded | Potential spatial information source | May provide complementary vascular information [12] |
Comparative Analysis of Neuroimaging Modalities
Fundamental Differences in Signal Origin and Properties
Understanding the BOLD signal's role in neuroscience requires contextualization within the broader landscape of neuroimaging technologies. fMRI, EEG, and fNIRS each capture distinct facets of brain activity through different biophysical mechanisms with complementary strengths and limitations. The BOLD signal underlying fMRI provides an indirect measure of neural activity mediated by neurovascular coupling, with a characteristic temporal delay of 2-6 seconds following neural events [10] [3]. In contrast, EEG directly measures postsynaptic electrical potentials with millisecond temporal resolution, enabling real-time tracking of neural dynamics but with limited spatial precision due to the blurring effect of the skull and scalp [10] [11]. fNIRS shares fMRI's foundation in hemodynamic response measurement but utilizes optical techniques to detect changes in hemoglobin concentrations, creating a middle ground with better portability than fMRI but more restricted depth penetration [3] [9].
The spatial and temporal resolution profiles of these modalities reflect their underlying physical principles. fMRI offers the highest spatial resolution (millimeter range) and whole-brain coverage, making it ideal for mapping distributed neural networks and localized functional specialization [9]. EEG provides unparalleled temporal resolution (milliseconds) essential for tracking rapid neural dynamics but suffers from limited spatial accuracy (centimeters) and poor sensitivity to subcortical structures [10] [11]. fNIRS occupies an intermediate position with spatial resolution superior to EEG but inferior to fMRI, and temporal characteristics that are slower than EEG but potentially faster than fMRI depending on acquisition parameters [3] [2].
Table 2: Quantitative Comparison of Neuroimaging Modalities
| Characteristic | fMRI | EEG | fNIRS |
|---|---|---|---|
| Signal Measured | BOLD contrast (deoxyhemoglobin) [9] | Electrical potentials on scalp [10] | Hemoglobin concentration changes [3] |
| Spatial Resolution | ~1-3 mm (high-resolution: <1 mm) [8] | ~1-2 cm [11] | ~1-3 cm [3] |
| Temporal Resolution | ~1-3 seconds [10] | ~1-100 milliseconds [11] | ~0.1-1 second [3] |
| Depth Penetration | Whole brain [9] | Primarily cortical surface [11] | Superficial cortex (1-2 cm) [11] |
| Portability | Low (fixed scanner) [10] | High (wearable systems) [11] | High (wearable systems) [3] |
| Key Strength | Spatial resolution, whole-brain coverage [9] | Temporal resolution, direct neural measure [11] | Portability, motion tolerance [3] |
| Primary Limitation | Indirect measure, scanner environment [9] | Poor spatial localization [10] | Limited depth penetration [3] |
Practical Considerations for Research and Clinical Applications
The practical implementation of each neuroimaging modality involves significant differences in cost, accessibility, and operational constraints. fMRI systems represent the highest capital investment ($1,000+ per scan) and require dedicated physical infrastructure, specialized personnel, and compatible response equipment [10] [2]. The scanner environment imposes substantial constraints on experimental design, including restrictions on participant movement, contraindications for metal implants, challenges with claustrophobia, and interference from acoustic scanner noise [9]. These factors limit the ecological validity of many fMRI paradigms and exclude certain participant populations.
EEG and fNIRS offer more accessible alternatives with lower operational costs and greater flexibility in experimental settings. EEG systems are relatively affordable and portable, enabling studies in naturalistic environments and with populations difficult to scan in MRI (e.g., infants, patients with implants) [10] [11]. fNIRS shares these advantages while providing better spatial localization than EEG and higher tolerance for movement artifacts [3]. However, both EEG and fNIRS face limitations in imaging deep brain structures and require careful consideration of source localization challenges. For drug development research, these practical considerations significantly influence modality selection based on target population, mechanism of action, and required spatial and temporal precision for detecting intervention effects.
Multimodal Integration: Converging Evidence from Complementary Techniques
Simultaneous Acquisition and Correlative Approaches
The complementary strengths of fMRI, EEG, and fNIRS have motivated substantial interest in multimodal integration strategies that combine information from multiple imaging techniques. Simultaneous EEG-fMRI recording represents the most established multimodal approach, capitalizing on fMRI's spatial precision and EEG's temporal resolution to study brain dynamics across complementary timescales [13] [14]. This integration has demonstrated reproducible correlations between resting-state functional connectivity measured with both modalities, with crossmodal correlations of approximately r ≈ 0.3 consistently observed across different scanner field strengths (1.5T to 7T) and EEG electrode densities [14]. These correlations are strongest in the EEG beta frequency band and are particularly evident in homotopic connections between brain hemispheres and within intrinsic connectivity networks [14].
The technical challenges of multimodal integration are substantial, particularly for simultaneous acquisitions. In simultaneous EEG-fMRI, the MRI environment generates significant artifacts in EEG recordings, including gradient-induced and ballistocardiographic artifacts that require sophisticated preprocessing pipelines for removal [13]. Quantitative assessments reveal that despite optimized artifact correction, simultaneous recording conditions can produce subtle but significant changes in both EEG fast Fourier transform (FFT) amplitudes and fMRI temporal signal-to-noise ratio (TSNR) compared to separate acquisitions [13]. These findings highlight the importance of quality control measures when implementing multimodal designs, particularly for research questions focusing on brain regions or frequency bands most susceptible to acquisition artifacts.
Applications in Basic Research and Clinical Translation
Multimodal neuroimaging approaches have yielded significant insights into both basic brain function and clinical disorders. The combination of fMRI with EEG has been particularly valuable for elucidating the relationship between electrophysiological phenomena and their hemodynamic correlates, improving our understanding of fundamental neurovascular coupling mechanisms [13] [14]. In clinical populations, integrated fNIRS-EEG has emerged as a promising tool for monitoring motor recovery after stroke, leveraging the complementary information provided by electrical and hemodynamic signals to characterize cortical reorganization processes [15]. Quantitative EEG parameters such as the power ratio index (PRI) and brain symmetry index (BSI) show correlation with functional motor outcomes, providing potential prognostic biomarkers that may guide rehabilitation strategies [15].
For drug development, multimodal approaches offer enhanced capability for detecting and characterizing neurophysiological effects of pharmacological interventions. The combination of techniques sensitive to different aspects of brain function can provide a more comprehensive assessment of drug mechanisms, target engagement, and treatment response. fMRI's whole-brain coverage and spatial precision complements EEG's sensitivity to neurophysiological dynamics and fNIRS's practicality for longitudinal monitoring in more naturalistic settings. This integrated perspective is particularly valuable for complex disorders where pathophysiology spans multiple spatial and temporal scales, such as epilepsy, neurodegenerative diseases, and neuropsychiatric conditions.
Diagram Title: Multimodal Neuroimaging Research Workflow
Experimental Protocols and Methodological Considerations
Protocol Design for High-Resolution fMRI Studies
Implementing high-resolution fMRI requires careful consideration of multiple methodological factors to balance spatial resolution, signal quality, and experimental feasibility. Key parameters include magnetic field strength, pulse sequence selection, voxel size, and coverage. Ultra-high field systems (≥7T) are increasingly preferred for high-resolution studies due to their enhanced BOLD sensitivity and intrinsic SNR advantages [8]. Sequence selection typically involves T2*-weighted gradient-echo EPI or partial k-space acquisitions that optimize BOLD contrast while minimizing distortion and signal dropout in regions with magnetic susceptibility variations.
Protocol optimization must address the inherent trade-offs between spatial resolution, temporal resolution, and brain coverage. Reduced voxel sizes diminish SNR, potentially necessitating increased repetition times (TR) or additional signal averaging to maintain detection power. These adjustments consequently extend scan durations and increase vulnerability to physiological noise and motion artifacts [8]. Strategic compromises often include limiting high-resolution acquisition to specific regions of interest rather than whole-brain coverage, or employing multi-band acceleration techniques to preserve temporal resolution. For pharmacological fMRI studies, these considerations are particularly important as drug effects may manifest as subtle BOLD signal changes requiring adequate statistical power for detection.
Quality Assurance and Data Processing
Robquality control and specialized processing pipelines are essential components of high-resolution fMRI methodology. Quality assessment should monitor temporal signal-to-noise ratio (tSNR), physiological noise contamination, and subject motion throughout the acquisition [13]. For studies targeting cortical layer-specific activation, additional considerations include accounting for vascular effects from surface vessels, which can be addressed through surface regression techniques or vascular space occupancy (VASO) methods that enhance microvascular specificity [8].
Advanced preprocessing and analysis strategies further support high-resolution applications. Anatomical co-registration requires increased precision, often employing surface-based alignment techniques that better accommodate cortical folding patterns. Statistical analyses must address the multiple comparisons problem arising from the larger number of voxels while maintaining sensitivity to detect potentially focal activations. For laminar fMRI, specialized modeling approaches incorporate cortical depth-dependent hemodynamic response functions and account for the point spread function of the BOLD signal across layers [8]. These methodological refinements enable more accurate interpretation of high-resolution findings and their relationship to underlying neural computation architecture.
Table 3: Research Reagent Solutions for Advanced fMRI
| Material/Technique | Function/Purpose | Application Context |
|---|---|---|
| Ultra-High Field Scanners (7T+) | Increases BOLD sensitivity and SNR for smaller voxels [8] | High-resolution and laminar fMRI studies [8] |
| Multi-Channel RF Coils | Enhances spatial encoding and parallel imaging capabilities [8] | Accelerated high-resolution acquisitions [8] |
| Arterial Spin Labeling (ASL) | Provides quantitative CBF measurement alongside BOLD [8] | Disambiguating CBF and CMRO₂ contributions to BOLD [8] |
| Vascular Space Occupancy (VASO) | Measures CBV changes with better microvascular specificity [8] | Reducing venous contributions in high-resolution fMRI [8] |
| Multi-Band Sequences | Accelerates data acquisition through simultaneous multi-slice imaging [13] | Maintaining temporal resolution at high spatial resolution [13] |
| Cardiorespiratory Monitoring | Records physiological data for noise modeling [13] | Mitigating physiological noise in high-resolution data [13] |
| EEG-fMRI Compatible Systems | Enables simultaneous electrophysiological and hemodynamic recording [13] | Multimodal studies of neurovascular coupling [13] |
The BOLD signal remains a powerful tool for mapping human brain function, with ongoing technical advances continually expanding its spatial resolution and interpretative fidelity. High-resolution fMRI represents the cutting edge of these developments, pushing toward the scale of cortical columns and layers to reveal the fine-grained functional architecture of the brain. Nevertheless, the BOLD signal remains an indirect measure of neural activity with complex physiological underpinnings that must be carefully considered in experimental design and interpretation.
The future of fMRI and its role within the neuroimaging landscape will likely be shaped by several converging trends. Continued development of ultra-high field systems, sophisticated acquisition sequences, and advanced modeling approaches will further enhance spatial resolution and specificity. Simultaneously, the strategic integration of fMRI with complementary modalities like EEG and fNIRS will provide increasingly comprehensive characterizations of brain function across spatial and temporal domains. For researchers and drug development professionals, this multimodal perspective offers a powerful framework for investigating brain function in health and disease, leveraging the unique strengths of each technique while mitigating their individual limitations. As these technologies evolve, they promise to deepen our understanding of the human brain and accelerate the development of novel therapeutic interventions for neurological and psychiatric disorders.
In the multimodal landscape of modern neuroimaging, Electroencephalography (EEG) occupies a unique and crucial niche by providing direct measurement of neural electrical activity with unmatched temporal precision. While functional Magnetic Resonance Imaging (fMRI) excels at spatial localization of brain activity and functional Near-Infrared Spectroscopy (fNIRS) offers a balance of portability and hemodynamic measurement, EEG captures the brain's rapid electrical dynamics on a millisecond scale [2] [3] [16]. This technical deep dive explores the biophysical foundations, methodological approaches, and research applications of EEG, with particular focus on its role in complementing other neuroimaging modalities within a comprehensive brain investigation framework.
EEG's fundamental advantage lies in its direct measurement of the brain's electrical signals, unlike the indirect hemodynamic responses measured by fMRI and fNIRS [16]. Where fMRI tracks blood oxygenation changes with high spatial resolution but limited temporal resolution (seconds), and fNIRS measures cortical hemodynamics with better portability but similar temporal constraints, EEG captures neural events as they unfold in real-time [17] [2] [3]. This temporal precision makes EEG uniquely suited for investigating rapid cognitive processes, sensory perception, and the dynamic interplay of brain networks [18] [16].
Neural Basis of EEG Signals
Biophysical Foundations
The electrical potentials measured by EEG originate primarily from the summed postsynaptic potentials of pyramidal cells in the cerebral cortex [18]. These excitable cells function with intrinsic electrical properties, and their coordinated activity generates detectable magnetic and electrical fields [18]. When neurotransmitters bind to receptors on the postsynaptic membrane, they cause ion channels to open or close, resulting in voltage changes that last in the extracellular space for up to 200 milliseconds [18].
Unlike action potentials, which are too brief and asynchronous to be detected at the scalp, postsynaptic potentials involve slower changes in membrane permeability that occur synchronously across large populations of similarly oriented pyramidal cells [18]. The pyramidal cells' perpendicular orientation to the cortical surface creates a consistent dipole arrangement that allows their electrical fields to summate rather than cancel out, producing potentials strong enough to be detected through the intervening tissues of the brain, cerebrospinal fluid, skull, and scalp [18] [16].
Signal Characteristics and Measurement
EEG records the algebraic sum of excitatory and inhibitory postsynaptic potentials from millions of cortical neurons [18]. The electrical signal measured at the scalp represents the difference in electrical potential between two sites (typically termed "active" and "reference") over time [18]. These potential differences are extremely small, measured in microvolts (μV), requiring substantial amplification for analysis [18].
The placement of electrodes follows standardized systems such as the International 10-20 system, which ensures consistent positioning across subjects and studies [18] [16]. Modern high-density EEG systems can utilize 64, 128, or more electrodes distributed across the scalp, improving spatial sampling though still limited by the fundamental physics of electrical field dispersion through volume conduction [2] [18].
Methodological Framework for EEG Research
Event-Related Potentials (ERPs) Methodology
Event-Related Potentials (ERPs) represent a cornerstone of EEG experimental methodology, enabling researchers to extract neural responses time-locked to specific sensory, cognitive, or motor events [18]. Unlike continuous EEG recording, which reflects ongoing brain activity mixed with various neural processes, ERPs isolate the brain's response to discrete stimuli through signal averaging [18].
The ERP methodology involves repeated presentation of a stimulus while continuously recording EEG, then segmenting the EEG into epochs time-locked to stimulus onset [18]. Averaging these epochs across many trials preserves the consistent, stimulus-related neural activity while canceling out random, non-task-related brain activity and noise [18]. The resulting waveform reveals characteristic components (positive and negative peaks) that reflect specific stages of information processing [18].
Key ERP Components in Cognitive Research
ERP components are typically labeled according to their polarity (P for positive, N for negative) and their approximate latency in milliseconds [18]. These components reflect distinct stages of neural processing, from basic sensory perception to higher-order cognitive operations:
Early Components (P100, N100, P200): Generally linked with basic, low-level perception and considered largely automatic in nature [18]. These components are reliably elicited whenever a perceptual stimulus is presented and reflect initial sensory processing in modality-specific cortical areas.
N400 Component: Discovered by Kutas and Hillyard (1980), the N400 is a negativity peaking around 400 ms post-stimulus that is strongly associated with semantic processing [18]. It has been extensively studied in language research, showing sensitivity to semantic incongruity, word frequency, and contextual integration [18].
P300 Component: A positive deflection occurring approximately 300 ms after stimulus onset, the P300 is associated with attention allocation and context updating in working memory [18]. This component is often utilized in cognitive assessment and brain-computer interface applications.
Table 1: Characteristic ERP Components in Cognitive Neuroscience Research
| Component | Latency (ms) | Polarity | Functional Correlation | Primary Neural Generators |
|---|---|---|---|---|
| P100 | 80-120 | Positive | Early visual processing | Occipital cortex |
| N100 | 80-120 | Negative | Auditory/visual attention | Temporal/occipital cortex |
| P200 | 150-250 | Positive | Feature detection | Sensory-specific cortices |
| N200 | 200-350 | Negative | Conflict monitoring | Anterior cingulate cortex |
| P300 | 250-500 | Positive | Context updating | Temporoparietal junction |
| N400 | 300-500 | Negative | Semantic processing | Temporal lobes |
| Late Positive Potential (LPP) | 500-800 | Positive | Emotional processing | Parieto-occipital regions |
Comparative Analysis of Neuroimaging Modalities
Technical Specifications Across fMRI, EEG, and fNIRS
Each major neuroimaging technology offers distinct advantages and limitations based on their underlying physiological signals and measurement principles. Understanding these trade-offs is essential for selecting the appropriate methodology for specific research questions and for effectively integrating multiple modalities.
Table 2: Quantitative Comparison of Neuroimaging Modalities
| Parameter | EEG | fMRI | fNIRS |
|---|---|---|---|
| Temporal Resolution | Millisecond level [2] [18] | Seconds (0.33-2 Hz) [17] [2] | Seconds (hemodynamic response) [17] [16] |
| Spatial Resolution | Low (centimeters) [2] [16] | High (millimeters) [17] [2] | Moderate (centimeters) [17] [2] |
| Depth Penetration | Cortical surface [16] | Whole brain [17] | Superficial cortex (1-2 cm) [17] [2] |
| Measured Signal | Electrical potentials [18] | Blood oxygenation (BOLD) [17] | Hemoglobin concentration [17] |
| Portability | High [16] | None [17] [3] | High [17] [3] |
| Environment | Flexible [16] | Restricted [17] | Naturalistic [17] [3] |
| Participant Motion | Sensitive [16] | Highly sensitive [17] | Tolerant [3] [16] |
Complementary Strength in Multimodal Integration
The combination of EEG with fMRI and fNIRS leverages their complementary strengths to overcome individual limitations [17] [19]. Multimodal approaches can simultaneously capture the when (EEG), where (fMRI), and how (integrating temporal and spatial information) of neural processes [19].
EEG and fNIRS integration is particularly promising for naturalistic studies, as both modalities offer some degree of portability and motion tolerance [20] [16]. This combination provides concurrent measures of electrical neural activity and hemodynamic responses, enabling researchers to investigate neurovascular coupling in real-world settings [20] [16]. Recent studies have demonstrated the feasibility of this approach for semantic decoding during mental imagery tasks [20].
Similarly, simultaneous EEG-fMRI recording, though technically challenging due to electromagnetic interference, provides unparalleled spatiotemporal characterization of brain activity [19]. The trimodal integration of EEG, fMRI, and optical imaging (EROS) represents the cutting edge of multimodal neuroimaging, offering proof-of-concept evidence for comprehensive brain function investigation [19].
Experimental Implementation and Protocols
Standardized Experimental Paradigm
A typical EEG experiment follows a structured protocol to ensure reproducibility and valid interpretation of results. The standard setup includes:
Participant Preparation: Proper scalp preparation including cleaning and application of conductive gel or saline solution to ensure low impedance at electrode-skin interfaces [16]. Electrode placement according to the International 10-20 system or high-density configurations [18].
Stimulus Presentation: Controlled presentation of visual, auditory, or somatosensory stimuli using precision timing software to ensure accurate time-locking of neural responses [18]. Stimulus duration and inter-stimulus intervals are optimized for the specific ERP components of interest.
Data Acquisition: Continuous EEG recording with appropriate sampling rates (typically 250-1000 Hz or higher) to capture neural dynamics without aliasing [18]. Simultaneous recording of behavioral responses (reaction time, accuracy) when applicable.
Task Design: Implementation of specific cognitive tasks targeting particular neural processes. For language studies, this might include semantic categorization, syntactic violation detection, or phonological processing tasks [18].
Data Processing Pipeline
Raw EEG data undergoes extensive processing to extract meaningful neural signals:
Preprocessing: Filtering (typically 0.1-30 Hz for ERPs), artifact removal (ocular, cardiac, muscular), and bad channel rejection [18].
Epoch Extraction: Segmentation of continuous data into time windows surrounding stimulus events (e.g., -200 to 800 ms relative to stimulus onset) [18].
Baseline Correction: Removal of DC offsets by subtracting the mean amplitude of the pre-stimulus period from the entire epoch [18].
Averaging: Trial averaging within conditions to enhance signal-to-noise ratio and reveal consistent stimulus-related activity [18].
Component Analysis: Identification and quantification of specific ERP components through peak analysis, mean amplitude measurements, or latency analysis [18].
Table 3: Essential Research Equipment for EEG Studies
| Equipment | Specification | Research Function |
|---|---|---|
| EEG Amplifier | High-input impedance, 24-bit resolution, >100 dB common-mode rejection | Signal amplification and digitization while minimizing noise and interference |
| Active Electrodes | Integrated impedance conversion, silver/silver-chloride (Ag/AgCl) composition | Superior signal quality with reduced motion artifacts and environmental noise |
| Recording Cap | Electrode placement following 10-20 system, stretchable fabric | Standardized electrode positioning across subjects and studies |
| Conductive Gel | Electrolyte-chloride based, low impedance | Ensures stable electrical connection between scalp and electrodes |
| Stimulus Presentation Software | Millisecond precision timing, synchronization capabilities | Precise control and timing of experimental paradigms |
| Electrode Impedance Checker | Real-time impedance monitoring | Ensures signal quality through proper electrode-skin contact |
| Electromyography (EMG) Sensors | Surface electrodes with bipolar configuration | Monitoring and subsequent removal of muscle artifacts |
| Electrooculography (EOG) Electrodes | Placement near ocular muscles | Detection and removal of eye movement and blink artifacts |
| Faraday Cage | Electrically shielded enclosure | Minimization of environmental electromagnetic interference |
| Data Analysis Suite | Digital filtering, ICA, time-frequency analysis | Comprehensive processing and statistical analysis of neural signals |
Applications and Research Implications
EEG's millisecond temporal precision makes it indispensable for investigating the rapid dynamics of cognitive processes, particularly in language research, attention studies, and clinical applications [18]. The N400 component, for instance, has been instrumental in understanding how the brain processes semantic information and integrates meaning across words, sentences, and discourse contexts [18].
In clinical neuroscience, EEG and ERPs provide sensitive measures of neural dysfunction in various disorders, including schizophrenia, Alzheimer's disease, and attention-deficit disorders [18]. The non-invasive nature and relatively low cost of EEG also make it suitable for large-scale studies, longitudinal monitoring, and bedside assessments in clinical populations [16].
Emerging applications in brain-computer interfaces (BCIs) leverage EEG's real-time capabilities to create direct communication pathways between the brain and external devices [20]. These systems have shown promise for assistive technologies, neurorehabilitation, and augmentative communication, particularly for individuals with severe motor disabilities [20].
EEG remains an essential tool in the neuroimaging arsenal, providing unparalleled access to the brain's millisecond-scale electrical dynamics. While limited in spatial resolution compared to fMRI and fNIRS, its exceptional temporal resolution, relatively low cost, and flexibility make it ideally suited for investigating the rapid neural processes underlying cognition, perception, and action. The future of EEG lies in its integration with complementary neuroimaging modalities, enabling researchers to simultaneously capture both the when and where of brain activity, and ultimately leading to more comprehensive models of brain function in health and disease.
Functional Near-Infrared Spectroscopy (fNIRS) is a portable, non-invasive neuroimaging technology that uses low levels of non-ionizing light to record changes in cerebral blood flow in the brain through optical sensors placed on the scalp [4]. As an optical brain monitoring technique, fNIRS measures cortical hemodynamic responses—specifically, changes in oxygenated (HbO) and deoxygenated hemoglobin (HbR)—that occur in response to neural activity [21]. This measurement is based on the mechanism of neurovascular coupling, where neural activation triggers a hemodynamic response that delivers oxygenated blood to active brain regions [22].
The fundamental principle behind fNIRS is that near-infrared light (650-900nm) can penetrate biological tissues, including the skull, and is absorbed by chromophores in the brain, primarily hemoglobin [4]. By measuring changes in light absorption at different wavelengths, fNIRS can quantify relative changes in HbO and HbR concentrations, providing an indirect measure of neural activity [22]. The technique is particularly valuable for studying the outer layers of the cortex, typically reaching depths of approximately 1-2.5 centimeters beneath the scalp [2] [21].
Technical Foundation and Signal Generation
Physical Principles of Light-Tissue Interaction
fNIRS leverages the relative transparency of biological tissues to near-infrared light and the differential absorption properties of hemoglobin species. Within the 650-900nm range, light can penetrate several centimeters through tissue, allowing measurement of cortical brain activity [4]. Biological tissue is highly scattering; on average, light in this region travels approximately 1/10 mm before scattering [4].
The core physical principle involves the modified Beer-Lambert law, which relates the attenuation of light to the concentration of absorbing compounds in a highly scattering medium like brain tissue [4] [22]. When light enters at a source position on the fNIRS head cap, it diffuses throughout the tissue, reaching down to approximately the outer 5-8mm of the brain cortex based on previous modeling studies [4]. This light is then collected as it exits the head beneath discrete detectors that carry light back to photon detectors on the fNIRS instrument [4].
Neurovascular Coupling and Hemodynamic Response
The fNIRS signal is fundamentally tied to the brain's hemodynamic response through neurovascular coupling. When a brain region becomes active, a complex cascade of processes leads to increased energy demands. All processes of neural signaling require energy in the form of adenosine triphosphate (ATP), produced principally by mitochondria from glycolytic oxygenation of glucose [23].
During neural activation:
- Increased neural firing elevates the local cerebral metabolic rate of oxygen (CMRO2) [23]
- Transient oxygen consumption causes a brief build-up of deoxygenated hemoglobin [23]
- Vasodilatory response occurs within 1-2 seconds, increasing local cerebral blood flow [23]
- Oversupply of oxygenated blood results in a net increase in HbO and decrease in HbR [23] [22]
This hemodynamic response unfolds over several seconds, creating the characteristic fNIRS signal pattern of increased HbO and decreased HbR concentrations in active brain regions [22].
Figure 1: Neurovascular Coupling Pathway. This diagram illustrates the cascade from neural activity to the measurable fNIRS signal through metabolic and vascular responses.
Comparative Analysis with fMRI and EEG
Technical Comparison of Neuroimaging Modalities
The table below provides a quantitative comparison of fNIRS against two other major non-invasive neuroimaging techniques: functional Magnetic Resonance Imaging (fMRI) and Electroencephalography (EEG).
| Feature | fNIRS | fMRI | EEG |
|---|---|---|---|
| What It Measures | Hemodynamic response (HbO/HbR) [2] [21] | Blood oxygen level dependent (BOLD) signal [23] [24] | Electrical activity from cortical neurons [25] [21] |
| Signal Source | Changes in oxygenated/deoxygenated hemoglobin [21] | Changes in deoxyhemoglobin concentration [23] | Postsynaptic potentials in cortical neurons [25] [21] |
| Temporal Resolution | Low (seconds) [2] [21] | Low (seconds) [23] [2] | High (milliseconds) [2] [21] |
| Spatial Resolution | Moderate (centimeter-level) [2] [21] | High (millimeter-level) [2] | Low (centimeter-level) [2] [21] |
| Depth of Measurement | Outer cortex (~1-2.5 cm) [4] [21] | Whole brain [23] [24] | Cortical surface [25] [21] |
| Portability | High [2] [21] | Low [2] | High [2] [21] |
| Motion Tolerance | Moderate to High [2] [21] | Low [23] | Low [2] [21] |
| Setup Complexity | Moderate [21] | High [23] | Moderate [21] |
| Cost | Moderate [2] | High [2] | Low to Moderate [2] [21] |
Methodological Strengths and Limitations
fNIRS Advantages: fNIRS offers a unique balance of portability, moderate spatial resolution, and reasonable motion tolerance, making it suitable for naturalistic study designs [2] [21]. Unlike fMRI, which requires a supine position in a confined scanner, fNIRS uses flexible fiber optic cables that allow neuroimaging experiments during standing, walking, or other ecological behaviors [4]. Compared to EEG, fNIRS provides superior spatial localization of cortical activity and is less susceptible to electrical artifacts from muscle movement or environmental noise [21].
fNIRS Limitations: The technique is limited to measuring cortical surfaces and cannot access subcortical structures [4] [21]. Its temporal resolution is constrained by the slow hemodynamic response (seconds) compared to the millisecond resolution of EEG [2] [21]. Spatial resolution remains inferior to fMRI, and the signal can be contaminated by physiological artifacts from scalp blood flow [22].
fMRI Advantages: fMRI provides whole-brain coverage with high spatial resolution, making it ideal for mapping distributed brain networks [23] [24]. The BOLD signal is well-validated and standardized across research centers.
EEG Advantages: EEG captures neural activity directly with millisecond temporal resolution, ideal for studying rapid cognitive processes, event-related potentials, and oscillatory brain dynamics [25] [21].
Experimental Protocols and Methodologies
Representative fNIRS Experimental Protocol
A representative fNIRS study investigating vestibular function during balance tasks illustrates key methodological considerations [4]. This study used a 32-channel continuous wave fNIRS instrument with two wavelengths (690nm and 830nm) to record blood flow changes in frontal, motor, sensory, and temporal cortices during active balancing while playing a video game simulating downhill skiing [4].
Participants and Setup:
- Nine right-handed volunteers with no balance or mobility disorders [4]
- fNIRS head cap constructed from plastic materials and Velcro with 32 source-detector combinations at 3.2cm spacing [4]
- Prior to recording, the fNIRS probe position was registered on each subject's head using a 3D stylus for inter-subject data registration and image reconstruction [4]
Task Design:
- Participants stood on an instrumented balance board controlling a ski avatar in a video game [4]
- Experimental design included 30-second standing rest periods before and after each task trial [4]
- Task difficulty was manipulated (beginner vs. advanced levels) with timing self-paced by participants [4]
- Each subject performed 6 trials at beginner level and 8 trials at advanced level [4]
Control Condition:
- In three subjects, an additional control task was performed where the subject watched the video game but stood still [4]
- This controlled for visual stimulus effects unrelated to the balance task itself [4]
Figure 2: fNIRS Experimental Workflow. This diagram outlines the key steps in a representative fNIRS study investigating balance control.
Signal Processing and Data Analysis
fNIRS data processing typically involves multiple stages to extract meaningful hemodynamic responses from raw optical signals [26] [22]. The dynamic nature of the fNIRS signal incorporates several physiological components that must be accounted for during analysis:
Preprocessing Steps:
- Conversion of light attenuation to concentration changes using the modified Beer-Lambert law [4] [22]
- Motion artifact correction to address signal contamination from participant movement [22]
- Filtering to remove physiological noise (cardiac pulsation ~1Hz, respiration ~0.3Hz, Mayer waves ~0.1Hz) [26]
- Baseline correction to account for signal drift [22]
Hemodynamic Response Modeling: Advanced fNIRS analysis incorporates dynamic models that account for arterial pulsations, frequency drifts, reflected waves, the hemodynamic response function (HRF), Mayer waves, respiratory waves, and other very low-frequency components [26]. These models help validate signal processing algorithms and improve the interpretation of fNIRS data in both resting-state and task-based paradigms [26].
Statistical Analysis: Similar to fMRI, fNIRS data are often analyzed using general linear models (GLM) to test hypotheses about condition-specific differences in brain activation [23] [22]. Statistical parametric maps can be generated to localize significant hemodynamic responses to experimental tasks.
Research Reagent Solutions and Equipment
Essential Materials for fNIRS Research
The table below details key equipment and materials required for conducting fNIRS research, based on methodologies from cited studies.
| Item | Function | Specifications/Examples |
|---|---|---|
| fNIRS Instrument | Measures light attenuation and computes hemoglobin concentrations | 32-channel continuous wave system (e.g., CW6 Real-time system; TechEn Inc) [4] |
| Light Sources | Emits near-infrared light into tissue | Laser diodes or LEDs at multiple wavelengths (690nm, 830nm) [4] |
| Detectors | Captures light that has traveled through tissue | Photomultiplier tubes or avalanche photodiodes [4] |
| Optodes | Interface between instrument and scalp | Source and detector fibers placed on scalp with 3-5cm spacing [4] |
| Head Cap | Holds optodes in stable positions on scalp | Plastic materials with Velcro adjustments [4] |
| Registration System | Maps optode locations to brain anatomy | 3D digitizer (e.g., FastSCAN stylus; Polhemus) [4] |
| Calibration Materials | Verifies system performance before data collection | Phantom with known optical properties [4] |
Applications in Research and Clinical Contexts
Research Applications
fNIRS has been applied across diverse research domains leveraging its unique combination of portability and hemodynamic monitoring capabilities:
Motor Control and Balance Research: The representative study discussed previously demonstrates fNIRS application for measuring cortical activation during dynamic balance tasks, revealing activation of the superior temporal gyrus modulated by task difficulty [4].
Psychiatric Research: fNIRS shows growing relevance in psychiatry as a potential tool for monitoring neurofunctional changes related to treatment [22]. Studies have applied fNIRS to monitor treatment response across various psychiatric disorders including depression, schizophrenia, and ADHD [22].
Addiction Research: fNIRS serves as an elective tool to assess real-time neural activity with high ecological validity in addiction research, studying both substance and behavioral dependence [27].
Cognitive Neuroscience: fNIRS is widely used to study higher-order cognitive processes including attention, emotion regulation, and executive functions, particularly benefiting from its tolerance for some movement during measurements [21].
Clinical Applications
Surgical Planning: While less established than fMRI for surgical mapping, fNIRS has potential for identifying eloquent cortical areas to be preserved during neurosurgical procedures [24].
Neurorehabilitation: fNIRS shows promise for monitoring brain reorganization during recovery from stroke or brain injury, and for guiding rehabilitation protocols [4].
Treatment Monitoring: In psychiatric practice, fNIRS has been investigated for monitoring response to pharmacological, psychotherapeutic, and neuromodulatory treatments [22].
Future Directions and Methodological Advancements
The future evolution of fNIRS technology and applications focuses on several key areas:
Methodological Standardization: Current research shows significant variability in fNIRS methodologies, with only 44.7% of studies reporting motion correction procedures and 53.2% not reporting activation direction [22]. Future work needs standardized protocols for design and reporting to enhance reproducibility [22].
High-Density Systems: Technological advances are increasing channel counts, with over half of recent studies using high-density (>32-channel) systems to improve spatial resolution and coverage [22].
Multimodal Integration: Combining fNIRS with EEG provides complementary information by capturing both hemodynamic and electrical neural activity simultaneously [21]. Integrated systems require careful synchronization and artifact management but deliver richer datasets [21].
Analytical Advancements: More sophisticated signal processing algorithms and dynamic models of brain hemodynamics continue to improve the accuracy and interpretability of fNIRS signals [26].
Clinical Translation: Efforts are underway to establish fNIRS as a validated biomarker for disease states and treatment response across neurological and psychiatric conditions [22].
Understanding the strengths and limitations of non-invasive neuroimaging technologies is crucial for designing robust neuroscience research and developing effective clinical applications. Functional Magnetic Resonance Imaging (fMRI), Electroencephalography (EEG), and functional Near-Infrared Spectroscopy (fNIRS) represent three prominent techniques that enable researchers to investigate brain function through different physiological windows. Each method captures distinct neural correlates with varying spatiotemporal resolutions, portability, and practical implementation requirements. This technical guide provides a comprehensive comparative analysis of these modalities, framing their core principles within contemporary neuroscience research and drug development contexts. By synthesizing their fundamental measurement mechanisms, inherent technical constraints, and experimental considerations, this review aims to equip researchers with the knowledge needed to select appropriate neuroimaging tools for specific investigative questions and clinical applications, particularly as multimodal approaches continue to advance the field [17] [28].
Physiological Origins of Measured Signals
Neuroimaging techniques capture brain activity through different physiological processes. fMRI measures neural activity indirectly via the Blood Oxygen Level Dependent (BOLD) signal, which reflects changes in blood oxygenation, flow, and volume associated with neuronal firing [17]. This hemodynamic response typically lags 4-6 seconds behind neural activity, with a sampling rate generally ranging from 0.33 to 2 Hz [17]. The BOLD effect originates from neurovascular coupling, where localized neural activity triggers increased cerebral blood flow that exceeds oxygen consumption, resulting in decreased deoxygenated hemoglobin in venous blood [17].
In contrast, EEG directly measures electrical potentials generated by synchronized postsynaptic activity of cortical pyramidal neurons [29]. These electrical signals are conducted through various tissues including cerebrospinal fluid, skull, and scalp, where they are detected by electrodes placed on the scalp surface [29]. EEG provides exceptional temporal resolution at the millisecond level, enabling real-time tracking of neural dynamics [20] [29].
fNIRS operates on a similar hemodynamic principle as fMRI but uses near-infrared light (650-950 nm) to measure changes in oxygenated hemoglobin (HbO) and deoxygenated hemoglobin (HbR) concentrations in cortical surface vasculature [17] [30]. The technique leverages the "optical window" where biological tissues have relatively low absorption, allowing light to penetrate several centimeters to reach the cerebral cortex [30]. fNIRS signals are typically sampled at rates around 10 Hz, bridging the temporal gap between fMRI and EEG [31] [32].
Comparative Technical Specifications
Table 1: Comprehensive comparison of core technical specifications across fMRI, EEG, and fNIRS.
| Feature | fMRI | EEG | fNIRS |
|---|---|---|---|
| Core Measurement Principle | Blood Oxygen Level Dependent (BOLD) effect via magnetic susceptibility changes [17] | Electrical potentials from synchronized neuronal activity [29] | Hemodynamic responses via near-infrared light absorption [17] [30] |
| Primary Signal Source | Deoxygenated hemoglobin in venous blood [17] | Post-synaptic potentials of cortical pyramidal neurons [29] | Concentration changes of HbO and HbR in cortical vasculature [17] [30] |
| Temporal Resolution | Low (0.33-2 Hz, limited by hemodynamic response latency of 4-6s) [17] | Very High (millisecond precision) [20] [29] | Moderate (seconds-level, typically ~11 Hz sampling) [31] [32] |
| Spatial Resolution | Very High (millimeter-level) [17] | Low (centimeter-level) [20] | Moderate (1-3 cm, superior to EEG) [17] [29] |
| Depth Penetration | Whole brain (cortical and subcortical) [17] | Cortical surface [29] | Superficial cortex (1-2.5 cm depth) [30] [29] |
| Direct vs. Indirect Neural Measure | Indirect (hemodynamic response) [17] | Direct (electrical activity) [29] | Indirect (hemodynamic response) [17] |
| Portability | Very Low (immobile scanner) [17] | High (wearable systems available) [33] [29] | High (portable/wearable formats) [17] [29] |
| Tolerance to Motion Artifacts | Low (highly sensitive to movement) [17] | Moderate (susceptible to movement, especially head/neck muscles) [33] [31] | High (relatively robust to movement) [29] [31] |
| Typical Experimental Environment | Controlled laboratory with magnetic shielding [17] | Controlled lab to semi-naturalistic settings [33] | Laboratory to fully naturalistic environments [17] [33] |
Inherent Limitations and Methodological Constraints
Technical and Physiological Limitations
Each neuroimaging modality presents distinct limitations that researchers must consider during experimental design. fMRI provides unparalleled spatial resolution for deep brain structures but suffers from several constraints including high cost, immobility, sensitivity to motion artifacts, and requirement for participants to remain motionless within the scanner environment [17]. These limitations impede studies involving naturalistic behaviors, children, or individuals with motor impairments [17]. Furthermore, the temporal resolution of fMRI is fundamentally constrained by the hemodynamic response latency [17].
EEG's primary limitations include low spatial resolution (approximately 2 cm) due to signal dispersion through skull and scalp tissues, and high susceptibility to various artifacts including ocular activity, head and neck muscle movements, and environmental noise [20] [33]. While advanced source localization techniques can improve spatial precision, EEG remains predominantly sensitive to synchronous activity of aligned pyramidal neurons in cortical surface regions [29].
fNIRS is confined to monitoring superficial cortical regions due to limited penetration depth of near-infrared light, making it unsuitable for investigating subcortical structures [17] [30]. Its spatial resolution (typically 1-3 centimeters) is lower than fMRI, restricting precise localization of brain activity [17]. Extracerebral factors such as scalp blood flow and hair can confound fNIRS measurements, while systemic physiological changes (cardiac, respiratory, blood pressure) can introduce signal contaminants that mimic neural activation patterns [33].
Practical Implementation Challenges
Practical considerations significantly influence modality selection. fMRI systems entail substantial capital investment, maintenance costs, and specialized facilities with magnetic shielding, limiting accessibility for many research institutions [17]. Participant exclusion criteria are more extensive for fMRI, including metal implants, certain medical devices, claustrophobia, and body size restrictions [17].
EEG setup complexity varies by system type, with traditional research-grade systems requiring electrode gel application and scalp preparation to ensure impedance reduction [29]. While dry electrode and wireless systems have improved usability, signal quality considerations often necessitate traditional wet electrode setups for high-quality data acquisition [33].
fNIRS systems generally involve moderate setup complexity with optode placement requiring minimal skin contact compared to EEG [29]. However, dark hair, pigmented skin, or optode movement can challenge signal quality [33]. The technology's relative novelty means standardized analysis pipelines and protocols are less established than for fMRI or EEG [30] [33].
Table 2: Methodological constraints and practical limitations across neuroimaging modalities.
| Constraint Type | fMRI | EEG | fNIRS |
|---|---|---|---|
| Financial Burden | Very High (expensive equipment, maintenance, facilities) [17] | Generally Lower [29] | Generally Higher (especially high-density systems) [29] |
| Participant Exclusions | Extensive (metal implants, pacemakers, cochlear implants, claustrophobia) [17] [30] | Minimal (skin conditions) [30] | Minimal (primarily scalp conditions) [30] |
| Setup Time | Extended (positioning, shimming, structural scans) | Moderate (electrode application and impedance checking) [29] | Moderate (optode placement and signal quality verification) |
| Environmental Requirements | Highly controlled (electromagnetic shielding, acoustic damping) [17] | Moderately controlled (electrical noise shielding) [33] | Flexible (laboratory to real-world environments) [17] [33] |
| Data Acquisition Complexity | High (sequence optimization, physiological monitoring) [17] | Moderate (artifact monitoring, reference selection) | Moderate (signal quality optimization, short-separation channels) [33] |
| Analysis Pipeline Maturity | High (well-established preprocessing and statistical frameworks) | High (decades of methodological development) | Moderate (emerging standards, ongoing methodology development) [28] [33] |
Experimental Design and Protocol Considerations
Paradigm Design Across Modalities
Experimental design must accommodate the temporal and physiological characteristics of each modality. For fMRI, the delayed hemodynamic response necessitates block designs or event-related designs with sufficient inter-stimulus intervals to allow the BOLD signal to return to baseline [17]. Rapid event-related designs must account for hemodynamic response overlap and nonlinear summation [17].
EEG paradigms can exploit the millisecond temporal resolution with precise stimulus presentation and randomized inter-trial intervals to avoid anticipatory potentials confounding results [20]. Motor imagery tasks, for instance, typically employ 2-second cue presentation followed by 10-second execution phases with adequate inter-trial rests [31].
fNIRS experimental designs balance the slower hemodynamic response (2-6 second delay) with the need for sufficient task duration to capture meaningful hemodynamic changes [29]. Motor imagery protocols often structure trials with visual cues (2 seconds), execution phases (10 seconds), and inter-trial intervals (15 seconds) to capture the complete hemodynamic response while minimizing fatigue [31].
Protocol Implementation Examples
Semantic Category Decoding Protocol: A simultaneous EEG-fNIRS study investigating semantic neural decoding employed a paradigm where participants performed four mental tasks (silent naming, visual imagery, auditory imagery, tactile imagery) when shown images of animals or tools [20]. Each trial included a 3-second mental task period following visual cue presentation, with participants instructed to minimize movements during data acquisition [20].
Motor Imagery BCI Protocol: The HEFMI-ICH dataset implementation for intracerebral hemorrhage rehabilitation featured a standardized left-right hand motor imagery paradigm with 2-second visual cue presentation, 10-second execution phase with kinesthetic motor imagery, and 15-second inter-trial intervals [31]. The protocol included preparatory grip strength calibration to enhance motor imagery vividness [31].
Resting-State Functional Connectivity Protocol: An fNIRS study distinguishing minimally conscious from unresponsive patients employed a 5-minute resting-state recording in a quiet environment without external stimuli, with patients positioned at a 30° angle and arousal stimulation applied before assessment [32].
Multimodal Integration: Synergistic Approaches
Fusion Methodologies and Applications
Integrating complementary neuroimaging modalities enables researchers to overcome individual technological limitations and achieve more comprehensive brain activity characterization [17] [28]. EEG-fNIRS hybrid systems have demonstrated particular promise, capitalizing on EEG's millisecond temporal resolution and fNIRS's superior spatial localization [34] [28] [31]. This synergistic approach has enhanced classification accuracy in brain-computer interfaces by 5%-10% compared to unimodal systems [31].
Multiple fusion strategies have been developed, including data-driven unsupervised symmetric techniques, data concatenation, model-based approaches, and decision-level fusion [28] [33]. For instance, one innovative motor imagery classification framework extracted spatiotemporal features from EEG using dual-scale temporal convolution and depthwise separable convolution, while employing spatial convolution across channels and GRU networks for fNIRS temporal dynamics [34]. Decision fusion utilized Dirichlet distribution parameter estimation and Dempster-Shafer theory to model uncertainty and combine evidence from both modalities [34].
fMRI-fNIRS integration represents another powerful combination, leveraging fMRI's high spatial resolution with fNIRS's portability and superior temporal resolution [17]. This approach enables robust spatiotemporal mapping of neural activity, with applications spanning motor, cognitive, and clinical tasks [17]. Synchronous and asynchronous integration modes have advanced research in neurological disorders, social cognition, and neuroplasticity [17].
Implementation Challenges in Multimodal Research
Despite the theoretical advantages, practical implementation of multimodal neuroimaging presents significant challenges. Hardware incompatibilities, such as electromagnetic interference between EEG and MRI systems, require specialized equipment and shielding solutions [17]. Experimental limitations include restricted motion paradigms and the complexity of coordinating multiple acquisition systems [17] [28].
Data fusion complexities arise from fundamentally different signal origins, temporal resolutions, and artifact profiles [28] [33]. Preprocessing pipelines must be developed separately for each modality before integration, employing techniques such as joint Independent Component Analysis, canonical correlation analysis, or machine learning approaches that combine feature sets from both modalities [29]. Temporal synchronization remains critical, typically achieved through external hardware triggers or shared clock systems [31].
Sensor placement compatibility presents another challenge, often addressed through integrated caps with predefined compatible openings or optode holders that avoid electrode contact points [29]. Motion artifacts, while less problematic for fNIRS alone, become more complex when combined with EEG, necessitating tight but comfortable cap fittings and advanced motion correction algorithms during preprocessing [29].
Experimental Setup and Hardware Components
Table 3: Essential equipment and resources for neuroimaging research across modalities.
| Resource Category | Specific Equipment/Software | Function/Purpose | Representative Examples |
|---|---|---|---|
| Data Acquisition Systems | fMRI Scanner | High-field magnetic resonance imaging for BOLD signal detection | 3T Siemens Prisma, 7T Philips Achieva |
| EEG Amplifier System | Multi-channel electrical potential recording with high temporal resolution | g.HIamp amplifier (g.tec), BioSemi ActiveTwo | |
| fNIRS System | Continuous-wave hemodynamic monitoring using near-infrared light | NirScan (Huichuang), NirSmart-6000A (Huichuang) | |
| Experimental Paradigm Software | Stimulus Presentation | Precise timing and delivery of experimental tasks | E-Prime 3.0, PsychoPy, Presentation |
| Sensor Integration Solutions | Hybrid EEG-fNIRS Caps | Compatible sensor placement for simultaneous acquisition | Custom-designed caps with 10-20 system alignment [31] |
| Synchronization Hardware | TTL Pulse Systems | Temporal alignment of multiple data streams | Parallel port triggers, shared clock systems [31] |
Data Processing and Analytical Tools
Advanced analytical tools are essential for extracting meaningful neural information from acquired signals. For fMRI data, statistical parametric mapping packages (SPM, FSL, AFNI) provide comprehensive preprocessing, statistical analysis, and visualization capabilities [17]. These tools employ general linear models and random effects analyses to identify task-related activation patterns.
EEG processing pipelines typically include tools like EEGLAB, FieldTrip, or MNE-Python for filtering, artifact removal, independent component analysis, time-frequency analysis, and event-related potential quantification [20] [33]. These platforms support source localization and connectivity analyses.
fNIRS analysis benefits from toolboxes such as Homer2, NIRS-KIT, and BRAPH, which implement modified Beer-Lambert law conversion, motion artifact correction, physiological noise filtering, and general linear modeling for statistical inference [32]. These tools facilitate functional connectivity analysis and brain network characterization.
Multimodal fusion approaches employ specialized algorithms including joint Independent Component Analysis, canonical correlation analysis, and machine learning frameworks that integrate heterogeneous feature sets from multiple modalities [28] [29]. Deep learning architectures have shown particular promise for extracting complementary information from EEG and fNIRS signals [34] [28].
fMRI, EEG, and fNIRS each offer unique windows into brain function with complementary strengths and limitations. fMRI provides unparalleled spatial resolution for whole-brain imaging but lacks portability and temporal precision. EEG captures neural dynamics with millisecond resolution but suffers from limited spatial specificity. fNIRS balances moderate spatiotemporal resolution with enhanced portability and motion tolerance. The choice among these modalities depends critically on research questions, target brain processes, logistical constraints, and participant populations. Future advancements will likely focus on standardized multimodal integration frameworks, improved artifact rejection algorithms, and enhanced computational methods for decoding complex brain states from heterogeneous neural signals. As these technologies continue to evolve, they will collectively expand our capacity to investigate brain function in increasingly naturalistic settings and diverse populations, ultimately advancing both basic neuroscience and clinical applications.
Strategic Application and Use Cases: Selecting the Right Tool for Your Research
Functional Magnetic Resonance Imaging (fMRI) has established itself as a cornerstone technique in cognitive neuroscience and clinical research since its inception in the early 1990s [17] [9]. Its primary strength lies in providing high-resolution spatial mapping of brain activity by detecting Blood Oxygen Level Dependent (BOLD) signals, which reflect changes in blood oxygenation related to neural activity [17] [3]. When positioned within the broader landscape of neuroimaging technologies, fMRI occupies a unique niche that complements other major techniques like electroencephalography (EEG) and functional near-infrared spectroscopy (fNIRS). Understanding this relationship is crucial for researchers and drug development professionals selecting appropriate methodologies for specific investigational needs.
The fundamental physics underlying fMRI leverages the different magnetic properties of oxygenated hemoglobin (diamagnetic) and deoxygenated hemoglobin (paramagnetic) [9]. When neuronal activity increases in a specific brain region, it triggers a hemodynamic response that delivers oxygenated blood, altering the local magnetic susceptibility and generating the measurable BOLD signal [9]. This neurovascular coupling forms the basis for fMRI's ability to map brain function, though it introduces an inherent temporal lag of 4-6 seconds between neural activity and the measured response [17].
Within the multimodal neuroimaging paradigm, each technique offers distinct advantages and limitations. fMRI provides unparalleled spatial resolution for deep brain structures, EEG delivers exceptional temporal resolution for cortical electrical activity, and fNIRS offers a balance of portability and moderate resolution for surface cortical monitoring [2] [35] [36]. This whitepaper examines the ideal applications of fMRI, with particular emphasis on its superior capabilities for deep brain mapping, clinical diagnostics, and comprehensive network connectivity analysis—areas where its technical strengths provide significant advantages over other neuroimaging modalities.
Technical Comparative Analysis of Neuroimaging Modalities
Quantitative Comparison of fMRI, EEG, and fNIRS
Table 1: Technical Specifications of Major Neuroimaging Modalities
| Parameter | fMRI | EEG | fNIRS |
|---|---|---|---|
| Spatial Resolution | High (mm to sub-mm) [2] [9] | Low (source localization challenges) [35] [36] | Moderate (1-3 cm) [17] [35] |
| Temporal Resolution | Moderate (seconds) [17] [35] | Very high (millisecond range) [35] [36] | High (0.1-10 Hz) [17] [35] |
| Depth Penetration | Whole-brain, including subcortical structures [17] | Cortical surface [36] | Outer cortex (~1-2.5 cm deep) [17] [36] |
| Portability | Low (requires scanner environment) [3] [9] | Moderate to high [35] [36] | High [3] [35] |
| Motion Tolerance | Low [17] [3] | Moderate [35] | High [3] [9] |
| Cost | High [3] [2] | Low to moderate [35] [36] | Low to moderate [3] [35] |
| Primary Signal Measured | BOLD response (blood oxygenation) [3] [9] | Electrical activity [36] | Hemodynamic response (HbO/HbR) [3] [36] |
Application-Based Modality Selection
Table 2: Ideal Applications and Limitations by Modality
| Modality | Ideal Applications | Key Limitations |
|---|---|---|
| fMRI | Deep brain mapping, clinical diagnostics, whole-brain network connectivity, structure-function relationships [17] [37] [38] | Low temporal resolution, scanner noise, claustrophobia concerns, motion sensitivity, high cost [17] [3] [9] |
| EEG | Epilepsy monitoring, sleep studies, rapid cognitive processes, event-related potentials, brain-computer interfaces [20] [36] | Poor spatial resolution, limited to cortical surfaces, sensitivity to muscle artifacts [2] [36] |
| fNIRS | Naturalistic settings, pediatric populations, rehabilitation monitoring, movement-friendly studies, longitudinal bedside monitoring [3] [35] [9] | Superficial penetration only, limited spatial resolution, lacks anatomical information [17] [3] |
Core fMRI Methodologies and Experimental Protocols
fMRI Experimental Design and Data Acquisition
The implementation of valid fMRI research requires meticulous experimental design and data acquisition protocols. The fundamental workflow begins with careful task paradigm design, which can be organized into block designs or event-related designs [17]. Block designs involve alternating periods of task performance and rest, maximizing detection power for sustained neural processes. Event-related designs present discrete trials with randomized intervals, enabling analysis of transient hemodynamic responses to individual stimuli.
For BOLD fMRI acquisition, standard parameters include: repetition time (TR) = 2000 ms (0.5 Hz sampling rate), echo time (TE) = 30 ms, flip angle = 70-90°, voxel size = 2-3 mm isotropic [17] [38]. Parallel imaging techniques (e.g., GRAPPA, SENSE) can accelerate acquisition. The minimal temporal resolution is constrained by the hemodynamic response latency (4-6 seconds), though sampling rates typically range from 0.33 to 2 Hz [17]. High-resolution anatomical scans (T1-weighted MP-RAGE sequence, ~1 mm³ resolution) are acquired concurrently for spatial normalization and localization.
Diagram 1: fMRI Experimental Workflow
Functional Connectivity Mapping Protocols
Resting-state fMRI (rs-fMRI) has emerged as a powerful paradigm for investigating intrinsic brain networks without task demands [38]. Standardized protocols require participants to maintain alertness with eyes open or closed while minimizing structured thought [38]. A minimum of 10 minutes of resting-state data (300+ volumes at TR=2000 ms) is recommended for reliable connectivity estimation [38].
Contemporary connectivity analysis extends beyond Pearson correlation to include:
- Precision-based methods: Inverse covariance approaches that emphasize direct connections [38]
- Spectral measures: Frequency-dependent connectivity using wavelet transforms [38]
- Information-theoretic measures: Mutual information and entropy-based associations [38]
Recent benchmarking of 239 pairwise interaction statistics revealed substantial variation in network features depending on the chosen connectivity metric [38]. Precision-based and stochastic interaction statistics demonstrated superior structure-function coupling and individual fingerprinting capabilities [38].
Advanced fMRI Applications and Integration Paradigms
Multimodal Integration: fMRI-fNIRS Synergies
The combined use of fMRI and fNIRS represents a particularly powerful multimodal approach that capitalizes on their complementary strengths [17] [9]. Integration methodologies are categorized into synchronous acquisition (simultaneous data collection) and asynchronous acquisition (separate sessions with careful temporal alignment) [17].
Synchronous fMRI-fNIRS protocols require specialized MRI-compatible fNIRS equipment with fiber-optic cables that minimize electromagnetic interference [17]. The optimal approach involves:
- Hardware Coordination: Synchronizing acquisition clocks between systems
- MR Artifact Mitigation: Implementing optical filtering algorithms to remove gradient-induced noise
- Spatial Coregistration: Using digitizer systems to map fNIRS optode positions to MRI coordinate space
This integrated approach enables high spatial resolution from fMRI to inform the depth limitations of fNIRS, while fNIRS provides superior temporal resolution and validation of hemodynamic origin [17]. Successful applications include motor task validation, where strong correlations between fMRI BOLD and fNIRS HbO signals confirm neural activation patterns [17] [3].
The Researcher's Toolkit: Essential Materials and Reagents
Table 3: Essential Research Materials for fMRI Studies
| Item | Function/Application | Technical Specifications |
|---|---|---|
| High-Density Atlas | Brain parcellation for connectivity analysis | Glasser (180 regions per hemisphere) or Schaefer (100-1000 regions) atlases for network partitioning [37] [38] |
| Structure-Function Coupling Metrics | Quantifying SC-FC relationship | Structural-decoupling index (SDI) to measure (dis)alignment [39] |
| Multimodal Integration Tools | Combining fMRI with other modalities | MATLAB Toolboxes (NIRS, Homer2), Python (MNE, NiBabel) [17] [39] |
| Physiological Monitoring Equipment | Recording confounding signals | Pulse oximeter, respiratory belt, eye tracker for noise regression [38] |
| Quality Control Metrics | Ensuring data reliability | Framewise displacement (FD < 0.2 mm), DVARS (D temporal derivative of RMS variance over voxels) [38] |
Signaling Pathways and Neural Correlates
The neurovascular coupling mechanism forms the fundamental biological pathway that enables fMRI signal detection. This process begins with glutamate-mediated neuronal activation, triggering calcium influx into postsynaptic neurons and activating nitric oxide synthase (NOS) [9]. The resulting nitric oxide (NO) diffuses to adjacent arterioles, triggering vasodilation and increased cerebral blood flow (CBF) [9].
This neurovascular response evolves through distinct phases:
- Initial dip (0-2s): Transient increase in oxygen consumption, slightly increasing deoxyhemoglobin
- Overcompensation (2-7s): Marked increase in CBF, substantially decreasing deoxyhemoglobin
- Undershoot: Post-stimulus return to baseline with potential brief overshoot
The BOLD signal primarily reflects the net concentration of deoxygenated hemoglobin, which acts as an endogenous paramagnetic contrast agent [9]. The complex relationship between neural activity and hemodynamic response necessitates careful interpretation, as the BOLD signal represents integrated synaptic activity (local field potentials) rather than spiking activity [9].
Diagram 2: Neurovascular Coupling Pathway
fMRI maintains its position as an indispensable tool for deep brain mapping, clinical diagnostics, and comprehensive network connectivity analysis. Its high spatial resolution and whole-brain coverage provide distinct advantages over EEG and fNIRS for investigating subcortical structures and large-scale network dynamics. The future of fMRI lies not in supplanting other modalities, but in strategic integration within multimodal frameworks that leverage their complementary strengths.
Emerging directions include machine learning approaches for optimizing fMRI-fNIRS data fusion, hardware innovations for MRI-compatible fNIRS probes, and standardized protocols for cross-modal validation [17]. Additionally, the development of sophisticated connectivity metrics beyond simple correlation continues to enhance fMRI's utility for mapping the brain's complex network architecture [38]. For researchers and drug development professionals, this evolving landscape offers powerful opportunities to select and combine neuroimaging techniques based on specific experimental requirements, with fMRI remaining the gold standard for applications demanding high spatial resolution and deep brain access.
Electroencephalography (EEG) occupies a unique position in the pantheon of neuroimaging techniques, offering unparalleled temporal resolution to capture neural dynamics at the millisecond scale. When contextualized alongside other major modalities—functional magnetic resonance imaging (fMRI) and functional near-infrared spectroscopy (fNIRS)—EEG's specific value proposition becomes clear. While fMRI measures blood oxygenation changes related to neural activity with high spatial resolution (millimeters) but limited temporal resolution, and fNIRS measures hemodynamic responses in surface cortical areas with moderate resolution, EEG directly measures electrical activity from synchronized neuronal firing with millisecond precision [2] [3] [40]. This fundamental difference in measurement principle dictates their ideal applications: fMRI excels at precise spatial localization, fNIRS offers a balance of portability and moderate resolution for naturalistic settings, while EEG remains unmatched for capturing the rapid temporal dynamics of brain function [40].
This technical guide explores three domains where EEG's capabilities are particularly advantageous: Event-Related Potentials (ERPs) for cognitive processing, sleep studies for staging and disorder diagnosis, and epileptic seizure detection for clinical management. For each application, we provide detailed methodologies, quantitative frameworks, and technical protocols to equip researchers and clinicians with practical implementation knowledge.
Table 1: Comparison of Key Neuroimaging Modalities
| Feature | EEG | fMRI | fNIRS |
|---|---|---|---|
| What It Measures | Electrical activity from cortical neurons | Blood oxygenation level-dependent (BOLD) response | Hemodynamic response (oxygenated/deoxygenated hemoglobin) |
| Temporal Resolution | High (milliseconds) [40] | Low (seconds) [2] | Low (seconds) [40] |
| Spatial Resolution | Low (centimeter-level) [40] | High (millimeter-level) [2] | Moderate (better than EEG) [40] |
| Portability | High (wearable systems available) [40] | Low (requires scanner environment) [2] | High (mobile/wearable formats) [3] [40] |
| Primary Strengths | Timing of neural events, cost-effectiveness [15] | Anatomical localization, whole-brain imaging [2] | Naturalistic settings, motion tolerance [3] |
Event-Related Potentials (ERPs)
Event-Related Potentials represent averaged EEG responses time-locked to sensory, cognitive, or motor events, providing a window into covert brain information processing stages that may not manifest in overt behavior [41]. The exceptional temporal resolution of EEG makes it the only non-invasive method capable of resolving the dynamic pattern of events in the human brain down to the millisecond range [41].
Core ERP Components and Experimental Paradigms
ERP components are characterized by their polarity (positive or negative), latency, and functional correlates. The following table summarizes key components and their associated experimental paradigms.
Table 2: Key ERP Components and Their Characteristics
| ERP Component | Typical Latency (ms) | Paradigm | Functional Correlation |
|---|---|---|---|
| P300 | 300-700 [42] | Oddball | Attention, context updating, decision-making [42] |
| Mismatch Negativity (MMN) | 150-250 | Oddball (passive) | Preattentive sensory memory, change detection [42] |
| N170 | 130-200 [42] | Face/object viewing | Face-specific processing [42] |
| Error-Related Negativity (ERN) | 80-150 [42] | Go/No-Go, choice reaction time | Error detection, performance monitoring [42] |
| N400 | ~400 | Semantic processing | Semantic incongruity, language processing |
| P600 | ~600 [42] | Sentence reading | Syntactic processing, reanalysis [42] |
| Readiness Potential (BP) | -1200 to 0 [42] | Self-paced movement | Motor preparation, planning [42] |
Detailed Experimental Protocol for ERP Recording
Equipment and Setup:
- EEG System: High-impedance amplifier (≥100 MΩ) capable of recording signals in the microvolt range (typically ±200 µV) [43].
- Electrodes: Ag/AgCl or gold cup electrodes (10 mm diameter) placed according to the international 10-20 system [43]. For ERP studies, 32-128 channels are common to facilitate spatial analysis.
- Application: Skin preparation with abrading cream and use of electrolyte gel or paste to achieve impedance below 5 kΩ [43].
- Recording Parameters: Sampling rate ≥500 Hz, analog filters 0.1-100 Hz, digital notch filter at 50/60 Hz for line noise.
Stimulus Presentation:
- Software: Precisely timed stimulus delivery systems (e.g., E-Prime, Presentation) synchronized with EEG acquisition.
- Timing: Critical for valid ERP measurement. Use photodiodes to verify and correct for any display lag.
- Trial Structure: Inter-trial intervals varied randomly to prevent habituation and anticipatory potentials.
Data Acquisition Steps:
- Calibration: Record a known signal (e.g., 200 µV, 3.5 Hz sine wave) to verify system gain and filter settings [43].
- Participant Preparation: Apply electrodes at key sites (Fz, Cz, Pz, Oz, etc.) with reference to linked mastoids.
- Task Instruction: Explain the paradigm (e.g., "Press the button for rare tones") and practice trials.
- Recording: Acquire continuous EEG with event markers for each stimulus type and response.
Data Analysis Workflow:
- Preprocessing: Filtering (0.1-30 Hz bandpass), artifact rejection (ocular, muscle, movement), and bad channel interpolation.
- Epoching: Extract segments around stimulus onset (e.g., -200 to 800 ms).
- Baseline Correction: Remove mean voltage of pre-stimulus period.
- Averaging: Separate averages for each condition and electrode.
- Component Measurement: Identify peaks based on latency and topography; measure amplitude and latency.
ERP Analysis Workflow
Research Reagent Solutions for ERP Studies
Table 3: Essential Materials for ERP Research
| Item | Specification | Function |
|---|---|---|
| EEG Electrodes | Ag/AgCl, 10mm diameter cup [43] | Signal transduction from scalp to amplifier |
| Electrolyte Gel | Signa Gel, Ten20 Conductive Paste [43] | Maintains stable electrical connection, reduces impedance |
| Abrasing Cream | NuPrep, SkinPure [43] | Mild skin exfoliation to reduce electrode impedance |
| Electrode Caps | Elasticated fabric with embedded electrodes | Standardized placement according to 10-20 system |
| Collodion Adhesive | Mavidon Medical [43] | Secures electrodes for long-duration studies |
| Impedance Checker | Grass EZM [43] | Verifies electrode-skin contact quality (<5 kΩ recommended) |
Sleep Studies
Polysomnography (PSG), the comprehensive sleep study, employs EEG as its cornerstone for staging sleep architecture and diagnosing disorders [44]. EEG captures the characteristic brain wave patterns that differentiate non-rapid eye movement (NREM) and rapid eye movement (REM) sleep, cycling through 90-minute intervals throughout the night [44].
EEG Signatures of Sleep Stages
Sleep staging relies on distinct EEG patterns observed in specific derivations (typically F4-M1, C4-M1, O2-M1). The following table details the characteristic EEG hallmarks of each sleep stage.
Table 4: EEG Characteristics of Sleep Stages
| Sleep Stage | EEG Patterns | Frequency Bands | Physiological Context |
|---|---|---|---|
| Wakefulness | Alpha rhythm (8-13 Hz) with eye blinks | Alpha, Beta | Eyes closed: prominent alpha; Eyes open: low-voltage mixed-frequency [44] |
| N1 (NREM) | Vertex sharp waves, slowing of background | Theta (4-7 Hz) | Transition from wake, 2-5% of total sleep time |
| N2 (NREM) | Sleep spindles (11-16 Hz), K-complexes | Theta, Sigma | Light sleep, 45-55% of total sleep time |
| N3 (NREM) | High-amplitude slow waves | Delta (0.5-4 Hz) | Deep sleep, "slow-wave sleep", 15-25% of total sleep time |
| REM Sleep | Low-voltage mixed-frequency, "sawtooth" waves | Theta, Alpha | Dreaming, muscle atonia, rapid eye movements [44] |
Detailed Protocol for Sleep EEG Recording
Materials and Setup (Expanding on Basic Protocol):
- Electrode Application: Prefer collodion for secure overnight attachment [43].
- Key Sites: F3, F4, C3, C4, O1, O2 (per 10-20 system) with mastoid references (A1, A2) [43].
- Supplementary Sensors: EOG (electro-oculogram) for eye movements, chin EMG (electromyogram) for muscle tone, EKG for heart rate, respiratory effort sensors, pulse oximetry, leg movement sensors [44].
Pre-Recording Procedures:
- Calibration: As detailed in section 2.2, using 200-µV, 3.5-Hz sine wave [43].
- Participant Preparation: Avoid caffeine/alcohol afternoon prior, no naps [44].
- Impedance Check: Ensure all electrodes <5 kΩ before recording.
Recording Parameters:
- Sampling Rate: ≥200 Hz for sleep EEG.
- Filters: High-pass 0.3 Hz, low-pass 70 Hz.
- Lights Out: Time standardized to individual's habitual bedtime.
Data Analysis Protocol:
- Sleep Staging: 30-second epochs scored according to AASM criteria [43].
- Power Spectral Analysis: Fast Fourier Transform (FFT) applied to NREM epochs to quantify delta power.
- Hypnogram Construction: Graphical representation of sleep stage progression.
- Event Detection: Automated or manual identification of apneas, limb movements, arousals.
Sleep Study Analysis Pipeline
Seizure Detection
EEG is the primary diagnostic tool for epilepsy, capturing the abnormal electrical discharges that characterize seizures [45] [46]. Traditional visual analysis of prolonged EEG recordings is time-consuming and subject to inter-rater variability, driving the development of automated seizure detection systems [46].
EEG Profiles in Epilepsy
Epileptic activity manifests on EEG in distinct patterns across different states.
Table 5: EEG Signatures in Epilepsy
| State | EEG Characteristics | Clinical Significance |
|---|---|---|
| Normal Background | Symmetrical, posterior-dominant alpha rhythm | Baseline activity, absence suggests diffuse dysfunction |
| Interictal | Spikes, sharp waves, spike-wave complexes [45] | Between seizures, indicates epileptogenic focus |
| Ictal | Rhythmic, evolving discharge; may start focally or generally [46] | Actual seizure event, patterns vary by seizure type |
| Postictal | Suppression, slowing, or attenuation | Period following seizure, indicates cerebral exhaustion |
Advanced Seizure Detection Protocol
Feature Extraction Using Stationary Wavelet Transform (SWT):
- Decomposition: Use SWT to decompose EEG signals into frequency subbands, effectively capturing transient features like spikes [45].
- Feature Calculation: From each subband, extract statistical features (mean, variance, skewness, kurtosis) and Hjorth parameters (activity, mobility, complexity) [45].
- Feature Vector Creation: Compile features into a comprehensive representation of the EEG epoch.
Dimensionality Reduction:
- Principal Component Analysis (PCA): Linear transformation to reduce feature space while preserving variance [46].
- t-SNE: Non-linear technique for visualization of high-dimensional data [46].
- Binary Dragonfly Algorithm (BDFA): Nature-inspired optimization to select most discriminative feature subset [45].
Classification Algorithms:
- Random Forest (RF): Ensemble method achieving up to 98% accuracy in seizure detection [46].
- Deep Neural Networks (DNN): Multi-layer architectures that learn hierarchical feature representations [45].
- Support Vector Machines (SVM): Effective for binary classification of seizure vs. non-seizure epochs.
Performance Metrics: Report accuracy, sensitivity, specificity, precision, and F1-score using 10-fold cross-validation in a patient-independent paradigm [46].
Research Reagent Solutions for Epilepsy Research
Table 6: Essential Materials for Seizure Detection Research
| Item | Specification | Function |
|---|---|---|
| Long-Term Monitoring EEG Systems | Ambulatory EEG recorder (e.g., Grass Aura) [43] | Extended recording in hospital or home settings |
| High-Density Electrode Arrays | 64-256 channel geodesic nets | Improved spatial sampling for source localization |
| Electrode Application Kits | Collodion, gauze squares, acetone remover [43] | Secure long-term electrode attachment |
| EEG Analysis Software | PASS Plus, EEGLAB, custom Python/MATLAB tools | Signal processing, feature extraction, classification |
| Benchmark Datasets | UCI Epileptic Seizure Recognition Dataset [46] | Standardized data for algorithm development and validation |
Automated Seizure Detection System
EEG establishes its indispensable role in neuroimaging through these three distinct yet complementary applications. In ERPs, it provides millisecond-temporal resolution to dissect cognitive processes; in sleep medicine, it offers the definitive biomarkers for staging architecture and diagnosing disorders; in epilepsy, it serves as both the primary diagnostic tool and the foundation for automated detection systems. While fMRI and fNIRS provide superior spatial localization and greater tolerance for movement, neither can match EEG's ability to directly capture the brain's electrical dynamics in real time [2] [40]. This unique capability ensures EEG's continued relevance in both clinical practice and neuroscience research, particularly as technological advances improve its spatial resolution through high-density arrays and sophisticated source localization algorithms. For researchers and clinicians focusing on temporal dynamics of brain function, EEG remains the modality of choice, complementing rather than competing with hemodynamic-based imaging techniques.
Functional Near-Infrared Spectroscopy (fNIRS) has emerged as a powerful neuroimaging technology that occupies a unique niche in brain research, particularly where traditional modalities like functional Magnetic Resonance Imaging (fMRI) and Electroencephalography (EEG) face limitations. fNIRS measures cortical brain activity by detecting changes in oxygenated hemoglobin (HbO) and deoxygenated hemoglobin (HbR) concentrations, providing an indirect measure of neural activity through neurovascular coupling [47]. This technical guide explores the ideal applications of fNIRS within neuroscience research, focusing on its distinct advantages in naturalistic settings, pediatric populations, and rehabilitation contexts. Framed within a broader thesis comparing neuroimaging methods, this review establishes fNIRS not as a replacement for fMRI or EEG, but as a complementary technology that addresses specific methodological gaps, thereby expanding the scope of possible brain research paradigms and clinical applications.
Comparative Analysis of fNIRS, fMRI, and EEG
Technical Principles and Measurement Targets
Each major neuroimaging modality captures distinct physiological correlates of brain activity, leading to fundamental differences in their applications and limitations.
fNIRS utilizes near-infrared light (650-950 nm) to measure hemodynamic changes associated with neural activity. It relies on the differential absorption characteristics of HbO and HbR to calculate relative concentration changes in cortical blood flow [47] [17]. The signal is based on neurovascular coupling, similar to fMRI, but obtained via optical methods.
fMRI detects brain activity by measuring the Blood Oxygen Level Dependent (BOLD) signal, which reflects magnetic properties changes induced by variations in hemoglobin oxygenation levels. It provides an indirect measure of neural activity through the hemodynamic response [17] [3].
EEG records electrical potentials generated by the synchronous activity of neuronal populations from the scalp surface. It directly measures the brain's electrical activity with millisecond temporal resolution but limited spatial precision [48].
Comparative Technical Specifications
The table below summarizes the key technical characteristics of fNIRS in direct comparison with fMRI and EEG, highlighting its unique positioning in the neuroimaging toolkit.
Table 1: Comparative Analysis of Neuroimaging Modalities: fNIRS, fMRI, and EEG
| Feature | fNIRS | fMRI | EEG |
|---|---|---|---|
| Spatial Resolution | 1-3 cm [17] | 1-3 mm (high) [17] | 1-2 cm (low) [48] |
| Temporal Resolution | ~0.1-1 Hz (good) [3] | 0.3-2 Hz (slow) [17] | <1 ms (excellent) [48] |
| Penetration Depth | Superficial cortex (2-3 cm) [17] | Whole brain (high) [17] | Superficial cortex (good) |
| Measurement Target | Hemodynamic (HbO/HbR) [47] | Hemodynamic (BOLD) [3] | Electrical activity [48] |
| Portability | High (wearable systems) [47] [3] | None (stationary) [17] | High (wearable systems) [48] |
| Tolerance to Motion | High [47] [49] | Very low [17] | Medium (sensitive to artifacts) |
| Population Suitability | Ideal for pediatrics, implants [47] [3] | Limited for pediatrics, claustrophobia, implants [17] | Broad, but sensitive in pediatrics |
| Operational Cost | Relatively low [3] | Very high [3] | Low |
| Acoustic Noise | Silent [3] | Loud (requiring protection) [3] | Silent |
Synergistic Potential: The Case for Multimodal Integration
No single neuroimaging modality comprehensively captures the brain's complex spatiotemporal dynamics. The integration of fNIRS with fMRI and EEG creates synergistic systems that leverage their complementary strengths [17] [48].
fNIRS-fMRI Integration: Combining fMRI's high spatial resolution and whole-brain coverage with fNIRS's superior temporal resolution, portability, and motion tolerance enables robust spatiotemporal mapping of neural activity. This integration is particularly valuable for validating fNIRS signals and investigating cortical-subcortical interactions [17] [50].
fNIRS-EEG Integration: This multimodal approach combines EEG's excellent temporal resolution with fNIRS's better spatial resolution and physiological specificity. The system captures both rapid electrical neural events and their slower hemodynamic consequences, providing a more complete picture of brain function [48]. This portable combination is ideal for naturalistic settings and clinical applications like brain-computer interfaces and neurofeedback [34] [51].
Figure 1: Multimodal Integration Synergies. This diagram illustrates how combining fNIRS with fMRI or EEG leverages their complementary strengths to create more powerful neuroimaging tools.
Ideal Application 1: Naturalistic Paradigms and Ecological Validity
fNIRS's portability, minimal movement restrictions, and silent operation make it uniquely suitable for studying brain function in real-world contexts, addressing a significant limitation of traditional neuroimaging methods.
Experimental Protocols for Naturalistic Settings
Naturalistic fNIRS paradigms diverge from traditional controlled laboratory settings, embracing more ecologically valid approaches:
Protocol Design: Studies utilize tasks such as simulated driving, walking protocols, interactive social tasks, and real-world problem-solving activities. The key differentiator is that participants can move relatively freely and engage with their environment naturally [17].
Setup Considerations: Researchers use portable, wireless fNIRS systems that allow full body movement. The equipment weight and size are minimized to reduce interference with natural behavior. Setup typically includes a head-mounted fNIRS unit with battery pack and data storage, often synchronized with auxiliary measures like motion capture or eye tracking [3].
Data Analysis Challenges: Motion artifacts, though better tolerated than fMRI, require specialized processing. Algorithms such as movement artifact removal algorithms (e.g., spline interpolation, wavelet-based methods) are routinely applied. Signal quality is monitored in real-time when possible to identify compromised channels [47].
Representative Study: Motor Imagery with EEG-fNIRS Integration
A cutting-edge application in naturalistic research combines fNIRS with EEG for motor imagery tasks relevant to brain-computer interfaces and rehabilitation:
Objective: To improve the classification accuracy of motor imagery (MI) tasks for brain-computer interface (BCI) applications using integrated EEG-fNIRS signals [34].
Methodology: Participants performed imagined hand movements while wearing a custom EEG-fNIRS cap. EEG signals were processed to extract spatiotemporal features using dual-scale temporal convolution and attention mechanisms. fNIRS signals were analyzed to capture hemodynamic activation patterns in motor regions using spatial convolution and gated recurrent units [34].
Fusion Approach: At the decision stage, outputs from both modalities were combined using Dempster-Shafer theory to model uncertainty and fuse evidence from both electrical and hemodynamic responses [34].
Key Finding: The multimodal approach achieved an average classification accuracy of 83.26%, representing a 3.78% improvement over state-of-the-art unimodal methods, demonstrating the synergistic value of combining modalities for complex cognitive tasks [34].
Ideal Application 2: Pediatric and Developmental Populations
The pediatric population presents unique challenges for neuroimaging, including limited ability to remain still, anxiety in confined spaces, and difficulty performing abstract tasks. fNIRS addresses these challenges through its specific technical attributes [47] [49].
Technical Advantages for Pediatric Research
Motion Tolerance: fNIRS demonstrates relatively good tolerance to movement artifacts compared to fMRI, accommodating natural small movements in children without complete data loss [47] [49].
Child-Friendly Setup: The non-invasive, silent, and non-confining nature of fNIRS reduces anxiety in children. Critically, it allows for testing while children sit on a parent's lap or in natural positions, facilitating data collection from even very young participants [47].
Safety and Accessibility: fNIRS poses no radiation risk and has no known contraindications, supporting longitudinal studies of development. It is also suitable for children with metal implants (e.g., cochlear implants), who would be excluded from fMRI studies [3].
Representative fNIRS Findings in Developmental Disorders
Table 2: fNIRS Biomarkers in Pediatric Developmental Disorders
| Disorder | Key fNIRS Findings | Brain Regions Involved | Clinical Implications |
|---|---|---|---|
| Autism Spectrum Disorder (ASD) | Atypical activation patterns during social tasks [47] | Social brain networks (e.g., prefrontal, temporoparietal) [47] | Potential diagnostic biomarker; tool for treatment monitoring |
| Attention Deficit Hyperactivity Disorder (ADHD) | Reduced prefrontal cortex activation during executive function tasks [47] [49] | Prefrontal cortex [47] | Objective measure for diagnosis and treatment evaluation |
| Cerebral Palsy (CP) | Altered motor cortex hemodynamics during movement attempts [47] | Sensorimotor cortices [47] | Assessment of motor pathway integrity; rehabilitation planning |
| Language Impairment | Differences in temporal and frontal activation during auditory processing [49] | Temporal and frontal language areas [49] | Understanding neural basis of language deficits |
Experimental Protocol: Infant Sleep Studies
Infant neuroimaging presents particular challenges as maintaining an absolute resting state during wakefulness is nearly impossible. fNIRS studies during natural sleep provide a solution:
Objective: To investigate task-based functional connectivity in sleeping infants exposed to auditory stimulation, comparing resting-state and task-state brain networks [52].
Participant Preparation: Infants are measured while naturally asleep. fNIRS optodes are positioned according to head landmarks while the infant sleeps, typically using a soft, elastic cap designed for infant heads [52].
Paradigm Structure: After natural sleep onset, 5 minutes of resting-state data is collected. This is followed by auditory stimulation (e.g., 15s of white noise) interspersed with 20s rest periods, repeated for 5 cycles. The task frequency is kept constant at 0.0286 Hz [52].
Data Analysis: Functional connectivity is analyzed using Pearson correlation coefficients between channels across different frequency bands. Graph-theoretical analysis examines network properties like small-worldness. Individual response patterns are categorized as Sensitive-Positive, Sensitive-Negative, or Insensitive based on correlation sparsity [52].
Key Finding: The study revealed three distinct response patterns to the same stimulus among infants, demonstrating individual variability in brain network responses during sleep. Individuals showing stronger small-worldness in resting-state tended to be more sensitive to stimuli [52].
Ideal Application 3: Rehabilitation and Clinical Monitoring
fNIRS shows significant promise in rehabilitation medicine, where its portability, tolerance to movement, and ability to monitor brain activity during actual therapeutic activities offer distinct advantages over other neuroimaging methods.
Neurofeedback and Brain-Computer Interfaces
Motor imagery-based neurofeedback using fNIRS and EEG has emerged as a promising approach in motor rehabilitation, particularly for stroke recovery:
Protocol Objective: To enable self-regulation of brain activity through real-time feedback for enhancing neuroplasticity in damaged motor pathways [51].
System Setup: A custom cap integrates EEG electrodes and fNIRS optodes over sensorimotor cortices. The platform includes real-time signal processing software for calculating a neurofeedback score and presenting visual feedback [51].
Experimental Design: Participants perform left-hand motor imagery tasks while receiving visual feedback (e.g., a ball moving along a gauge) representing their brain activity level. The study compares three conditions: EEG-only, fNIRS-only, and combined EEG-fNIRS neurofeedback in a randomized design [51].
Clinical Rationale: Combining the excellent temporal resolution of EEG with the physiological specificity of fNIRS may produce more specific task-related brain activity, potentially enhancing neuroplasticity in clinical populations like stroke survivors [51].
The Scientist's Toolkit: Essential Research Reagents and Equipment
Table 3: Essential Components for fNIRS Research Setups
| Component | Function | Technical Considerations |
|---|---|---|
| fNIRS Main Unit | Generates light signals and detects returning light | Choose between continuous-wave, frequency-domain, or time-domain systems based on research needs |
| Optodes (Sources/Detectors) | Place on scalp to transmit and receive NIR light | Flexible positioning caps vs. rigid arrays; consider number of channels and coverage area |
| Coupling Medium | Ensures optimal light transmission between optodes and scalp | Use liquid gels or solid polymers; critical for signal quality |
| Headgear System | Holds optodes in stable position on head | Elastic caps, custom 3D-printed helmets, or thermoplastic molds; stability affects data quality |
| Co-registration System | Maps optode positions to brain anatomy | 3D digitizers (e.g., Polhemus), photogrammetry, or MRI-based mapping |
| Auxiliary Synchronization | Integrates fNIRS with other data streams | Synchronization with EEG, motion capture, eye tracking, or stimulus presentation systems |
| Processing Software | Analyzes raw light intensity to HbO/HbR concentrations | Apply motion correction, physiological noise filtering, and statistical analysis |
Methodological Considerations and Limitations
While fNIRS offers distinct advantages in the applications discussed, researchers must acknowledge and address its methodological limitations through careful study design and analytical approaches.
Key Methodological Challenges
Spatial Resolution and Depth Sensitivity: fNIRS is limited to measuring cortical activity, with limited penetration depth (2-3 cm) and spatial resolution (1-3 cm) inferior to fMRI. This restricts investigation to superficial cortical regions [17] [3].
Physiological Confounds: fNIRS signals contain contributions from systemic physiological noise (heart rate, blood pressure, respiration) and extracerebral tissues (scalp, skull). Advanced signal processing techniques (e.g., principal component analysis, independent component analysis) are required to separate cerebral signals from confounds [47].
Standardization Needs: Unlike the more established fMRI, fNIRS lacks standardized protocols for experimental design, data processing, and reporting. This complicates cross-study comparisons and clinical translation [49].
Future Directions and Innovations
The field of fNIRS research continues to evolve with several promising developments:
Hardware Innovations: MRI-compatible fNIRS probes enable true simultaneous acquisition with fMRI for validation studies. Miniaturized, wireless systems with higher channel counts expand applications in naturalistic settings [17].
Analytical Advances: Machine learning approaches for improved artifact removal and signal extraction. Development of standardized preprocessing pipelines and analytical frameworks to enhance reproducibility [17] [34].
Clinical Translation: Growing focus on developing clinically viable biomarkers for developmental disorders, monitoring treatment response in rehabilitation, and bedside monitoring in neurological intensive care [47] [49].
Figure 2: fNIRS Experimental Workflow Decision Tree. This diagram outlines key methodological decisions in fNIRS study design, highlighting how application-specific considerations influence protocol development across naturalistic, pediatric, and clinical contexts.
fNIRS has established itself as an indispensable neuroimaging tool that effectively bridges critical methodological gaps between the high spatial resolution of fMRI and the excellent temporal resolution of EEG. Its unique advantages—portability, motion tolerance, silent operation, and pediatric suitability—make it ideally suited for studying brain function in naturalistic contexts, developmental populations, and clinical rehabilitation settings. As technological innovations continue to enhance its capabilities and analytical approaches become more standardized, fNIRS is poised to expand our understanding of brain function in real-world environments and across diverse populations, ultimately accelerating the translation of neuroscience discoveries into clinical practice.
The pursuit of understanding human brain function has driven the development of diverse neuroimaging technologies, each with distinct strengths and limitations. Functional magnetic resonance imaging (fMRI), electroencephalography (EEG), and functional near-infrared spectroscopy (fNIRS) represent three pillars of non-invasive brain imaging research [17] [2]. fMRI provides high spatial resolution for localizing neural activity across the entire brain, including deep structures, but requires immobile participants in expensive, confined scanners, offering relatively slow temporal resolution limited by the hemodynamic response [17] [2]. EEG captures electrical brain activity with millisecond temporal precision, making it ideal for studying rapid neural dynamics, but suffers from limited spatial resolution and susceptibility to motion artifacts [2] [53]. fNIRS occupies a middle ground, measuring hemodynamic responses similar to fMRI but with greater portability, higher motion tolerance, and better temporal characteristics, though it remains limited to superficial cortical regions [17] [2].
Within this context, multimodal integration—specifically combining EEG and fNIRS—has emerged as a powerful strategy for brain-computer interface (BCI) and neurofeedback applications. This approach leverages their complementary characteristics: EEG's direct measurement of neural electrical activity with high temporal resolution, and fNIRS's hemodynamic monitoring with improved spatial localization and resistance to motion artifacts [54] [53]. The synergy of these modalities enables more robust decoding of brain states and intentions, potentially overcoming the "30% of users" problem in BCI where individuals cannot effectively control single-modality systems [54]. This technical guide examines the principles, methodologies, and applications of EEG-fNIRS integration, providing researchers with a comprehensive framework for implementing these advanced multimodal systems.
Technical Foundations: Core Principles of EEG and fNIRS
Biophysical Basis and Measurement Principles
EEG and fNIRS capture fundamentally different aspects of brain activity through distinct biophysical mechanisms. Understanding these underlying principles is essential for effective multimodal integration.
Electroencephalography (EEG) measures electrical potentials generated by the synchronized firing of cortical neurons, primarily pyramidal cells aligned perpendicular to the scalp surface [53]. These voltage fluctuations are detected by electrodes placed on the scalp, providing a direct measure of neural electrical activity with exceptional temporal resolution in the millisecond range [2] [53]. However, as electrical signals pass through the skull and scalp, they undergo dispersion and smearing, resulting in limited spatial resolution typically at the centimeter level [2]. EEG is particularly sensitive to artifacts from muscle activity, eye movements, and environmental electrical noise, which can be orders of magnitude larger than the neural signals of interest [2].
Functional Near-Infrared Spectroscopy (fNIRS) utilizes near-infrared light (650-1000 nm wavelength) to measure hemodynamic changes associated with neural activity through neurovascular coupling [17] [55]. Light emitted into the scalp penetrates brain tissue and is absorbed or scattered, with detected intensity changes reflecting concentration variations in oxygenated hemoglobin (HbO) and deoxygenated hemoglobin (HbR) [17] [55]. This provides an indirect measure of neural activity based on metabolic demand, similar to fMRI but with key practical differences. fNIRS offers superior spatial resolution to EEG (typically 1-3 cm) but is constrained by the hemodynamic response delay, resulting in temporal resolution on the scale of seconds [17]. Its primary limitation is shallow penetration depth (∼1.5-2 cm), restricting measurement to the outer cortical layers [2].
Table 1: Fundamental Characteristics of EEG and fNIRS
| Feature | EEG | fNIRS |
|---|---|---|
| Signal Origin | Electrical potentials from neuronal firing | Hemodynamic changes (HbO/HbR concentrations) |
| Temporal Resolution | Milliseconds [53] | Seconds [17] |
| Spatial Resolution | Centimeters (limited) [2] | 1-3 centimeters [17] |
| Depth Sensitivity | Cortical surface [53] | Outer cortex (∼1-2.5 cm) [2] |
| Primary Artifacts | Muscle activity, eye blinks, environmental noise [2] | Scalp blood flow, hair color, movement [17] |
| Portability | High (wireless systems available) [53] | High (wearable formats) [53] |
| Setup Complexity | Moderate (often requires electrode gel) [53] | Moderate (minimal skin preparation) [53] |
Complementary Nature for BCI and Neurofeedback
The combination of EEG and fNIRS creates a synergistic relationship that addresses fundamental limitations of either modality used independently. EEG provides the necessary temporal precision to capture rapid neural dynamics essential for responsive BCI control and neurofeedback, while fNIRS offers improved spatial specificity to localize the origin of these signals [54] [53]. This temporal-spatial complementarity is particularly valuable for decoding complex cognitive states and motor intentions.
From a practical perspective, fNIRS's tolerance to movement artifacts balances EEG's sensitivity, enabling more ecologically valid studies in naturalistic settings [53]. Furthermore, since both modalities can be implemented in portable, wearable configurations, their combination facilitates brain monitoring in real-world environments beyond the traditional laboratory—from clinical bedside applications to rehabilitation settings [54] [56]. The hemodynamic (fNIRS) and electrical (EEG) measures also provide mutually validating information, as they reflect different aspects of the same underlying neural processes through neurovascular coupling [54].
Methodological Implementation: Experimental Protocols and Integration Frameworks
Hardware Integration and Sensor Placement
Successful multimodal integration begins with compatible hardware configurations that minimize interference while maximizing signal quality. Integrated caps combining EEG electrodes and fNIRS optodes have been developed specifically for this purpose, typically following the international 10-20 system for standardized placement [54] [53]. These specialized caps feature pre-defined fNIRS-compatible openings that avoid electrode contact points, preventing physical interference while ensuring co-localized measurement regions.
Several integration approaches have emerged:
- Dedicated integrated systems where manufacturers provide complete EEG-fNIRS solutions with built-in synchronization [53].
- Custom configurations combining separate EEG and fNIRS systems synchronized via external hardware triggers (e.g., TTL pulses) or software platforms like Lab Streaming Layer (LSL) [56].
- High-density arrangements with overlapping measurement fields to maximize spatial sampling, though these require careful design to avoid hardware conflicts [57].
A representative implementation is described by Muller et al., where researchers developed a custom cap-layout using a 32-channel EEG system (ActiCHamp, Brain Products GmbH) combined with a continuous-wave NIRS system featuring 16 detectors, 16 LED sources, and 8 short channels (NIRScout XP, NIRx) [54]. This configuration positioned 19 EEG channels above sensorimotor cortices (FC5, FC3, FC1, FC2, FC4, FC6, C5, etc.) alongside fNIRS optodes covering the same regions, enabling comprehensive monitoring of motor imagery tasks [54].
Diagram 1: Hardware integration and sensor placement workflow for combined EEG-fNIRS setups
Signal Acquisition and Preprocessing Pipelines
Multimodal data processing requires separate yet parallel preprocessing pipelines that account for the distinct characteristics of EEG and fNIRS signals before integration can occur. The fundamental challenge lies in reconciling the millisecond-scale electrical measurements of EEG with the second-scale hemodynamic responses of fNIRS.
EEG Preprocessing Pipeline:
- Downsampling: Reducing sampling rates to manageable levels while preserving neural information [58].
- Filtering: Applying bandpass filters (typically 0.5-40 Hz) to remove drift and high-frequency noise [58].
- Artifact Removal: Eliminating contamination from eye blinks, muscle activity, and cardiac signals using techniques like Independent Component Analysis (ICA), Canonical Correlation Analysis (CCA), or Wavelet Transform (WT) [58].
- Re-referencing: Adjusting to common average or specific reference electrodes.
fNIRS Preprocessing Pipeline:
- Optical Density Conversion: Transforming raw intensity measurements to optical density [59].
- Quality Checking: Identifying and excluding channels with poor signal quality [59].
- Hemodynamic Conversion: Applying modified Beer-Lambert law to calculate HbO and HbR concentration changes [55].
- Physiological Noise Removal: Using bandpass filtering (typically 0.01-0.5 Hz) and short-separation regression to eliminate cardiac, respiratory, and blood pressure oscillations [55] [57].
The reproducibility of fNIRS processing has been systematically examined through the fNIRS Reproducibility Study Hub (FRESH), which found that nearly 80% of research teams agreed on group-level results when hypotheses were strongly supported by literature, though individual-level agreement was lower and highly dependent on data quality [59]. This underscores the importance of standardized preprocessing approaches.
Table 2: Representative Experimental Protocol for Motor Imagery-Based Neurofeedback
| Protocol Phase | Duration | Parameters | Modality Specific Considerations |
|---|---|---|---|
| Baseline Recording | 5 minutes | Resting state, eyes open | EEG: Impedance checkingfNIRS: Signal quality optimization |
| System Calibration | 10-15 minutes | Task-specific performance | Individual parameter tuning for NF score calculation |
| Experimental Blocks | 5-8 blocks of 4-6 trials each | 20s trial: 5s cue, 10s task, 5s rest | Synchronized trigger sending to both systems |
| Neurofeedback Presentation | Real-time | Visual metaphor (e.g., moving ball) | Combined score calculation from both modalities |
| Rest Periods | 1-2 minutes between blocks | Prevent mental fatigue | Continuous recording maintained |
Data Fusion and Real-Time Processing Architectures
Data fusion represents the core computational challenge in EEG-fNIRS integration, with multiple architectural approaches enabling different levels of modality combination:
Model-Level Fusion maintains separate processing pipelines until the final decision stage, where outputs are combined through methods like weighted voting or meta-classification. This approach preserves modality-specific processing optimizations while leveraging complementary information for improved classification accuracy [54] [55].
Feature-Level Fusion combines extracted features from both modalities into a unified feature vector before classification. Common EEG features include band power (μ-rhythm: 8-12 Hz, β-rhythm: 13-30 Hz) for motor imagery applications, while fNIRS features typically encompass mean, peak, slope, and variance of HbO/HbR responses [55]. This approach requires temporal alignment strategies to reconcile the different response latencies between modalities.
Joint Processing Approaches include techniques like joint Independent Component Analysis (jICA) that simultaneously decompose both datasets to identify coupled components, or canonical correlation analysis (CCA) that identifies relationships between multimodal feature sets [53]. These methods can reveal underlying neural processes that manifest in both electrical and hemodynamic domains.
For real-time neurofeedback applications, architectures like the experimental platform described by Muller et al. incorporate custom software for simultaneous signal processing, NF score calculation, and visual feedback presentation [54]. Their implementation calculates a combined NF score from right primary motor cortex activity during left-hand motor imagery, with participants receiving visual feedback via a ball moving along a one-dimensional gauge corresponding to their brain activity level [54].
Diagram 2: Parallel processing architecture for EEG-fNIRS data fusion in BCI and neurofeedback applications
Experimental Protocols: Methodologies for Specific Applications
Motor Imagery for Rehabilitation BCIs
Motor imagery (MI)—the mental rehearsal of physical movements without actual execution—represents a primary paradigm for both BCI control and neurorehabilitation applications. The protocol described by Muller et al. exemplifies a rigorous approach to evaluating multimodal EEG-fNIRS neurofeedback for upper-limb motor imagery [54] [51].
Participant Preparation: Thirty right-handed participants undergo cap placement with EEG electrodes and fNIRS optodes positioned over sensorimotor cortices according to the 10-20 system. EEG impedance and fNIRS signal quality are optimized before beginning recordings [54].
Experimental Design: Participants experience three randomized neurofeedback conditions:
- EEG-only NF: Feedback based solely on EEG sensorimotor rhythm modulation
- fNIRS-only NF: Feedback derived only from hemodynamic responses in motor areas
- EEG-fNIRS NF: Combined feedback incorporating both modalities
Task Structure: Each trial consists of:
- Cue period (5s): Visual indication of upcoming task
- Motor imagery period (10s): Left-hand motor imagery while receiving continuous visual feedback
- Rest period (5s): Return to baseline
Feedback Implementation: Participants observe a visual representation of a ball moving along a one-dimensional gauge, with upward movement corresponding to increased activation in target motor regions. The NF score is computed from right primary motor cortex activity, leveraging the contralateral organization of motor control [54].
This protocol aims to determine whether combined modality feedback produces more specific task-related brain activity compared to unimodal approaches, with potential implications for post-stroke motor rehabilitation where promoting neuroplasticity is critical [54].
Prefrontal Cortex Applications for Cognitive Monitoring
The prefrontal cortex (PFC) represents another major application area, particularly suited to fNIRS monitoring due to its accessibility and lack of hair coverage. High-density fNIRS arrays have demonstrated superior performance in detecting and localizing PFC activity during cognitive tasks compared to traditional sparse arrays [57].
Word-Color Stroop Protocol:
- Task: Participants identify the color of displayed words while ignoring the semantic meaning, creating cognitive conflict during incongruent trials (e.g., "RED" displayed in blue ink) [57].
- Design: Blocked design with congruent and incongruent trials presented in alternating blocks, with fNIRS monitoring focused on dorsolateral PFC regions.
- Measurement: High-density (HD) fNIRS arrays with multiple source-detector distances (including short-separation channels) compared against traditional sparse arrays [57].
Findings: HD arrays demonstrated superior localization and sensitivity, particularly during lower cognitive load tasks (congruent trials), while sparse arrays could only reliably detect activity during high cognitive demand conditions (incongruent trials) [57]. This has important implications for BCI applications requiring sensitive detection of subtle cognitive state changes.
The Scientist's Toolkit: Essential Research Reagents and Materials
Table 3: Essential Equipment and Software for EEG-fNIRS Research
| Category | Specific Examples | Function/Purpose | Implementation Notes |
|---|---|---|---|
| Integrated Caps | EasyCap with EEG-fNIRS compatibility, custom-designed layouts [54] | Simultaneous sensor placement | Ensure compatibility with both systems; consider hair obstruction |
| EEG Systems | ActiCHamp (Brain Products), wireless EEG systems [54] | Electrical signal acquisition | 32+ channels recommended for adequate coverage |
| fNIRS Systems | NIRScout (NIRx), continuous-wave systems with short-separation channels [54] [57] | Hemodynamic response measurement | Multiple wavelengths (e.g., 760/850 nm) for HbO/HbR discrimination |
| Synchronization Hardware | TTL pulse generators, parallel port triggers [53] | Temporal alignment of multimodal data | Precise synchronization critical for data fusion |
| Real-Time Processing Software | Turbo-Satori, Lab Streaming Layer (LSL), custom MATLAB/Python scripts [56] | Online data processing and NF calculation | Open-source options available for flexibility |
| Stimulus Presentation | Presentation, Psychtoolbox, OpenSesame | Experimental paradigm delivery | Accurate timing verification essential |
| Data Analysis Platforms | Homer2, NIRS-KIT, EEGLAB, FieldTrip, custom pipelines [59] | Offline data processing and statistics | Pipeline choices significantly impact results [59] |
Applications and Clinical Translation
Brain-Computer Interfaces for Communication and Control
EEG-fNIRS BCIs have demonstrated particular promise for communication applications in severely disabled populations. For individuals with amyotrophic lateral sclerosis (ALS) or locked-in syndrome, these systems can provide a vital communication channel when traditional methods fail [55] [58]. Early studies with ALS patients achieved approximately 70% classification accuracy for binary communication using mental tasks like arithmetic or music imagery detectable via fNIRS [55].
Hybrid BCI approaches leverage the complementary strengths of each modality: EEG provides rapid response capabilities for discrete selections, while fNIRS offers more stable control signals for continuous applications or when EEG performance is compromised by artifacts or fatigue [55]. This redundancy is particularly valuable in clinical applications where reliability is paramount.
Neurofeedback for Rehabilitation and Cognitive Enhancement
Neurofeedback applications benefit from multimodal integration through improved training specificity and engagement. In motor rehabilitation after stroke, combined EEG-fNIRS neurofeedback can target both the electrical correlates of motor planning (via EEG) and the hemodynamic responses indicating successful engagement of compromised motor networks (via fNIRS) [54]. This dual approach may enhance neuroplasticity by providing more comprehensive feedback about target neural processes.
For cognitive enhancement, prefrontal EEG-fNIRS neurofeedback has been applied to attention regulation, emotion management, and executive function training. The spatial specificity of fNIRS helps isolate prefrontal subregions responsible for specific cognitive functions, while EEG provides moment-to-moment feedback about engagement states [53].
Current Challenges and Future Directions
Despite significant advances, EEG-fNIRS integration faces several persistent challenges. Hardware compatibility issues remain, particularly for high-density configurations where optodes and electrodes compete for limited scalp real estate [53]. Signal quality considerations include the potential for optical interference with EEG signals and motion artifact management strategies that work effectively for both modalities simultaneously.
Analytical challenges include the need for sophisticated data fusion techniques that effectively leverage complementary information while accounting for different temporal characteristics and noise profiles. The FRESH initiative highlighted significant variability in fNIRS analysis pipelines across research groups, underscoring the need for more standardized processing approaches to enhance reproducibility [59].
Future directions point toward increased miniaturization and wearability, enabling long-term monitoring in real-world environments. Advances in high-density diffuse optical tomography (HD-DOT) are improving fNIRS spatial resolution to approach fMRI-like quality while maintaining portability [57]. Machine learning approaches for adaptive classification and feature selection represent another promising frontier, potentially enabling systems that automatically optimize modality weighting based on individual user characteristics and current signal quality.
The integration of EEG-fNIRS with other modalities, such as functional magnetic resonance imaging (fMRI) for ground truth validation, creates powerful multimodal frameworks for comprehensive brain mapping [17]. As these technologies mature, standardized frameworks for hardware integration, data sharing, and analytical pipelines will be essential for advancing the field and translating laboratory demonstrations into practical clinical applications.
Understanding the intricate functions of the human brain requires multimodal approaches that integrate complementary neuroimaging techniques [17]. Functional magnetic resonance imaging (fMRI), electroencephalography (EEG), and functional near-infrared spectroscopy (fNIRS) represent three non-invasive methods for studying brain activity, each with distinct strengths and limitations that make them uniquely suited for specific clinical applications [2] [9]. These technologies have become indispensable tools in neuroscience research, particularly in studying complex neurological and psychiatric disorders that impose significant burdens on individuals and healthcare systems worldwide [17].
The selection of an appropriate neuroimaging modality depends critically on the research question, patient population, and experimental context. fMRI provides high spatial resolution but requires expensive, immobile equipment and restricts participant movement [2] [17]. EEG offers excellent temporal resolution for capturing rapid neural dynamics but provides limited spatial information [2] [60]. fNIRS represents a promising middle ground with superior portability and tolerance for movement, though with limitations in depth penetration and spatial resolution [3] [9]. This technical review examines applications of these modalities through case studies in substance use disorders, Alzheimer's disease, and motor rehabilitation, framing these applications within a broader thesis on their comparative strengths and limitations.
Table 1: Core Technical Specifications of Major Neuroimaging Modalities
| Parameter | fMRI | EEG | fNIRS |
|---|---|---|---|
| Spatial Resolution | Millimeters (high) [2] | Centimeters (low) [2] | 1-3 centimeters (moderate) [17] |
| Temporal Resolution | 0.33-2 Hz (low) [17] | Milliseconds (very high) [2] | Up to 10 Hz (moderate) [39] |
| Depth Penetration | Whole brain (including subcortical) [17] | Cortical surface [2] | Superficial cortex (~15mm) [2] |
| Portability | Low (requires scanner environment) [3] | High [60] | High (wearable systems) [3] |
| Tolerance to Motion | Low (highly sensitive) [17] | Moderate (susceptible to artifacts) [2] | High (relatively robust) [3] |
| Measurement Basis | Blood oxygenation level dependent (BOLD) [17] | Electrical activity from synchronized neuron firing [2] | Hemoglobin absorption of near-infrared light [2] |
| Key Artifact Sources | Magnetic susceptibility, motion [17] | Ocular/muscle movement, environmental noise [2] | Scalp blood flow, hair [17] |
Technical Foundations of fMRI, EEG, and fNIRS
Functional Magnetic Resonance Imaging (fMRI)
Since its inception in the early 1990s, fMRI has been a cornerstone of neuroimaging, providing high-resolution spatial maps of brain activity by detecting Blood Oxygen Level Dependent (BOLD) signals [17]. This technique enables researchers to localize brain regions involved in specific cognitive and sensory tasks with millimeter-level precision, covering both cortical and subcortical structures including the hippocampus, amygdala, and thalamus [17]. The ability of fMRI to visualize deep brain structures and its non-invasive nature have made it indispensable in cognitive neuroscience, facilitating studies on sensory processing, motor control, emotional regulation, and complex cognitive functions [17].
The temporal resolution of fMRI is constrained by the hemodynamic response, which typically lags behind neural activity by 4–6 seconds, with a BOLD signal sampling rate generally ranging from 0.33 to 2 Hz [17]. Additionally, fMRI requires participants to remain motionless within the scanner environment, posing challenges for studying naturalistic behaviors and limiting its applicability in populations prone to movement such as children or individuals with motor impairments [17]. The high cost and limited accessibility of fMRI facilities further restrict its widespread use [2].
Electroencephalography (EEG)
EEG measures the electrical activity of the cortex generated by the synchronized firing of neurons in real time with millisecond temporal resolution [2]. This excellent temporal resolution makes EEG particularly valuable for capturing rapid neural dynamics associated with cognitive processes, event-related potentials, and seizure activity [60]. Modern EEG systems have evolved toward wearable platforms that enable research outside traditional laboratory settings, including real-time monitoring of mental workload, decoding of affective states, and neurofeedback applications [60].
The spatial resolution of EEG is relatively low due to distortion that occurs when electrical signals pass through the skull and scalp [2]. High channel count EEG systems can achieve spatial resolution on the order of centimeters, but this comes at the cost of long setup times and the sometimes unwieldy application of coupling gel [2]. EEG is also sensitive to electrical noise from the environment and artifacts from ocular or muscle movement that can be orders of magnitude larger than neural signals of interest [2].
Functional Near-Infrared Spectroscopy (fNIRS)
fNIRS utilizes near-infrared light (650-950 nm) to measure changes in oxygenated hemoglobin (HbO) and deoxygenated hemoglobin (HbR) concentrations on the cortical surface, providing an indirect measure of neural activity [17]. This optical technique measures ~15mm deep into the cortex, offering superior temporal resolution compared to fMRI and better spatial resolution than EEG [2]. The portability, cost-effectiveness, and higher tolerance for motion artifacts make fNIRS particularly suitable for studies involving active behaviors and naturalistic settings, such as rehabilitation exercises, social interactions, and real-world cognitive tasks [17] [3].
Time-domain fNIRS (TD-fNIRS) systems, which measure the time-of-flight of photons, are capable of both measuring absolute oxygenation and circumventing confounding factors like scalp, hair color, and movement [2]. The spatial resolution of fNIRS is typically lower than fMRI, generally ranging from 1 to 3 centimeters, which restricts the ability to precisely localize brain activity [17]. Moreover, fNIRS is confined to monitoring superficial cortical regions due to the limited penetration depth of near-infrared light, making it unsuitable for investigating subcortical structures [17].
Diagram 1: Neural activity measurement pathways. fMRI and fNIRS measure the hemodynamic response linked to neural activity via neurovascular coupling, while EEG measures electrical activity directly.
Case Study 1: Alzheimer's Disease and Related Dementias
fNIRS Application in ADRD with Chronic Pain
An exploratory study published in 2025 examined the relationship between self-reported pain, neuropsychiatric symptoms, and pain-evoked cortical hemodynamic changes using fNIRS in individuals with Alzheimer's Disease and Related Dementias (ADRD) [61]. The research analyzed baseline data from 40 individuals with mild to moderate ADRD and knee osteoarthritis, employing fNIRS to measure cerebral hemodynamic responses to sub-threshold thermal pain stimulation across five brain regions bilaterally: prefrontal cortex and primary motor and somatosensory cortices [61].
The study revealed significant negative correlations for oxyhemoglobin and apathy in the right prefrontal cortex associated with low cognitive function (p = .04) and significant positive correlations for oxyhemoglobin and apathy in the right somatosensory region (p = .04) [61]. For individuals with higher cognitive function, significant positive correlations emerged for oxyhemoglobin and pain in the medial prefrontal cortex (p = .04) [61]. These findings suggest that fNIRS may provide valuable biomarkers for apathy and depression in individuals with ADRD and chronic osteoarthritic pain, with differential patterns based on cognitive status [61].
Table 2: fNIRS Findings in ADRD Patients with Chronic Pain
| Brain Region | Hemodynamic Correlation | Clinical Correlation | Cognitive Function Association |
|---|---|---|---|
| Right Prefrontal Cortex | Oxyhemoglobin ↓ | Apathy ↑ | Low cognitive function |
| Right Somatosensory Region | Oxyhemoglobin ↑ | Apathy ↑ | Low cognitive function |
| Medial Prefrontal Cortex | Oxyhemoglobin ↑ | Pain ↑ | High cognitive function |
Experimental Protocol: fNIRS in ADRD
Participants: 40 individuals aged 50-90 years with mild-moderate ADRD diagnosis and chronic pain (pain >3 on Numeric Rating Scale 0-100) [61].
fNIRS Setup: The system measured relative changes in concentration of oxygenated and deoxygenated hemoglobin at wavelengths of 730 nm and 850 nm with a sampling rate of 11 Hz [32]. The optode placement followed the international 10/20 system, with channels assigned to five regions of interest: prefrontal cortex, pre-motor cortex, Wernicke's area, sensorimotor cortex, and visual cortex [32].
Stimulation Protocol: Sub-threshold thermal pain stimulation applied while recording cortical hemodynamic responses [61].
Data Preprocessing:
- Trimming of first 10 seconds of data
- Calculation of Coefficient of Variation (CV) for signal quality assessment (channels with CV > 20% excluded)
- Bandpass filtering (0.02-0.08 Hz) using finite impulse response (FIR) filter
- Motion artifact detection via global variance in temporal derivative (GVTD) metric
- Physiological noise removal using principal component analysis (PCA) [32]
Analysis: Correlation of oxyhemoglobin and deoxyhemoglobin concentration changes with clinical measures including neuropsychiatric symptoms and pain ratings, stratified by cognitive function level [61].
Case Study 2: Motor Rehabilitation
Combined fMRI-fNIRS in Motor Imagery Tasks
A 2024 study investigated structure-function relationships in brain networks using simultaneous EEG and fNIRS recordings during motor imagery tasks [39]. The research involved 18 healthy subjects who underwent synchronous EEG and fNIRS recordings during 1-minute resting state sessions and 30 trials of 10-second left and right-hand motor imagery tasks [39]. fNIRS data were collected by 36 channels (14 sources and 16 detectors with an inter-optode distance of 30 mm) following the standardized 10-20 EEG system at a 12.5 Hz sampling rate [39].
The results demonstrated that fNIRS could effectively detect task-related hemodynamic changes in motor regions during motor imagery. The integration of fNIRS with fMRI in motor rehabilitation research capitalizes on fMRI's high spatial resolution for precise localization of motor areas combined with fNIRS's superior temporal resolution and portability for monitoring rehabilitation progress over time [17]. This approach is particularly valuable for studying dynamic movements and tracking neuroplastic changes throughout the recovery process [17] [3].
Experimental Protocol: Motor Imagery with fNIRS-EEG
Participants: 18 healthy subjects (28.5 ± 3.7 years) [39].
Experimental Design:
- 1-minute resting state recording
- 30 trials of 10-second left and right-hand motor imagery tasks
- Task epochs: 0 to 10 seconds relative to stimulus onset
Simultaneous Recording Setup:
- EEG: 30 electrodes according to international 10-5 system, 1000 Hz sampling rate (down-sampled to 200 Hz) [39]
- fNIRS: 36 channels (14 sources, 16 detectors), 30mm inter-optode distance, 12.5 Hz sampling rate (down-sampled to 10 Hz), wavelengths 760 nm and 850 nm [39]
fNIRS Preprocessing:
- Optical density transformation
- Signal quality assessment via scalp-coupled index (SCI < 0.7 excluded)
- Bandpass filtering (0.02-0.08 Hz) using finite impulse response (FIR) filter
- Motion artifact detection and rejection via global variance in temporal derivative (GVTD) metric
- Physiological noise removal using principal component analysis (PCA) [39]
Analysis Approach: Functional connectivity analysis based on region of interest, channel, and network levels to identify task-related activation patterns and network reorganization [39].
Diagram 2: Multimodal experimental workflow for simultaneous fNIRS-EEG acquisition in motor imagery tasks.
Case Study 3: Disorders of Consciousness
fNIRS for Differentiating Minimally Conscious State
A 2025 resting-state fNIRS study investigated functional connectivity patterns in patients with disorders of consciousness (DOC) to differentiate minimally conscious state (MCS) from vegetative state/unresponsive wakefulness syndrome (VS/UWS) [32]. The research included 52 DOC patients (26 MCS and 26 VS/UWS) and 49 healthy controls who underwent 5-minute resting-state fNIRS recordings using a 63-channel system covering prefrontal, premotor, sensorimotor, and Wernicke's areas [32].
The study found that VS/UWS patients exhibited significantly reduced functional connectivity compared to MCS patients, particularly between prefrontal cortex, premotor cortex, sensorimotor regions, and Wernicke's area (p < 0.01), as well as within auditory, frontoparietal, and default mode networks (p < 0.05) [32]. These connectivity differences correlated with Coma Recovery Scale-Revised (CRS-R) scores, particularly visual, motor, and verbal subscales (p < 0.05) [32]. For classification, functional connectivity between specific channels achieved 76.92% accuracy (AUC = 0.818) in distinguishing MCS from VS/UWS patients, while auditory network connectivity achieved 73.08% accuracy (AUC = 0.803) [32].
Experimental Protocol: Resting-State fNIRS in DOC
Participants: 52 DOC patients (26 MCS, 26 VS/UWS) and 49 healthy controls [32].
Assessment: Coma Recovery Scale-Revised (CRS-R) conducted by blinded professional therapists [32].
fNIRS Setup: NirSmart-6000A system (continuous wave), 24 light sources and 24 detectors forming 63 effective channels, source-detector distance 3cm, wavelengths 730 nm and 850 nm, sampling rate 11 Hz [32].
Protocol:
- 5-minute resting-state recording in quiet room
- Patient bed elevated to 30° angle with head support
- Arousal stimulation applied before assessment
- Subjects remain still during recording [32]
Data Preprocessing:
- Trimming first 10 seconds
- Signal quality assessment via Coefficient of Variation (CV > 20% excluded)
- Conversion to oxygenated and deoxygenated hemoglobin concentrations
- Bandpass filtering appropriate for resting-state analysis [32]
Analysis:
- Functional connectivity matrix calculation
- Region of interest, channel-wise, and network-level analyses
- Correlation with CRS-R scores
- Machine learning classification (linear support vector machines) [32]
Table 3: Essential Research Equipment and Reagents for Multimodal Neuroimaging
| Item | Function/Application | Technical Specifications |
|---|---|---|
| fNIRS Systems (NirSmart-6000A [32]) | Measures cortical hemodynamic changes via near-infrared light absorption | Continuous wave, 730-850nm wavelengths, 11Hz sampling, 3cm optode spacing |
| High-Density EEG | Records electrical brain activity with high temporal resolution | 30+ electrodes, 1000Hz sampling, international 10-5/10-20 placement [39] |
| MRI-Compatible fNIRS Probes | Enables simultaneous fMRI-fNIRS acquisition | Non-magnetic materials, MRI environment safe [17] |
| Homer2 Toolbox [32] | fNIRS data preprocessing and analysis | MATLAB-based, optical density conversion, artifact removal |
| NIRS-KIT [32] | Advanced fNIRS data processing | Functional connectivity analysis, network metrics |
| BrainNet Viewer [32] | Neuroimaging data visualization | Brain network visualization, customizable displays |
| 3D Digitization Systems | Precise optode/electrode localization | Spatial registration with anatomical templates [39] |
Comparative Analysis and Integration Approaches
Multimodal Integration Strategies
The combination of multiple neuroimaging modalities has become increasingly prevalent in brain research, driven by the recognition that no single technique can fully capture the complexity of neural activity [17]. Integrating fMRI with fNIRS capitalizes on their complementary strengths: fMRI provides high spatial resolution and whole-brain coverage including subcortical structures, while fNIRS offers superior temporal resolution, portability, and higher tolerance for motion [17] [50]. This synergy enables researchers to correlate real-time cortical activity captured by fNIRS with detailed spatial localization from fMRI [50].
Two primary integration methodologies have emerged: synchronous and asynchronous detection modes [17]. Synchronous acquisition involves simultaneously collecting data from both modalities, allowing direct correlation of signals despite their different physiological origins and temporal characteristics [17]. Asynchronous approaches involve separate data collection sessions, often using one modality to inform the experimental design or analysis of the other [17]. Both approaches have advanced research in neurological disorders, social cognition, and neuroplasticity [17].
Technical Challenges in Multimodal Integration
Combining different neuroimaging techniques presents significant technical challenges. Hardware incompatibilities, such as electromagnetic interference in MRI environments, can compromise data quality [17]. Experimental limitations include restricted movement paradigms in fMRI that conflict with the naturalistic settings where fNIRS excels [17]. Data fusion complexities arise from the different spatial and temporal resolutions, physiological origins, and noise profiles of each modality [17].
Future directions emphasize hardware innovation (such as fNIRS probes compatible with MRI environments), standardized protocols, and advanced data integration driven by machine learning approaches [17]. These advancements aim to solve the depth limitation of fNIRS and improve inference of subcortical activities [17]. The development of wearable, multimodal systems that combine EEG and fNIRS represents a promising direction for naturalistic brain monitoring outside laboratory constraints [39] [60].
Diagram 3: Neuroimaging modality selection logic based on research requirements and technical constraints.
The case studies presented demonstrate how fMRI, EEG, and fNIRS each contribute unique capabilities to clinical neuroscience research. In Alzheimer's disease, fNIRS provides practical biomarkers for neuropsychiatric symptoms and pain processing, particularly valuable in cognitively impaired populations where other modalities face limitations [61]. For motor rehabilitation, the combination of fNIRS with EEG or fMRI enables comprehensive monitoring of neuroplastic changes and functional recovery with both temporal and spatial precision [39]. In disorders of consciousness, fNIRS offers a portable solution for bedside assessment and differentiation of clinical states based on functional connectivity patterns [32].
The integration of multiple neuroimaging modalities represents the future of clinical brain research, leveraging complementary strengths to overcome individual limitations [17] [50]. As hardware innovations continue to improve compatibility and data analysis methods advance through machine learning, multimodal approaches will increasingly bridge spatial and temporal gaps in neuroimaging [17]. This progress will enhance diagnostic and therapeutic strategies across neurological and psychiatric disorders, ultimately improving patient care and advancing our understanding of human brain function.
Overcoming Technical and Practical Challenges in Neuroimaging
Functional Magnetic Resonance Imaging (fMRI) has stood as the gold standard for non-invasive brain imaging for decades, providing unparalleled spatial resolution for localizing neural activity throughout the entire brain, including deep structures [9] [50] [3]. The technique relies on detecting the blood oxygen level-dependent (BOLD) signal, which exploits the different magnetic properties of oxygenated and deoxygenated hemoglobin [9] [3]. When a brain region becomes active, a complex neurovascular coupling process leads to an increase in blood flow that surpasses the local oxygen demand, resulting in a measurable decrease in deoxygenated hemoglobin and a subsequent increase in the MR signal [9]. This mechanism allows fMRI to produce high-resolution activation maps that have revolutionized cognitive neuroscience, facilitating studies on sensory processing, motor control, emotional regulation, and complex cognitive functions such as memory and decision-making [50].
Despite its significant contributions, fMRI faces several inherent constraints that limit its application across research and clinical domains. The technology requires expensive, immobile equipment housed in magnetically shielded environments, leading to substantial operational costs that typically exceed $1,000 per scan [2] [50]. The scanner environment itself imposes significant practical constraints, including contraindications for individuals with metallic implants, triggering of claustrophobia, restrictions on participant movement, the typical supine position required, and interference from loud acoustic noise generated by gradient coils [9] [50] [3]. Furthermore, fMRI is highly sensitive to motion artifacts, making it particularly challenging to use with populations such as children, elderly patients, or individuals with neurological conditions that affect their ability to remain still [50] [3]. These limitations have prompted the exploration of alternative neuroimaging technologies that can complement or substitute for fMRI in specific applications, most notably electroencephalography (EEG) and functional near-infrared spectroscopy (fNIRS).
Technical Comparative Analysis of fMRI, EEG, and fNIRS
Understanding the fundamental operational principles and technical specifications of fMRI, EEG, and fNIRS is essential for selecting the appropriate technology for specific research questions or clinical applications. Each technique captures distinct physiological correlates of brain activity with different spatial and temporal characteristics.
Table 1: Technical Specifications and Comparative Analysis of Neuroimaging Modalities
| Parameter | fMRI | EEG | fNIRS |
|---|---|---|---|
| What is Measured | Blood Oxygenation Level-Dependent (BOLD) signal [9] [3] | Electrical potentials from synchronized neuronal firing [2] | Concentration changes in oxygenated (HbO) and deoxygenated hemoglobin (HbR) [9] [50] |
| Spatial Resolution | High (millimeters) [2] [50] | Low (centimeters) [2] [48] | Moderate (centimeters) [2] [50] |
| Temporal Resolution | Low (0.33-2 Hz, limited by hemodynamic response) [50] | High (milliseconds) [2] [48] | Moderate (up to 10+ Hz) [50] [39] |
| Penetration Depth | Whole brain (cortical and subcortical) [50] | Superficial layers of cortex [2] | Superficial cortex (∼15-20mm) [2] [62] |
| Portability | No (requires fixed scanner environment) [50] [3] | Yes (increasingly portable systems) [48] | Yes (fully portable/wearable systems) [50] [3] |
| Typical Setup Time | Long (30+ minutes) [3] | Moderate to Long (10-30+ minutes) [2] | Short (<5 minutes) [2] [3] |
| Approximate Cost | Very High ($1000+/scan, high equipment cost) [2] [50] | Low to Moderate [48] | Moderate [3] |
| Tolerance to Motion | Low [50] [3] | Moderate (sensitive to muscle artifacts) [2] | High [50] [3] |
| Key Limitations | Cost, accessibility, motion restriction, noise, contraindications for metal implants [9] [50] [3] | Limited spatial resolution, sensitivity to artifacts from ocular and muscle movement, signal distortion from skull and scalp [2] [48] | Limited to cortical measurements, lower spatial resolution than fMRI, sensitivity to scalp hemodynamics [62] [50] [3] |
Fundamental Operational Principles
fMRI measures brain activity indirectly through the BOLD contrast mechanism, which is influenced by regional changes in blood flow, blood volume, and oxygen consumption [9]. The resulting signal provides an excellent spatial localization of neural activity throughout the entire brain but represents a slow hemodynamic response that lags neural activity by 4-6 seconds [50]. In contrast, EEG measures electrical activity generated by the synchronized firing of populations of neurons in the cortex through electrodes placed on the scalp [2]. This direct measurement of electrophysiological activity provides millisecond temporal resolution, allowing researchers to capture rapid neural dynamics, but suffers from limited spatial resolution due to the distorting effects of the skull and scalp on electrical fields [2] [48].
fNIRS occupies a middle ground between these techniques, measuring hemodynamic responses similar to fMRI but using optical principles [9]. The technology employs near-infrared light (650-950 nm) to measure changes in hemoglobin concentrations in cortical tissue based on their distinct absorption spectra [9] [50]. When neural activity increases in a brain region, neurovascular coupling leads to changes in oxygenated and deoxygenated hemoglobin concentrations that fNIRS detects with a temporal resolution superior to fMRI and spatial resolution superior to EEG [2] [50]. The technique is particularly valuable because it can be deployed in portable, wearable systems that enable brain imaging in naturalistic settings outside the laboratory [50] [3].
Quantitative Approaches to Mitigate fMRI Limitations
Cost and Efficiency Optimization in fMRI Study Design
The high cost of fMRI has traditionally constrained study designs, particularly forcing a trade-off between sample size and scan duration per participant. Recent research provides quantitative guidance for optimizing this balance. A 2025 Nature article demonstrates that prediction accuracy in brain-wide association studies (BWAS) increases with both sample size and total scan duration (calculated as sample size × scan time per participant) [63]. This relationship follows a pattern of diminishing returns, where each additional unit of scan time or sample size provides progressively smaller gains in prediction accuracy.
Table 2: Cost-Efficiency Optimization in fMRI Study Design Based on Empirical Data [63]
| Scan Time (Minutes) | Relative Prediction Accuracy | Cost Efficiency | Recommended Application Context |
|---|---|---|---|
| 10 | Low | Inefficient | Not recommended for high prediction performance |
| 20 | Moderate | Improved | Minimum recommended duration |
| 30 | High | Optimal (22% savings over 10min scans) | Most cost-effective for majority of studies |
| >30 | Higher | Marginally decreasing but cheaper than undershooting | Recommended when possible, especially for subcortical studies |
Empirical evidence indicates that for scans of ≤20 minutes, prediction accuracy increases linearly with the logarithm of the total scan duration, suggesting that sample size and scan time are initially interchangeable [63]. However, sample size ultimately proves more important than scan duration for improving prediction accuracy. Nevertheless, when accounting for overhead costs per participant (such as recruitment), longer scans can be substantially more cost-effective than larger sample sizes for improving prediction performance [63]. The research demonstrates that 30-minute scans are, on average, the most cost-effective, yielding 22% savings over 10-minute scans. Additionally, overshooting the optimal scan time is cheaper than undershooting it, leading to the recommendation of a scan time of at least 30 minutes for most studies [63].
Protocol for Optimized fMRI Data Acquisition
Experimental Rationale: To maximize prediction accuracy while maintaining cost efficiency in brain-wide association studies [63].
Materials and Equipment:
- 3T MRI scanner with standard head coil
- Participant recruitment materials
- Paradigm presentation system compatible with MRI environment
- Comfort aids (padding, noise reduction) to minimize motion
Procedure:
- Screen participants for MRI contraindications (metal implants, claustrophobia)
- Optimize participant positioning and provide comprehensive instruction to reduce anxiety and movement
- Acquire structural scans for anatomical reference
- Perform functional scans with the following optimized parameters:
- Total scan duration: Minimum 20 minutes, ideally 30 minutes or longer
- For resting-state fMRI: Ensure continuous acquisition of at least 20-30 minutes
- For task-based fMRI: Design task blocks to maximize efficiency within the 30-minute window
- Implement real-time monitoring for data quality assurance
Analytical Approach:
- Preprocess data using standard pipelines (motion correction, normalization)
- Calculate functional connectivity matrices
- Employ machine learning approaches (kernel ridge regression) for phenotypic prediction
- Utilize open-source tools for scan time optimization calculations
fNIRS as a Complementary Hemodynamic Modality
Technical Synergies Between fMRI and fNIRS
fNIRS has emerged as a powerful complementary technology to fMRI that addresses several of its limitations while measuring similar hemodynamic responses. Both techniques are sensitive to changes in hemoglobin oxygenation resulting from neural activity, with fNIRS providing direct measurements of both oxygenated (HbO) and deoxygenated hemoglobin (HbR) concentrations, unlike the BOLD signal which primarily reflects deoxyhemoglobin changes [9] [3]. This complementary relationship enables fNIRS to serve as a validation tool for fMRI findings and as a substitute in situations where fMRI is impractical.
The portability and motion tolerance of fNIRS represent its most significant advantages over fMRI. fNIRS systems can be completely portable, enabling subjects to move freely during measurements, which allows for brain imaging during naturalistic behaviors, social interactions, rehabilitation exercises, and even outside laboratory settings [50] [3]. This flexibility has opened new research possibilities in populations and contexts previously inaccessible to fMRI, including infant neurodevelopment studies, examination of full-body movements, bedside monitoring of clinical populations, and investigations of social cognition in ecologically valid settings [9] [50].
Table 3: fNIRS Applications Addressing Specific fMRI Limitations
| fMRI Limitation | fNIRS Solution | Research Applications |
|---|---|---|
| High Cost | Lower equipment and operational costs [3] | Larger sample sizes, longitudinal studies, resource-limited settings |
| Limited Accessibility | Portable, bedside monitoring [50] | ICU monitoring, home-based studies, field research |
| Motion Sensitivity | High tolerance to movement artifacts [50] [3] | Studies with children, patients with movement disorders, exercise studies |
| Restrictive Environment | Naturalistic measurement conditions [50] | Social interactions, classroom learning, real-world cognitive tasks |
| Metal Implant Contraindication | No magnetic field [3] | Patients with deep brain stimulators, cochlear implants, surgical plates |
Experimental Protocol for fNIRS Motor Task Validation
Experimental Rationale: To validate fNIRS against fMRI for measuring cortical activation during motor tasks, establishing its reliability as an alternative modality [62] [3].
Materials and Equipment:
- Continuous-wave fNIRS system with sources at 760nm and 850nm wavelengths
- Optode configuration for coverage of motor cortex (C3/C4 locations based on 10-20 system)
- 3D digitizer for precise optode localization
- Task presentation system
- Data acquisition software
Procedure:
- Position fNIRS optodes over motor cortex regions using the international 10-20 system for placement reference
- Ensure inter-optode distance of 30mm to achieve appropriate penetration depth (~15-20mm)
- Perform 3D digitization of optode positions for anatomical coregistration
- Conduct block-design motor paradigm:
- Baseline rest period: 30 seconds
- Motor execution: Finger tapping or hand squeezing for 15-20 seconds
- Repeat 5-10 cycles
- Record simultaneous fMRI if performing simultaneous validation (requires MRI-compatible fNIRS equipment)
Data Analysis:
- Convert raw light intensity to optical density
- Apply bandpass filtering (0.01-0.2 Hz) to remove physiological noise
- Convert to hemoglobin concentration changes using Modified Beer-Lambert Law
- Perform general linear model analysis with hemodynamic response function convolution
- Compare activation maps with fMRI BOLD responses from simultaneous or separate sessions
Validation Metrics: Strong spatial correlation between fNIRS HbO increases and fMRI BOLD responses in motor cortex, with typical correlations ranging from r=0.6-0.9 in validation studies [62] [64].
EEG as an Electrophysiological Complement
Temporal Resolution Advantages of EEG
While fNIRS addresses many spatial and practical limitations of fMRI, EEG provides complementary information with exceptional temporal resolution. EEG measures electrical activity generated by the synchronized firing of neuronal populations in the cortex, capturing neural dynamics directly with millisecond precision rather than through the slow hemodynamic response [2] [48]. This allows researchers to investigate rapid neural processes such as event-related potentials, neural oscillations, and transient network dynamics that are inaccessible to hemodynamic-based methods.
The practical advantages of EEG include relatively low cost, increasing portability, and minimal physical restrictions [48]. Modern EEG systems can be deployed in diverse environments outside traditional laboratory settings, making them suitable for studying brain function during natural behaviors, in educational contexts, and in clinical settings where fMRI would be impractical. However, EEG faces its own limitations, including limited spatial resolution due to the blurring effects of the skull and scalp, sensitivity to artifacts from muscle activity and eye movements, and difficulty localizing deep brain sources [2] [48].
Experimental Protocol for EEG Color Perception Study
Experimental Rationale: To demonstrate EEG's capability to detect differential neural responses to visual stimuli with high temporal precision [65].
Materials and Equipment:
- 64-channel EEG system with active electrodes
- CRT or LCD monitor with precise color calibration
- Electromagnetically shielded room
- Stimulus presentation software (e.g., E-Prime, PsychToolbox)
- Chin rest to maintain viewing distance and minimize movement
Procedure:
- Apply EEG cap according to international 10-10 system
- Achieve electrode impedances below 10 kΩ
- Calibrate monitor for precise RGB color presentation (R=[181 0 0], G=[0 124 0], B=[0 0 255]) with isoluminance (L=8.99 cd/m²)
- Position participant 70cm from monitor in darkened room
- Present experimental paradigm:
- Fixation cross (3 seconds)
- Color stimulus (10 seconds)
- Repeat for each color (R, G, B) in randomized order for 5 trials each
- Record continuous EEG at 512 Hz sampling rate
Data Analysis:
- Apply bandpass filtering (0.1-40 Hz)
- Remove artifacts using independent component analysis (ocular, cardiac)
- Extract event-related potentials time-locked to stimulus onset
- Compute time-frequency representations for oscillatory activity
- Analyze power in theta (4-7 Hz), alpha (8-12 Hz), and beta (13-30 Hz) bands
- Perform statistical comparisons between color conditions
Expected Outcomes: Distinct spectral power patterns for different colors, with beta oscillation for green occurring in early sensory periods with latency shifting in the occipital region, and decreased theta power for blue in occipital regions [65].
Multimodal Integration: The Path Forward
Synergistic Integration Frameworks
The limitations of individual neuroimaging modalities have prompted increasing interest in multimodal approaches that combine their complementary strengths. Simultaneous fMRI-EEG recording, while technically challenging due to electromagnetic interference, provides unparalleled spatiotemporal resolution by combining fMRI's millimeter spatial precision with EEG's millisecond temporal resolution [48]. Similarly, integrated fNIRS-EEG systems have gained popularity as they overcome the individual limitations of each technique while providing information about both electrophysiological activity and hemodynamic responses [48].
These multimodal approaches enable researchers to address fundamental questions in neuroscience that cannot be adequately explored with single modalities. For instance, simultaneous fNIRS-fMRI recordings have been instrumental in validating fNIRS against the gold standard of fMRI while providing insights into the physiological mechanisms underlying the BOLD response [62] [50]. Meanwhile, combined fNIRS-EEG systems offer a practical solution for studying brain function in naturalistic environments with complementary neural and hemodynamic information [48].
Diagram 1: Strategic framework for addressing fMRI limitations through alternative technologies and multimodal integration. fNIRS primarily addresses cost, accessibility, and motion limitations, while EEG provides superior temporal resolution. Multimodal approaches combine strengths to overcome individual technique limitations.
Experimental Protocol for Simultaneous fNIRS-EEG Acquisition
Experimental Rationale: To capture complementary electrophysiological and hemodynamic information for comprehensive brain mapping [48] [39].
Materials and Equipment:
- Integrated fNIRS-EEG system or separate systems with synchronization capability
- Customized helmet for dual-modality acquisition (3D-printed or thermoplastic)
- fNIRS sources (760nm, 850nm) and detectors
- EEG active electrodes and amplifier
- 3D digitizer for precise anatomical coregistration
Procedure:
- Select appropriate integrated helmet or arrange separate fNIRS optodes and EEG electrodes with minimal interference
- Ensure proper optode-electrode spacing to prevent signal contamination
- Achieve good scalp coupling for both modalities (impedance <10 kΩ for EEG, adequate pressure for fNIRS)
- Perform 3D digitization of all sensor positions
- Conduct experimental paradigm (e.g., motor imagery, cognitive task)
- Record simultaneous data with precise temporal synchronization
Data Analysis:
- Preprocess EEG and fNIRS data separately using modality-specific pipelines
- Temporally align datasets using synchronization markers
- Extract features from both modalities (EEG: time-frequency features, ERPs; fNIRS: HbO/HbR concentrations)
- Perform multimodal data fusion:
- Model-based integration: Using neural activity to inform hemodynamic models
- Data-driven integration: Joint independent component analysis, multimodal classification
- Correlate temporal features across modalities to investigate neurovascular coupling
Applications: Brain-computer interfaces, clinical monitoring, cognitive neuroscience studies requiring both rapid neural dynamics and hemodynamic information [48] [39].
The Scientist's Toolkit: Essential Research Reagent Solutions
Table 4: Essential Materials and Equipment for Multimodal Neuroimaging Research
| Item | Function | Technical Specifications | Application Context |
|---|---|---|---|
| 3T MRI Scanner | High-resolution structural and functional imaging | Magnetic field strength: 3 Tesla, Gradient strength: ≥40 mT/m, RF coils: Multi-channel head coils | Gold standard for anatomical reference and deep brain functional imaging [9] [50] |
| Portable fNIRS System | Hemodynamic monitoring in naturalistic settings | Light sources: 760nm & 850nm LEDs/lasers, Detectors: Avalanche photodiodes, Sampling rate: ≥10Hz | Mobile brain imaging, clinical bedside monitoring, studies with movement [50] [3] |
| High-Density EEG System | Electrophysiological recording with high temporal resolution | Electrodes: 64+ channels, Amplifier: 24-bit resolution, Sampling rate: ≥1000Hz, Input impedance: >1 GΩ | Event-related potential studies, neural oscillation analysis, brain-computer interfaces [65] [48] |
| 3D Digitization System | Precise anatomical localization of sensors | Accuracy: <0.5mm, Tracking technology: Infrared/electromagnetic | Coregistration of EEG/fNIRS sensors with anatomical MRI [39] |
| Multimodal Integration Helmet | Simultaneous acquisition of multiple signals | Material: 3D-printed polymer/thermoplastic, Customizable optode/electrode holders | Simultaneous fNIRS-EEG studies, ensuring stable sensor placement [48] |
| Stimulus Presentation System | Controlled delivery of experimental paradigms | Display: Precision-calibrated monitor, Software: E-Prime/PsychToolbox, Synchronization: TTL pulse capability | Visual perception studies, cognitive task administration [65] |
The limitations of fMRI—including high costs, limited accessibility, and motion restrictions—present significant challenges for researchers and clinicians, but also create opportunities for alternative and complementary neuroimaging technologies. fNIRS emerges as a powerful solution to many of fMRI's practical constraints, offering portability, cost-effectiveness, and greater tolerance for movement while measuring similar hemodynamic responses. EEG provides complementary information with exceptional temporal resolution for capturing rapid neural dynamics. Quantitative optimization of fMRI study designs, particularly through longer scan durations (≥30 minutes) and appropriate sample sizes, can significantly improve cost efficiency without compromising scientific value [63].
Looking forward, multimodal integration represents the most promising path for advancing neuroimaging research. Combined fNIRS-EEG systems offer a practical approach for studying brain function in naturalistic environments with complementary hemodynamic and electrophysiological information [48] [39]. Simultaneous fMRI-fNIRS recordings continue to provide valuable insights into neurovascular coupling and validate fNIRS against the gold standard of fMRI [62] [50]. As these technologies evolve and integration methodologies become more sophisticated, researchers will be increasingly equipped to tackle complex questions about brain function in diverse populations and real-world contexts, ultimately advancing both basic neuroscience and clinical applications.
Electroencephalography (EEG) is a cornerstone non-invasive technique for measuring brain function, prized for its millisecond temporal resolution that captures neural dynamics in real time [66] [67]. However, its utility is constrained by two fundamental limitations: low spatial resolution and high sensitivity to artifacts. The spatial resolution of conventional scalp EEG is poor, often estimated between 5 to 9 cm, primarily due to the blurring effect (volume conduction) as electrical signals pass through the skull and other resistive head tissues [68]. Simultaneously, EEG is highly susceptible to artifacts from both environmental sources (e.g., power line interference) and physiological sources (e.g., ocular movements, cardiac activity, muscle movement, and head motion), which can be orders of magnitude larger than the neural signals of interest [2] [69]. This technical review details the neurophysiological origins of these challenges and provides a comprehensive guide to state-of-the-art methodological solutions, framing EEG within the broader context of non-invasive neuroimaging alongside functional Magnetic Resonance Imaging (fMRI) and functional Near-Infrared Spectroscopy (fNIRS).
The Neurophysiological and Technical Basis of EEG's Limitations
The Spatial Resolution Problem: Volume Conduction and Beyond
The electrical potentials measured by scalp electrodes are not a direct or localized readout of underlying brain activity. The signals generated by synchronized postsynaptic potentials of cortical pyramidal neurons must traverse several layers—including the cerebrospinal fluid (CSF), skull, and scalp—before reaching the electrodes [68] [70]. The skull, in particular, has high electrical resistivity compared to other tissues, causing a severe attenuation and spatial smearing of the potentials [70]. This phenomenon, known as volume conduction, means that the activity recorded at any single scalp electrode represents a weighted sum, or mixture, of activity from multiple underlying brain sources [68]. Consequently, the spatial origin of neural events is difficult to pinpoint, and the activation map appears more diffuse than it is.
Furthermore, the necessity of using a reference electrode for measuring potential differences further contributes to this spatial smearing, distorting the recovered time course of the underlying neural sources [68].
EEG's exquisite sensitivity to electrical potentials makes it vulnerable to a wide array of non-neural signals:
- Physiological Artifacts: These include signals from ocular movements (blinks, saccades), cardiac activity (pulse artifacts), muscle activity (electromyogram, or EMG), and skin sweating [70] [69]. Head motion, even when subtle, can induce artifacts by changing the geometry of EEG leads within the static magnetic field of an MRI scanner or by altering electrode-scalp contact [69].
- Environmental Artifacts: These encompass power line interference (50/60 Hz), improper electrode contact, and, in the context of simultaneous EEG-fMRI, massive artifacts generated by time-varying gradient fields and the pulsed radio-frequency fields used for imaging [70] [69].
Methodological Advances for Enhancing Spatial Resolution
Overcoming EEG's poor spatial resolution requires computational techniques that "de-blur" the scalp-recorded signals. The core prerequisite for these methods is a high-density electrode array (typically 64 to 256 channels) and an accurate head model based on individual anatomical MRI scans [70].
Head Modeling and the Forward Problem
The first critical step is solving the forward problem, which calculates the scalp potential distribution that would be generated by a known source in the brain. This requires building a biophysically accurate head model that incorporates:
- Individual Anatomy: The precise shape and thickness of the skull, CSF, and scalp derived from an MRI scan [70].
- Electrode Co-registration: The exact 3D location of each electrode on the subject's scalp [70]. This information is integrated into a lead field, a matrix that defines how the electric activity at each electrode relates to the activity of possible sources throughout the brain [70].
Solving the Inverse Problem: Source Imaging Algorithms
The inverse problem—estimating the intracranial sources from the scalp measurements—is mathematically ill-posed, as an infinite number of source configurations can produce the same scalp potential map. Solutions therefore require incorporating a priori constraints [70].
Table 1: Common EEG Source Imaging (ESI) Algorithms
| Algorithm Category | Key Principle / Constraint | Example Methods | Key Characteristics |
|---|---|---|---|
| Equivalent Current Dipoles | Assumes a small, limited number of focal active brain areas [70]. | BESA, MUSIC [70] | Well-suited for localized activity (e.g., epileptic foci, primary sensory areas). Biased if the number of dipoles is mis-specified [70]. |
| Distributed Source Models | Assumes a current density distribution across a 3D grid of solution points (typically thousands) within the brain [70]. | Minimum Norm (MN), Low Resolution Electromagnetic Tomography (LORETA), Local AUtoRegressive Average (LAURA) [70] | No a priori assumption about the number of active areas. MN solutions are biased toward superficial sources; LORETA and LAURA incorporate spatial smoothness and biophysical laws to improve accuracy [70]. |
The Surface Laplacian / Current Source Density (CSD)
A simpler yet powerful computational technique that does not require an anatomical MRI is the Surface Laplacian, which estimates the Current Source Density (CSD). The CSD is proportional to the current entering or leaving the intracranial space directly beneath a scalp electrode, effectively representing the local radial current flow [68]. This transformation dramatically reduces the spatial smearing effect of volume conduction by filtering out the low-spatial-frequency components of the scalp potential that are caused by signal spread through the skull [68]. Notably, improving spatial resolution with the CSD also secondarily enhances the temporal resolution of EEG by providing a more accurate time course of the underlying brain sources [68].
The following diagram illustrates the core workflow for overcoming EEG's spatial resolution challenge.
Diagram 1: Workflow for enhancing EEG spatial resolution through source imaging or the Surface Laplacian.
Protocols for Artifact Detection and Mitigation
A multi-stage approach is essential for dealing with the diverse sources of EEG artifacts.
Experimental Setup and Hardware-Based Solutions
Proactive measures during setup can prevent artifacts:
- Cap Modification for Motion Detection: For studies in high-artifact environments (e.g., inside an MRI scanner), a simple cap modification can be implemented. Four electrodes are isolated from the scalp and connected to the reference via added resistors, creating sensors that record only magnetic induction effects from head motion, providing a clean signal for subsequent artifact correction [69].
- Integrated "Reference Layer" Systems: Some systems use a layer of electrodes placed over the EEG cap but isolated from the scalp. This "reference layer" records only the induction artifacts, which can then be subtracted from the true EEG channels [69].
Data Pre-processing and Denoising Pipelines
A robust, multi-step pre-processing pipeline is mandatory:
- Filtering: Apply temporal band-pass filters (e.g., 0.1–100 Hz for evoked potentials) to remove non-physiological and non-relevant frequencies [70].
- Artifact Detection and Removal: This can involve:
- Visual Inspection: The gold standard, though time-consuming [70].
- Automatic Detection/Rejection: Algorithms to identify and reject epochs contaminated by large artifacts.
- Adaptive Denoising: Using signals from dedicated motion sensors (see above) with algorithms like Kalman filtering to model and subtract motion artifacts from the EEG data [69].
- Advanced Correction Algorithms:
- For EEG-fMRI: Use Average Artifact Subtraction (AAS) and Optimal Basis Set (OBS) methods to remove gradient and pulse artifacts [69].
- Independent Component Analysis (ICA): A powerful blind source separation technique that decomposes EEG data into statistically independent components. Components identifiable as artifacts (e.g., blink, muscle, cardiac) can be removed before reconstructing the signal [69].
The following workflow outlines a proven denoising pipeline for challenging acquisition environments.
Diagram 2: A sequential denoising pipeline for EEG data, incorporating hardware and algorithmic corrections.
The Scientist's Toolkit: Essential Reagents and Materials
Table 2: Key Materials and Tools for Advanced EEG Research
| Item | Function / Application |
|---|---|
| High-Density EEG System (64+ channels) | Provides the necessary spatial sampling for source localization algorithms [70]. |
| Structural MRI Scan (T1-weighted) | Essential for building an accurate, subject-specific head model to solve the forward problem [70]. |
| 3D Electrode Digitizer | Precisely co-registers the 3D location of EEG electrodes with the subject's head model [70]. |
| Electrode Cap with Integrated Motion Sensors | Modified cap with piezoelectric transducers, carbon wire loops, or a reference layer to record motion artifacts independently [69]. |
| Auxiliary Biosignal Recorders (ECG, EOG, EMG) | Records electrocardiogram, electrooculogram, and electromyogram to aid in identifying and removing physiological artifacts. |
| Source Imaging Software (e.g., Cartool, BrainStorm, FieldTrip, BESA) | Academic or commercial software packages implementing forward modeling and various inverse solution algorithms (see Table 1) [70]. |
| Independent Component Analysis (ICA) Toolbox | Software package (e.g., in EEGLAB) for separating and removing artifactual components from EEG data [69]. |
Contextualizing EEG: A Tri-Modal Comparison with fMRI and fNIRS
EEG is best understood in relation to other major non-invasive brain imaging techniques. The table below provides a comparative summary of EEG, fMRI, and fNIRS.
Table 3: Quantitative Comparison of Non-Invasive Neuroimaging Modalities
| Feature | EEG | fMRI | fNIRS |
|---|---|---|---|
| What It Measures | Direct neuronal electrical activity [66] [67] | Hemodynamic response (BOLD signal) [2] [3] | Hemodynamic response (HbO/HbR concentration) [2] [67] |
| Temporal Resolution | Very High (milliseconds) [2] [66] | Low (seconds) [2] [3] | Moderate (seconds) [2] [67] |
| Spatial Resolution | Low (5-9 cm) [68] | Very High (millimeters) [2] [3] | Moderate (centimeters) [2] [67] |
| Penetration/Depth | Cortical surface, sensitive to superficial and deep sources (though blurred) [67] | Whole brain [3] | Outer cortex (~1-2.5 cm) [3] [67] |
| Sensitivity to Motion Artifacts | High [69] [67] | High [3] | Low to Moderate [3] [67] |
| Portability | High (wearable systems available) [66] [67] | Low (requires scanner) [3] | High (wearable systems available) [3] [67] |
| Cost | Relatively Low [67] | Very High [2] [3] | Moderate [3] |
| Primary Artifact Sources | Ocular, muscle, cardiac, motion, environmental noise [2] [69] | Motion, physiological noise (respiration, pulse) [3] | Superficial scalp blood flow, systemic physiology [71] |
The Rationale for Multimodal Integration
The technical properties of EEG, fMRI, and fNIRS are complementary. This has motivated the development of multimodal integration, particularly between EEG and fNIRS [72] [66].
- EEG-fNIRS Integration: This combination is powerful because it concurrently captures the brain's electrical (EEG) and hemodynamic/metabolic (fNIRS) responses, which are linked via neurovascular coupling [66]. It overcomes the limitation of using either modality alone by providing high temporal resolution (from EEG) and improved spatial resolution (from fNIRS) in a single experimental setup [72] [66]. This approach is valuable in brain-computer interfaces, cognitive neuroscience, and clinical monitoring [72].
The challenges of low spatial resolution and high artifact sensitivity in EEG are significant but not insurmountable. Through the rigorous application of advanced techniques—including high-density electrode arrays, individualized head modeling, sophisticated source imaging algorithms like weighted minimum norm estimates, and robust denoising pipelines incorporating hardware solutions and ICA—researchers can effectively mitigate these limitations. When EEG's unparalleled temporal resolution is combined with the spatial strengths of other modalities like fNIRS in a multimodal framework, it becomes an even more powerful tool for unraveling the complexities of brain function in health and disease.
Functional Near-Infrared Spectroscopy (fNIRS) has emerged as a prominent neuroimaging technique, offering a portable and flexible alternative to traditional methods like functional Magnetic Resonance Imaging (fMRI) and Electroencephalography (EEG). Its ability to measure cortical hemodynamics in naturalistic settings has expanded the scope of brain research into real-world environments. However, the utility of fNIRS is fundamentally bounded by two inherent physical constraints: its sensitivity is limited to superficial cortical structures, and its spatial resolution is lower than that of fMRI. This technical guide provides an in-depth examination of these core limitations, situating fNIRS within the broader neuroimaging landscape and detailing advanced methodologies researchers employ to navigate these challenges. By understanding and mitigating these constraints, scientists can more effectively leverage fNIRS in both basic research and clinical applications, including drug development where monitoring cortical treatment responses is valuable.
Core Technical Limitations of fNIRS in Neuroimaging
The operational principles of fNIRS, while enabling its portability, directly dictate its primary technical constraints. A clear grasp of these limitations is essential for appropriate experimental design and data interpretation.
Superficial Depth Sensitivity
fNIRS utilizes near-infrared light (650-950 nm) to measure changes in oxygenated (HbO) and deoxygenated hemoglobin (HbR) concentrations [17] [50]. As this light travels through the scalp, skull, and brain tissue, it is scattered and absorbed, confining measurable signals to the brain's outer layers.
- Penetration Depth: fNIRS signals typically originate from cortical regions up to 1.5 to 2.5 centimeters beneath the scalp [73] [3]. This shallow penetration is a direct result of the intense scattering and absorption of light by biological tissues.
- Inaccessible Regions: Crucially, this limitation renders fNIRS unsuitable for investigating subcortical structures such as the hippocampus, amygdala, and thalamus [17] [50]. These deeper areas are known to be critical for memory, emotion, and other high-order functions, and are often a focus in psychiatric and neurological drug development.
Spatial Resolution Limitations
The spatial resolution of a neuroimaging technique defines its ability to distinguish between two adjacent neural activity foci.
- Resolution Range: fNIRS typically achieves a spatial resolution of 1 to 3 centimeters [17] [73]. This is sufficient to differentiate broad activation in regions like the prefrontal cortex from motor cortex activity but is inadequate for discerning fine-grained functional specialization within a single gyrus.
- Comparative Deficit: This resolution is coarser than that of fMRI, which provides millimeter-level precision, but is generally superior to the spatial resolution offered by EEG [3] [74]. The following table provides a quantitative comparison of fNIRS against fMRI and EEG across key parameters.
Table 1: Quantitative Comparison of fMRI, fNIRS, and EEG Neuroimaging Modalities
| Feature | fMRI | fNIRS | EEG |
|---|---|---|---|
| Spatial Resolution | High (1-3 mm) [17] | Moderate (1-3 cm) [17] [73] | Low (Centimeter-level) [74] |
| Temporal Resolution | Low (0.3-2 Hz) [17] [75] | Moderate (~10 Hz) [75] [76] | High (Milliseconds) [74] |
| Depth Sensitivity | Whole-brain (Cortical & Subcortical) [17] | Superficial Cortex (up to ~2.5 cm) [73] [3] | Cortical Surface [74] |
| Portability | No (Fixed Scanner) | Yes (Wearable Systems) [73] [77] | Yes (Wearable Systems) [74] |
| Tolerance to Motion | Low | Moderate to High [3] [77] | Low [74] |
| Primary Signal | BOLD (Δ[HbR]) [3] | Hemodynamic (Δ[HbO] & Δ[HbR]) [17] | Electrical Potentials [74] |
Methodological Strategies to Mitigate fNIRS Constraints
Researchers have developed sophisticated methodological approaches to compensate for the inherent limitations of fNIRS, enhancing the validity and interpretability of its data.
Improving Spatial Specificity
Accurate spatial localization is challenging due to limited head coverage and variability in optode placement [75] [76]. The following workflow outlines a standard protocol for enhancing spatial specificity.
Diagram 1: Workflow for enhancing fNIRS spatial specificity through co-registration.
- 3D Digitization and Co-registration: The positions of optodes on the subject's head are digitally mapped using a 3D digitizer. These positions are then co-registered with a standardized brain atlas or, ideally, the subject's own anatomical MRI scan [75] [3]. This process ensures that the measured signals are accurately assigned to their underlying anatomical structures.
- Experimental Protocol for Validation: A standard motor task (e.g., finger tapping) can be used to validate the fNIRS setup. The protocol involves:
- Setup: Placing fNIRS optodes over the primary motor cortex (M1) contralateral to the hand performing the task, guided by the international 10-20 system.
- Task Design: A block design (e.g., 30s rest, 30s task, repeated 5 times) is optimal for capturing the hemodynamic response.
- Validation: Successful activation in the expected M1 region confirms correct targeting and system function [3].
Multimodal Integration with fMRI
Combining fNIRS with fMRI creates a powerful synergistic approach that leverages the high spatial resolution of fMRI and the portability and higher temporal resolution of fNIRS [17] [50]. The logical relationship between the two modalities is shown below.
Diagram 2: Logical relationship of fMRI and fNIRS multimodal integration.
- Synchronous and Asynchronous Modes: Integration can be achieved through simultaneous (synchronous) data acquisition or separate (asynchronous) sessions [17] [50].
- Synchronous Protocol: Subjects perform tasks inside the MRI scanner while wearing MRI-compatible fNIRS probes. This allows for direct correlation of the fMRI BOLD signal with fNIRS-measured HbO and HbR concentrations, validating fNIRS signals against the gold-standard fMRI [17].
- Asynchronous Protocol: The same task is performed in different environments—first in the MRI scanner for precise localization, and then with fNIRS in a naturalistic setting. This uses fMRI findings to inform the interpretation of fNIRS data collected outside the lab [17].
- Data Fusion: Advanced computational techniques, including machine learning and joint Independent Component Analysis (jICA), are used to fuse the datasets, creating a more comprehensive spatiotemporal model of brain activity [17] [74].
Essential Research Toolkit for fNIRS Studies
The following table details key reagents, software, and hardware solutions essential for conducting rigorous fNIRS research, particularly studies aimed at mitigating its core constraints.
Table 2: Research Reagent Solutions and Essential Materials for fNIRS Studies
| Item Name | Category | Function & Application |
|---|---|---|
| High-Density fNIRS System | Hardware | Systems with >32 channels provide greater cortical coverage and improve spatial sampling, aiding in better localization of activity [78]. |
| MRI-Compatible fNIRS Probes | Hardware | Allow for simultaneous fNIRS-fMRI data acquisition, which is crucial for validating fNIRS signals and investigating neurovascular coupling [17] [50]. |
| 3D Digitizer | Hardware | Precisely records the 3D locations of optodes on the subject's head relative to anatomical landmarks, which is a critical step for co-registration [75]. |
| Anatomical Atlas Software | Software | Software like AtlasViewer uses digitized optode positions to map measurement channels onto standard brain anatomy, providing anatomical context for fNIRS signals [3]. |
| Motion Correction Algorithms | Software | Algorithms (e.g., based on accelerometer data or signal processing) are applied during data preprocessing to mitigate the impact of movement artifacts, which is vital for data quality in mobile studies [75] [77]. |
The constraints of superficial depth sensitivity and moderate spatial resolution are inherent to fNIRS technology. However, they are not prohibitive. Through meticulous experimental design, the adoption of co-registration and 3D digitization techniques, and the strategic use of multimodal integration with fMRI, researchers can effectively navigate these limitations. fNIRS occupies a unique and vital niche in the neuroimaging toolkit, complementing fMRI and EEG by enabling the study of brain function in real-world, dynamic contexts that are inaccessible to other modalities. For the drug development community, fNIRS presents a viable tool for monitoring treatment-induced cortical hemodynamic changes in clinical trials, provided its technical boundaries are respected and its data is interpreted within the correct anatomical framework.
Optimizing Experimental Design for Movement, Population, and Ecological Validity
Selecting the optimal functional neuroimaging modality requires navigating a fundamental trade-off between spatial resolution, temporal resolution, and ecological validity. While functional magnetic resonance imaging (fMRI) has long been considered the gold standard for spatial localization, its practical limitations in studying moving participants, sensitive populations, and real-world contexts have accelerated the adoption of complementary technologies like electroencephalography (EEG) and functional near-infrared spectroscopy (fNIRS). Understanding the technical specifications, advantages, and constraints of each technique is paramount for designing robust experiments that balance methodological rigor with ecological validity. This technical guide provides a comprehensive comparison of fMRI, EEG, and fNIRS to inform researchers and drug development professionals in selecting and optimizing neuroimaging approaches for studies requiring movement, diverse populations, and naturalistic settings.
Technical Specifications and Comparative Analysis
Core Technical Principles
fMRI measures brain activity indirectly through the blood-oxygen-level-dependent (BOLD) contrast, which detects magnetic differences between oxygenated and deoxygenated hemoglobin [17] [79]. This technique provides high-resolution spatial mapping of both cortical and subcortical brain regions.
EEG records electrical potentials generated by synchronized neuronal activity via electrodes placed on the scalp [15] [80]. It directly measures neural transmission with millisecond temporal precision but offers limited spatial resolution.
fNIRS utilizes near-infrared light (650-950 nm) to measure hemodynamic responses by detecting concentration changes in oxygenated (HbO) and deoxygenated hemoglobin (HbR) in superficial cortical layers [17] [35]. Like fMRI, it relies on neurovascular coupling but offers greater portability.
Quantitative Comparison of Modality Capabilities
Table 1: Comprehensive technical comparison of fMRI, EEG, and fNIRS
| Parameter | fMRI | EEG | fNIRS |
|---|---|---|---|
| Spatial Resolution | High (mm to sub-mm) [35] | Low (cm-level, source localization challenges) [80] [35] | Moderate (1-3 cm) [17] [35] |
| Temporal Resolution | Moderate (seconds, 0.33-2 Hz) [17] [35] | Very High (milliseconds) [80] [35] | High (0.1-10 Hz) [35] |
| Depth of Measurement | Whole brain (cortical & subcortical) [17] | Cortical surface [80] | Outer cortex (~1-2.5 cm deep) [17] [80] |
| Portability | Low (fixed scanner) [3] [35] | Moderate to High (wearable systems available) [80] | High (portable/wearable formats) [3] [35] |
| Motion Tolerance | Low (highly sensitive to motion) [3] [35] | Moderate (susceptible to movement artifacts) [80] | High (relatively robust to motion) [3] [35] |
| Population Flexibility | Limited (claustrophobia, metal implants) [3] | High (suitable for most populations) | High (ideal for infants, children, clinical populations) [3] [35] |
| Environmental Constraints | Strict (scanner environment, noise) [3] [79] | Moderate (controlled lab preferred) | Low (naturalistic settings, field studies) [17] [3] |
| Cost | High (equipment & maintenance) [3] [35] | Generally Lower [80] | Low to Moderate [3] [35] |
Table 2: Optimal application scenarios for each modality
| Research Context | Recommended Modality | Rationale |
|---|---|---|
| Precise spatial localization | fMRI | Unmatched spatial resolution for deep brain structures [17] |
| Rapid neural dynamics | EEG | Millisecond precision for tracking neural transmission [80] |
| Naturalistic settings with movement | fNIRS | Portable with high motion tolerance [17] [3] |
| Sensitive populations (infants, elderly) | fNIRS > EEG | Minimal restraint, comfort, motion tolerance [3] [35] |
| Long-duration monitoring | fNIRS > EEG | Comfort, reduced fatigue, fewer artifacts [35] |
| Whole-brain network mapping | fMRI | Comprehensive coverage of cortical and subcortical regions [17] |
| Real-time neurofeedback | EEG > fNIRS | Superior temporal resolution for immediate feedback [80] |
| Clinical bedside monitoring | fNIRS | Portable, robust, suitable for diverse patient states [35] |
Signaling Pathways and Physiological Foundations
Neural-Hemodynamic Coupling in fMRI and fNIRS
The fMRI and fNIRS signals both originate from neurovascular coupling but are detected through different physical principles. Increased neural activity triggers higher metabolic demands, leading to a hemodynamic response that increases cerebral blood flow (CBF) [79]. This results in increased oxygenated hemoglobin (HbO) and decreased deoxygenated hemoglobin (HbR) in active regions. fMRI detects these changes through magnetic susceptibility differences, while fNIRS measures them via light absorption characteristics [3]. The hemodynamic response typically lags behind neural activity by 4-6 seconds, constraining the temporal resolution of both techniques [17].
Electrophysiological Basis of EEG
EEG signals originate from post-synaptic potentials of pyramidal neurons in the cerebral cortex. When large populations of these neurons fire synchronously, they create current dipoles that propagate through various tissues (meninges, skull, scalp) via volume conduction [15] [80]. The resulting electrical potentials at the scalp surface are measured by EEG electrodes in specific frequency bands that correlate with different brain states: delta (0.5-4 Hz) for deep sleep, theta (4-7 Hz) for memory and emotion, alpha (8-12 Hz) for relaxed wakefulness, beta (13-30 Hz) for active concentration, and gamma (30-150 Hz) for demanding cognitive tasks [15].
Experimental Design Considerations
Optimizing for Movement and Naturalistic Behavior
Traditional fMRI imposes severe movement restrictions that limit ecological validity. For studies requiring movement or naturalistic behaviors, fNIRS provides a superior alternative with comparable hemodynamic measurement to fMRI but greater movement tolerance [3]. EEG also allows some movement, though it remains more susceptible to motion artifacts than fNIRS [80].
Recommended Protocols for Movement Studies:
fNIRS for Gross Motor Activities: Utilize portable fNIRS systems for studies involving walking [15], rehabilitation exercises [17], or sports performance [80]. Ensure secure optode placement with customized headgear to maintain contact during movement.
EEG for Controlled Motion Tasks: Implement high-density EEG with motion artifact correction algorithms for studies requiring limited movement, such as reaching tasks or response to moving stimuli.
Multimodal fNIRS-EEG for Comprehensive Assessment: Combine fNIRS and EEG using integrated caps [48] to simultaneously capture electrophysiological and hemodynamic responses during naturalistic behaviors.
Adapting for Diverse Populations
Sensitive populations including infants, children, elderly individuals, and clinical groups often cannot tolerate fMRI constraints. fNIRS demonstrates particular strength in these populations due to its comfort, quiet operation, and tolerance for limited compliance [3] [35].
Population-Specific Methodologies:
Pediatric Studies: Use fNIRS with flexible, comfortable headgear for infant and child studies [3]. The quiet operation prevents distress, and natural interaction with caregivers during measurement improves ecological validity.
Clinical Populations: Implement fNIRS for psychiatric populations (e.g., schizophrenia [35]), neurological patients, and individuals with movement disorders who cannot remain still for fMRI. Bedside monitoring enables longitudinal assessment of treatment response.
Elderly Participants: Utilize fNIRS for cognitive assessment in aging populations, minimizing discomfort and movement restrictions that might confound fMRI results.
Enhancing Ecological Validity
Ecological validity refers to how well experimental findings generalize to real-world situations. The artificial fMRI environment significantly constrains ecological validity, while fNIRS and EEG enable more naturalistic experimental settings.
Ecological Validity Protocols:
Naturalistic Stimulus Presentation: Use fNIRS or EEG in environments that approximate real-world contexts (classrooms, homes, simulated driving conditions) [80].
Social Interaction Paradigms: Implement fNIRS hyperscanning (simultaneous measurement of multiple individuals) to study real-time social interactions [17].
Long-Duration Monitoring: Leverage fNIRS comfort for extended monitoring sessions that capture brain activity during authentic tasks and behaviors.
Multimodal Integration Approaches
Experimental Workflow for Combined fNIRS-EEG
Combining fNIRS and EEG creates a powerful multimodal approach that compensates for the limitations of each individual technique. The integration captures both the electrical neural activity (via EEG) and the hemodynamic response (via fNIRS), providing a more complete picture of brain function [48]. Successful integration requires careful hardware configuration, synchronization, and specialized data fusion techniques.
Integration Methodologies:
Hardware Configuration: Use integrated caps with pre-defined fNIRS-compatible openings for EEG electrodes [80]. Custom 3D-printed helmets offer optimal fit but at higher cost [48].
Synchronization Approaches: Implement unified processor systems for simultaneous acquisition with precise temporal alignment [48]. External hardware triggers (TTL pulses) can synchronize separate systems.
Data Fusion Techniques: Apply joint Independent Component Analysis (jICA), canonical correlation analysis (CCA), or machine learning approaches to combine feature sets from both modalities [80].
Validating fNIRS with fMRI
For establishing fNIRS validity and improving its spatial specificity, simultaneous or sequential fMRI-fNIRS studies provide crucial validation. The high spatial resolution of fMRI helps interpret fNIRS signals and develop algorithms to infer deeper brain activity from cortical fNIRS measurements [17] [50].
Validation Protocols:
Synchronous fMRI-fNIRS Acquisition: Use MRI-compatible fNIRS hardware [17] to simultaneously collect both datasets, enabling direct correlation of hemodynamic responses.
Asynchronous Paradigms: Conduct the same experimental tasks in both environments sequentially, with careful maintenance of task parameters and timing.
Cross-Modal Correlation Analysis: Calculate spatial and temporal correlation coefficients between fNIRS HbO/HbR concentrations and fMRI BOLD signals to establish validity [3].
The Scientist's Toolkit: Essential Research Materials
Table 3: Essential equipment and solutions for multimodal neuroimaging research
| Item | Function/Purpose | Technical Specifications |
|---|---|---|
| High-Density fNIRS System | Measures cortical hemodynamics with multiple source-detector pairs | 650-950 nm wavelengths, 10+ Hz sampling rate, 30 mm optode separation [35] |
| EEG Acquisition System | Records electrical brain activity with millisecond precision | 32+ channels, 1000+ Hz sampling rate, low impedance (<10 kΩ) [15] |
| Integrated fNIRS-EEG Cap | Enables simultaneous multimodal acquisition | 10-20 system placement, fNIRS-compatible EEG electrode openings [80] [48] |
| 3D Digitization System | Records precise sensor locations for source reconstruction | Spatial accuracy <5 mm, compatibility with head model reconstruction [39] |
| MRI-Compatible fNIRS | Enables simultaneous fMRI-fNIRS acquisition | Non-magnetic materials, fiber-optic extension to control room [17] |
| Portable/wearable fNIRS | Enables mobile brain imaging in naturalistic settings | Wireless operation, battery-powered, motion artifact robustness [3] |
| Signal Processing Software | Preprocessing, artifact removal, and data fusion | Motion correction algorithms, physiological noise removal, joint ICA [80] [35] |
Optimizing experimental design for movement, diverse populations, and ecological validity requires careful matching of research questions to appropriate neuroimaging technologies. While fMRI remains unparalleled for precise spatial localization of deep brain structures, fNIRS offers superior flexibility for naturalistic settings, movement paradigms, and sensitive populations. EEG provides unmatched temporal resolution for capturing rapid neural dynamics. The emerging trend toward multimodal integration, particularly combining fNIRS and EEG, represents the most promising approach for comprehensive brain mapping that balances spatial and temporal resolution with ecological validity. By strategically selecting and combining these modalities based on specific research requirements, scientists and drug development professionals can design more robust, clinically relevant neuroimaging studies that bridge the gap between laboratory findings and real-world brain function.
The quest to understand the intricate functions of the human brain has driven the development of diverse neuroimaging technologies, each with unique strengths and limitations. Functional magnetic resonance imaging (fMRI), electroencephalography (EEG), and functional near-infrared spectroscopy (fNIRS) represent three prominent non-invasive techniques that capture complementary aspects of neural activity [17]. The integration of these modalities presents a powerful approach to overcome individual technical constraints, yet introduces significant complexities in data synchronization, fusion, and interpretation. This technical guide examines the core challenges and methodologies for combining fMRI, EEG, and fNIRS datasets within the framework of modern neuroscience research and drug development applications.
The fundamental motivation for multimodal integration stems from the complementary nature of the signals these techniques capture. fMRI measures blood oxygen level-dependent (BOLD) signals with high spatial resolution (millimeters) but limited temporal resolution (0.33-2 Hz) due to the slow hemodynamic response [17]. EEG records electrical activity from synchronized neuronal firing with exceptional temporal resolution (milliseconds) but poor spatial resolution due to signal dispersion through skull and scalp tissues [2] [66]. fNIRS occupies a middle ground, measuring hemodynamic responses similar to fMRI but with better temporal resolution (typically 2-10 Hz) and portability, though it is limited to cortical surface measurements [81] [3]. These technical characteristics make the modalities naturally complementary but introduce significant challenges for data fusion arising from their different spatial and temporal domains, physiological origins, and artifact profiles.
Fundamental Technical Characteristics of fMRI, EEG, and fNIRS
Core Physiological Principles and Measurement Techniques
fMRI operates on the principle of detecting changes in blood oxygenation related to neural activity. It leverages the different magnetic properties of oxygenated hemoglobin (diamagnetic) and deoxygenated hemoglobin (paramagnetic) [3] [9]. When neurons become active, localized changes in cerebral blood flow, volume, and oxygen consumption occur, leading to a surplus of oxygenated blood in active areas. This produces the BOLD signal contrast that fMRI detects, though it lags behind neural activity by 4-6 seconds due to the hemodynamic response delay [17].
EEG measures electrical potentials generated by the synchronized firing of populations of cortical pyramidal neurons. These post-synaptic potentials create electrical fields that propagate through the brain, cerebrospinal fluid, skull, and scalp, where they are detected by electrodes placed on the scalp surface [66] [21]. EEG signals are typically categorized into frequency bands that reflect different brain states: theta (4-7 Hz), alpha (8-14 Hz), beta (15-25 Hz), and gamma (>25 Hz) [66].
fNIRS utilizes near-infrared light (650-950 nm) to measure changes in hemoglobin concentrations in cortical tissue. Based on the modified Beer-Lambert law, fNIRS systems emit light at specific wavelengths and detect the attenuated light after it has passed through biological tissues [66] [9]. The differential absorption characteristics of oxygenated and deoxygenated hemoglobin allow calculation of relative concentration changes, providing hemodynamic measures similar to fMRI but with limited penetration depth (1-3 cm), restricting measurement to superficial cortical layers [17] [3].
Comparative Technical Specifications
Table 1: Technical comparison of fMRI, EEG, and fNIRS
| Parameter | fMRI | EEG | fNIRS |
|---|---|---|---|
| Spatial Resolution | High (millimeters) [2] | Low (centimeters) [2] [21] | Moderate (1-3 cm) [17] |
| Temporal Resolution | Low (0.33-2 Hz) [17] | High (milliseconds) [2] [66] | Moderate (0.1-10 Hz) [81] [66] |
| Penetration Depth | Whole brain (cortical and subcortical) [17] | Cortical surface [21] | Superficial cortex (1-2.5 cm) [17] [21] |
| Primary Signal | Hemodynamic (BOLD) [3] | Electrical activity [21] | Hemodynamic (HbO/HbR) [21] |
| Portability | Low (fixed scanner) [3] | High (wearable systems) [66] | High (wearable systems) [66] |
| Motion Tolerance | Low [3] | Low [21] | Moderate [21] |
| Measurement Environment | Restricted (scanner environment) [17] | Flexible (lab to real-world) [66] | Highly flexible (naturalistic settings) [17] [3] |
Methodological Framework for Multimodal Data Integration
Synchronization Approaches and Technical Considerations
Effective multimodal integration requires precise temporal synchronization across acquisition systems. The fundamental challenge lies in aligning data streams with vastly different temporal characteristics and physiological origins.
Hardware Synchronization represents the gold standard, utilizing shared trigger signals or master-clock systems to synchronize data acquisition across modalities. Integrated systems where EEG electrodes and fNIRS optodes are combined in a single cap facilitate this approach by providing a unified hardware platform [21]. For simultaneous fMRI-EEG recordings, specialized MRI-compatible EEG systems with synchronized clock signals are essential to account for gradient switching artifacts [17].
Software Synchronization methods employ post-hoc alignment using shared event markers or physiological signatures. This approach is commonly used when combining portable fNIRS-EEG systems in naturalistic environments [66]. The method involves recording timestamps for experimental events (stimulus onset, task periods) in both systems and aligning data streams during preprocessing. For enhanced precision, researchers can utilize physiological signatures (heart rate, respiration) captured by both systems as natural synchronisation points [66].
Experimental Design Considerations must account for the different temporal dynamics of each modality. Blocked designs with sustained task periods (≥10 seconds) are optimal for capturing the slow hemodynamic responses measured by fMRI and fNIRS, while event-related designs can leverage EEG's millisecond temporal resolution [81]. Hybrid designs that incorporate both extended task blocks and discrete events enable comprehensive capture of both hemodynamic and electrical responses.
Data Fusion Methodologies
Multimodal data fusion strategies exist at multiple levels of analysis, each with distinct advantages and implementation requirements.
Table 2: Data fusion approaches for multimodal neuroimaging
| Fusion Level | Description | Common Algorithms | Applications |
|---|---|---|---|
| Parallel Analysis | Independent analysis of each modality with subsequent comparison of results [66] | Statistical correlation, Joint visualization | Initial exploratory studies, Method validation |
| Feature-Level Fusion | Combining extracted features before model training [34] | Canonical Correlation Analysis (CCA), Mixed-effects models | Brain-Computer Interfaces, Cognitive state classification |
| Decision-Level Fusion | Combining outputs from modality-specific classifiers [34] | Dempster-Shafer Theory, Bayesian fusion | Clinical diagnostics, Motor imagery classification |
| Model-Based Fusion | Integrating data within a unified generative model [66] | Joint Independent Component Analysis (jICA), Dynamic Causal Modeling | Network connectivity analysis, Neurovascular coupling investigation |
EEG-informed fNIRS analysis leverages the superior temporal resolution of EEG to constrain the analysis of slower hemodynamic fNIRS signals. This approach is particularly valuable for identifying transient neural events that elicit hemodynamic responses [66]. For instance, event-related potentials (ERPs) captured by EEG can define precise time windows for analyzing hemoglobin concentration changes in fNIRS data.
fNIRS-informed EEG analysis utilizes the superior spatial resolution of fNIRS to guide source localization of EEG signals. The spatial constraints provided by fNIRS activation maps can significantly improve the accuracy of EEG inverse solutions [66]. This approach helps overcome EEG's inherent limitations in spatial resolution.
Deep Learning Approaches represent emerging methodologies for fNIRS-EEG fusion. Recent studies have demonstrated successful implementation of end-to-end fusion networks that extract spatiotemporal features from both modalities before decision-level integration using evidence theory frameworks [34]. These approaches have shown particular promise in motor imagery classification for brain-computer interfaces, achieving accuracy improvements of 3.78% over unimodal methods [34].
Experimental Protocols for Multimodal Studies
Simultaneous EEG-fNIRS Recording Protocol
Based on established methodologies from recent studies [81] [20], the following protocol outlines standardized procedures for concurrent EEG-fNIRS acquisition:
Participant Preparation and Sensor Placement: After obtaining informed consent, measure participant's head circumference and select appropriate EEG cap size. For integrated systems, use caps with pre-defined openings for fNIRS optodes. Position sensors according to the international 10-20 system, with EEG electrodes and fNIRS optodes arranged to minimize interference [21]. For EEG, apply conductive gel to achieve impedance values below 10 kΩ. For fNIRS, ensure optodes have proper skin contact without excessive pressure.
Hardware Configuration and Synchronization: Configure sampling rates appropriately for each modality (EEG: ≥200 Hz; fNIRS: ≥10 Hz) [81]. Establish hardware synchronization using shared TTL pulses or a master clock system. For software synchronization, implement parallel port triggers or network synchronization protocols to ensure precise timestamp alignment across systems [66].
Data Quality Assessment: Before main experiment, conduct brief quality checks. For EEG, verify signal quality across all channels, checking for excessive noise or artifacts. For fNIRS, assess signal-to-noise ratio using metrics like scalp-coupling index (SCI) and exclude channels with SCI <0.7 [81]. Monitor physiological parameters (heart rate, respiration) to ensure proper capture of physiological baselines.
Experimental Paradigm Execution: Implement appropriate experimental designs that accommodate the temporal characteristics of both modalities. For resting-state studies, acquire at least 5 minutes of eyes-open and eyes-closed conditions [81]. For task-based studies, incorporate adequate inter-trial intervals (≥15 seconds) to allow hemodynamic responses to return to baseline between trials [20].
Protocol for Structure-Function Relationship Investigation
Recent research has employed sophisticated protocols to investigate relationships between structural connectivity and functional networks [81]:
Structural Connectome Reconstruction: Acquire high-resolution T1-weighted anatomical images and diffusion tensor imaging (DTI) sequences. Reconstruct white matter fiber tracts using deterministic or probabilistic tracking algorithms. Map structural connectivity matrices using the Desikan-Killiany atlas or similar parcellation schemes [81].
Multimodal Functional Data Acquisition: Collect simultaneous EEG-fNIRS data during both resting-state and task conditions (e.g., motor imagery tasks). For EEG, utilize 30+ electrodes placed according to the international 10-5 system. For fNIRS, implement 30+ channels with source-detector distances of 30 mm to ensure adequate cortical penetration [81].
Data Coregistration and Analysis: Coregister functional data to structural templates using digitized sensor positions relative to standard scalp landmarks. Compute functional connectivity metrics for each modality: phase-based measures for EEG (e.g., phase locking value) and correlation-based measures for fNIRS. Employ graph signal processing frameworks to quantify structure-function coupling through measures like structural-decoupling index (SDI) [81].
Visualization of Multimodal Integration Workflows
Experimental Setup and Synchronization Diagram
Figure 1: Experimental setup and data synchronization workflow for concurrent EEG-fNIRS recording
Multimodal Data Fusion Pathways
Figure 2: Multimodal data fusion pathways and methodological approaches
The Scientist's Toolkit: Essential Research Reagents and Materials
Table 3: Essential materials and analytical tools for multimodal neuroimaging research
| Category | Item | Specification/Function |
|---|---|---|
| Hardware Components | EEG Recording System | 30+ electrodes, 1000+ Hz sampling rate, compatible amplifier [81] [20] |
| fNIRS Recording System | 30+ channels, dual wavelengths (760nm & 850nm), 10+ Hz sampling [81] | |
| Integrated EEG-fNIRS Caps | International 10-20/10-5 system compatibility, pre-defined optode openings [21] | |
| Synchronization Interface | TTL pulse generator, shared clock system, parallel port triggers [66] | |
| Software Tools | MNE-Python | EEG/fNIRS data preprocessing, source reconstruction, and visualization [81] |
| Brainstorm | User-friendly interface for multimodal data analysis and visualization [81] | |
| Homer2 | fNIRS-specific processing pipeline (optical density conversion, MBLL) [66] | |
| SPM | Statistical parametric mapping for population-level analysis | |
| Analytical Metrics | Scalp-Coupling Index (SCI) | fNIRS signal quality assessment (threshold: >0.7) [81] |
| Structural-Decoupling Index (SDI) | Quantifies structure-function relationship [81] | |
| Phase Locking Value | EEG functional connectivity measure [81] | |
| Cross-Modal Correlation | Quantifies EEG-fNIRS coupling strength [81] |
The synchronization and integration of multimodal neuroimaging datasets represents both a formidable challenge and tremendous opportunity in advancing brain research. The complementary nature of fMRI, EEG, and fNIRS data provides a more comprehensive window into brain function than any single modality can offer, but requires sophisticated methodological approaches to overcome inherent differences in temporal dynamics, spatial characteristics, and physiological origins.
Future developments in multimodal data fusion will likely be driven by advances in machine learning approaches, particularly deep learning architectures specifically designed for heterogeneous data integration [34]. Additionally, hardware innovations creating more truly integrated systems with built-in synchronization capabilities will reduce technical barriers to multimodal research [17]. Standardization of data formats, preprocessing pipelines, and validation metrics across research groups will be essential for translating these methodologies into clinical applications and pharmaceutical development.
For researchers embarking on multimodal studies, success depends on careful experimental design that accounts for the temporal and spatial limitations of each modality, implementation of robust synchronization protocols from the outset of data collection, and selection of appropriate fusion strategies matched to specific research questions. The methodological framework presented in this guide provides a foundation for addressing the complex but rewarding challenge of multimodal data integration in neuroimaging research.
Making an Informed Choice: A Direct Comparison and Validation Framework
Understanding the differences between non-invasive neuroimaging techniques is crucial for selecting the appropriate tool for neuroscience research and clinical applications. Functional Magnetic Resonance Imaging (fMRI), Electroencephalography (EEG), and functional Near-Infrared Spectroscopy (fNIRS) represent the most widely used technologies, each with distinct strengths and limitations stemming from their unique biological and physical principles. This whitepaper provides a direct technical comparison of these modalities, focusing on their spatial/temporal resolution, portability, cost, and optimal use cases. The content is framed within the context of selecting appropriate methodologies for brain research, particularly for researchers, scientists, and drug development professionals who require precise neuroimaging tools for their investigations. By synthesizing current scientific literature, this guide aims to facilitate informed decision-making in experimental design and technology implementation.
Core Technical Specifications and Comparison
Table 1: Direct comparison of fMRI, EEG, and fNIRS across key technical parameters
| Feature | fMRI | EEG | fNIRS |
|---|---|---|---|
| Spatial Resolution | High (millimeter-level) [50] | Low (centimeter-level) [82] | Moderate (1-3 cm) [50] |
| Temporal Resolution | Low (0.33-2 Hz, limited by hemodynamic response) [50] | Very High (milliseconds) [82] [66] | Moderate (seconds) [82] |
| Depth of Measurement | Whole brain (cortical and subcortical) [50] | Cortical surface [82] | Superficial cortex (1-2.5 cm) [50] [82] |
| Portability | Very Low (fixed, immobile scanner) [50] | High (wearable, wireless systems available) [82] | High (portable, wearable formats) [50] [82] |
| Cost | Very High (equipment and maintenance) | Generally Lower [82] | Generally Higher than EEG [82] |
| Tolerance to Motion Artifacts | Low [50] | Moderate to Low (susceptible) [82] | High (more tolerant) [82] |
| Primary Signal Measured | Blood Oxygenation Level Dependent (BOLD) [50] | Electrical potentials from synchronized neurons [66] | Hemodynamic changes (HbO and HbR) [50] |
| Best Use Cases | Detailed spatial mapping of deep brain structures, clinical diagnostics [50] | Fast cognitive tasks, ERPs, sleep studies, brain-computer interfaces [82] | Naturalistic studies, child development, rehabilitation, clinical monitoring [82] [27] |
The comparative analysis reveals a clear trade-off between spatial and temporal resolution across modalities. fMRI excels in spatial precision for deep brain structures but lacks the temporal fidelity to capture neural dynamics in real-time [50]. Conversely, EEG provides millisecond-level temporal resolution ideal for tracking rapid neural oscillations but offers limited spatial localization [82] [66]. fNIRS occupies a middle ground, with better spatial resolution than EEG for cortical areas and greater tolerance for movement than fMRI, making it suitable for more ecologically valid settings [50] [82]. The portability and cost factors further differentiate these technologies, with EEG and fNIRS offering more accessible platforms for field research and repeated testing, while fMRI remains the gold standard for high-precision anatomical and functional mapping in controlled environments.
Experimental Protocols for Multimodal Integration
Simultaneous fNIRS-EEG Recording Protocol
The integration of fNIRS and EEG leverages their complementary strengths, providing both electrophysiological and hemodynamic information from the same cortical regions [66]. A standardized protocol for simultaneous data acquisition is essential for data quality.
Apparatus and Setup: The experiment requires an fNIRS system with optodes (sources and detectors) and an EEG system with electrodes. A critical design consideration is the integration helmet, which can be a commercially available EEG cap with pre-defined fNIRS-compatible openings, a custom 3D-printed helmet, or one made from cryogenic thermoplastic sheet material for better fit [48]. The international 10-20 or 10-5 systems are typically used for sensor placement to ensure proper coverage and co-registration [39] [48].
Procedure:
- Participant Preparation: Measure the participant's head circumference and select an appropriately sized integration helmet. The participant is fitted with the combined fNIRS-EEG helmet. For EEG, electrolytic gel is applied to ensure good electrode-scalp contact and impedance is checked [82].
- Sensor Placement and Digitization: fNIRS optodes and EEG electrodes are positioned according to the experimental design targeting specific brain regions (e.g., sensorimotor and parietal cortices for Action Observation Network studies) [83]. After placement, the 3D coordinates of each fNIRS optode and key EEG electrodes are digitized relative to anatomical landmarks (nasion, inion, preauricular points) using a magnetic digitizer [83]. This step is crucial for subsequent spatial coregistration with anatomical templates.
- Synchronization and Data Acquisition: The fNIRS and EEG systems must be synchronized. This can be achieved via a unified processor that handles both data streams or by using external hardware triggers (e.g., TTL pulses) sent to both systems at the start of the experiment and task events [48] [66]. Data is then collected simultaneously throughout the experimental paradigm.
Data Processing and Fusion Workflow
Processing simultaneous fNIRS-EEG data involves modality-specific preprocessing followed by fusion analysis.
Preprocessing:
- fNIRS Processing: Raw light intensity signals are converted to optical density and then to concentration changes of oxygenated (HbO) and deoxygenated hemoglobin (HbR) using the Modified Beer-Lambert Law [84] [66]. Data is bandpass filtered (e.g., 0.01-0.1 Hz) to remove physiological noise like cardiac and respiratory cycles. Motion artifacts are identified and corrected using algorithms such as based on the global variance in temporal derivative (GVTD) or principal component analysis (PCA) to remove components associated with superficial scalp blood flow [39].
- EEG Processing: Data is filtered (e.g., 0.5-40 Hz for ERPs), and bad channels are identified and interpolated. Major artifacts, including eye blinks and muscle activity, are removed using techniques like Independent Component Analysis (ICA) [66].
Data Fusion: After preprocessing, the neural electrical (EEG) and hemodynamic (fNIRS) features are integrated. Common fusion techniques include:
- Structured Sparse Multiset Canonical Correlation Analysis (ssmCCA): This method identifies underlying components that are maximally correlated between the two modalities, helping to pinpoint brain regions consistently activated in both electrical and hemodynamic domains [83].
- Joint Independent Component Analysis (jICA): This technique assumes that the fused data is a linear mixture of independent sources, which are simultaneously estimated from both modalities [82].
- Classifier-based Fusion: Features from both EEG (e.g., band power, ERPs) and fNIRS (e.g., HbO/HbR slopes) are extracted and combined into a single feature vector to train a machine learning model for tasks like brain-computer interface (BCI) control or mental state classification [85].
The following workflow diagram illustrates the sequential steps for simultaneous fNIRS-EEG data acquisition and analysis:
Diagram 1: Workflow for simultaneous fNIRS-EEG acquisition and analysis.
Signaling Pathways and Neurovascular Coupling
The physiological basis for correlating EEG and fNIRS signals lies in the principle of neurovascular coupling. This mechanism describes the tight temporal and regional relationship between neural electrical activity and subsequent changes in cerebral blood flow [66].
When a population of neurons becomes active, it triggers a complex biochemical cascade. This process begins with neuronal firing, which is directly measured by EEG as fluctuations in electrical potentials on the millisecond scale [66]. This electrical activity leads to an increased demand for energy (oxygen and glucose). To meet this demand, local cerebral blood flow (CBF) increases, a process known as the hemodynamic response. This increased blood flow delivers more oxygenated hemoglobin (HbO) than is consumed, resulting in a local increase in HbO and a decrease in deoxygenated hemoglobin (HbR) in the capillary and venous beds [50] [66]. These hemodynamic changes are measured by fNIRS (and fMRI), but because they rely on blood flow changes, they occur on a much slower timescale (seconds) than the initial electrical event.
The following diagram illustrates this coordinated signaling pathway:
Diagram 2: Neurovascular coupling linking neural activity to measurable signals.
The Scientist's Toolkit: Research Reagent Solutions
Table 2: Essential materials and equipment for simultaneous fNIRS-EEG research
| Item Category | Specific Examples & Functions |
|---|---|
| Core Acquisition Hardware | - fNIRS System: Continuous-wave (CW) systems (e.g., Hitachi ETG-4100) using LEDs/lasers at specific wavelengths (e.g., 695 nm & 830 nm; 760 nm & 850 nm) to measure HbO/HbR changes [83] [66].- EEG System: High-density amplifier systems (e.g., 128-channel Electrical Geodesics system) with electrodes to measure scalp electrical potentials [83]. |
| Integration Apparatus | - Combined Helmet/Cap: An elastic cap with integrated fNIRS optode holders and EEG electrodes, or a custom-fabricated helmet using 3D printing or cryogenic thermoplastic for a precise fit [48]. |
| Synchronization Tools | - Hardware Triggers: TTL pulse generators or parallel ports to send event markers simultaneously to both fNIRS and EEG acquisition computers [82] [66].- Unified Processor: A single central unit that simultaneously acquires and processes both fNIRS and EEG data streams [48]. |
| Localization Equipment | - 3D Magnetic Digitizer: Device (e.g., Polhemus Fastrak) to record the precise 3D spatial coordinates of fNIRS optodes and EEG electrodes relative to anatomical head landmarks (nasion, inion) [83]. This is critical for coregistration with brain anatomy. |
| Data Processing Software | - Analysis Tools: Software platforms (e.g., MNE, Brainstorm) for preprocessing, analyzing, and fusing multimodal datasets [39].- Custom Scripts: For implementing advanced fusion algorithms like ssmCCA [83] or deep learning models for data augmentation and classification [85]. |
This toolkit encompasses the fundamental components required to establish a robust simultaneous fNIRS-EEG recording setup. The emphasis on co-registration and synchronization tools highlights the critical technical challenges in multimodal imaging, ensuring that the collected data is spatially aligned and temporally precise for valid integrated analysis.
Functional magnetic resonance imaging (fMRI) is widely regarded as the gold standard for in vivo brain imaging due to its high spatial resolution and whole-brain coverage. This whitepaper examines the critical role of fMRI in cross-validation studies for two other prominent neuroimaging modalities: functional near-infrared spectroscopy (fNIRS) and electroencephalography (EEG). We synthesize methodological frameworks from contemporary research, provide detailed experimental protocols for validation studies, and present quantitative comparisons of technical parameters. The analysis confirms that while fNIRS and EEG offer distinct advantages in temporal resolution, portability, and cost-effectiveness, fMRI provides an essential benchmark for validating their spatial accuracy and functional specificity, particularly in clinical and cognitive neuroscience applications.
Understanding the complex functions of the human brain requires multimodal approaches that integrate complementary neuroimaging techniques. Among non-invasive modalities, fMRI, fNIRS, and EEG represent a powerful triad for investigating brain function, each with distinct strengths and limitations. fMRI is considered the gold standard for spatial localization of brain activity, providing high-resolution images of both cortical and subcortical structures [50] [17]. fNIRS and EEG offer superior temporal resolution and significantly greater flexibility for studying brain function in naturalistic settings [2] [3].
Cross-validation studies utilizing fMRI as a reference standard have become essential for establishing the validity and reliability of fNIRS and EEG measurements. This validation is particularly crucial for clinical applications and cognitive neuroscience research, where accurate spatial localization of neural activity is often paramount. The convergence of findings across modalities strengthens the theoretical foundations of brain mapping and enables researchers to select the most appropriate tools for specific investigative contexts [50] [17].
Technical Comparison of Neuroimaging Modalities
Core Principles and Measurement Techniques
fMRI measures brain activity indirectly through the blood-oxygen-level-dependent (BOLD) signal, which detects changes in blood flow and oxygenation related to neural activity. It provides high spatial resolution (millimeter-level) images of brain activity throughout the entire brain, including deep structures [2] [50]. However, its temporal resolution is limited by the hemodynamic response, which typically lags behind neural activity by 4-6 seconds [50].
fNIRS similarly measures hemodynamic responses by utilizing near-infrared light to measure changes in oxygenated hemoglobin (HbO) and deoxygenated hemoglobin (HbR) concentrations on the cortical surface [2] [3]. This provides an indirect measure of neural activity with superior temporal resolution compared to fMRI, but limited to superficial cortical regions (approximately 15mm depth) with spatial resolution on the order of centimeters [2].
EEG measures the electrical activity of the cortex generated by the synchronized firing of neurons in real-time with millisecond temporal resolution [2] [15]. However, its spatial resolution is relatively low due to distortion that occurs when electrical signals pass through the skull and scalp, typically providing resolution on the order of centimeters [2].
Comprehensive Technical Specifications
Table 1: Technical comparison of fMRI, fNIRS, and EEG
| Parameter | fMRI | fNIRS | EEG |
|---|---|---|---|
| Spatial Resolution | Millimeters (whole-brain) [50] | 1-3 cm (cortical only) [50] | Centimeters (limited below cortical surface) [86] |
| Temporal Resolution | 1-5 seconds [86] | 100s of milliseconds [2] | Milliseconds [2] [86] |
| Penetration Depth | Full brain (cortical & subcortical) [50] | ~15mm (superficial cortex) [2] | Cortical surface [2] |
| Measurement Type | BOLD signal (hemodynamic) [3] | HbO/HbR concentration (hemodynamic) [3] | Electrical activity [15] |
| Portability | Fixed installation [3] [86] | Portable to fully mobile [3] | Mobile systems available [86] |
| Cost per Session | $1000+ [2] | Moderate (one-time investment) [3] | Low [86] |
| Setup Time | Lengthy (30+ minutes) [3] | Minutes [2] [3] | Time-consuming (electrode placement) [86] |
| Sensitivity to Movement | High [50] [3] | Low to moderate [3] [86] | Moderate [86] |
Table 2: Advantages and limitations for cross-validation studies
| Modality | Advantages for Validation | Limitations for Validation |
|---|---|---|
| fMRI (Reference) | High spatial resolution; Whole-brain coverage; Established methodology [50] [17] | Expensive; Low temporal resolution; Restricted environment [50] |
| fNIRS (Validation Target) | Portable; Cost-effective; Better temporal resolution than fMRI; Tolerates movement [3] [87] | Limited to cortical regions; Lower spatial resolution; Lack of anatomical information [3] |
| EEG (Validation Target) | Excellent temporal resolution; Low cost; Direct neural electrical activity measurement [15] | Poor spatial resolution; Sensitivity to non-neural artifacts; Skull conductivity distortions [2] |
Methodological Frameworks for Cross-Validation
fMRI-fNIRS Validation Paradigms
The integration of fMRI and fNIRS capitalizes on their complementary strengths—fMRI's high spatial resolution and fNIRS's temporal precision and operational flexibility [50] [17]. Validation studies typically employ two primary approaches: synchronous data acquisition (simultaneous recording) and asynchronous acquisition (separate sessions with identical paradigms) [50].
Synchronous acquisition requires specialized hardware solutions to mitigate electromagnetic interference in the MRI environment [50] [17]. This approach enables direct comparison of hemodynamic responses from both modalities with identical neural activation patterns, providing the most robust validation framework. Asynchronous acquisition involves conducting similar experimental paradigms in separate sessions, which simplifies technical requirements but introduces potential variability in neural responses across sessions [87].
Key validation metrics include spatial correspondence of activated regions, correlation of hemodynamic response functions, and consistency in detecting task-related changes in brain activity [87]. For fNIRS, both oxygenated (Δ[HbO]) and deoxygenated (Δ[HbR]) hemoglobin signals are compared with the fMRI BOLD response, which primarily reflects changes in deoxygenated hemoglobin [87].
fMRI-EEG Validation Approaches
Validating EEG against fMRI presents greater methodological challenges due to their fundamentally different physiological measures—electrical activity versus hemodynamic response [15] [39]. The neurovascular coupling relationship forms the theoretical basis for comparing these modalities, positing that electrical neural activity triggers subsequent hemodynamic changes [15].
Advanced analytical approaches include:
- Source localization: Estimating the cortical origins of EEG signals and comparing these with fMRI activation maps [15]
- Functional connectivity: Comparing network properties derived from both modalities during rest and task conditions [88] [39]
- Multimodal integration: Simultaneously recording EEG and fMRI to directly capture the relationship between electrical and hemodynamic activities [39]
Quantitative EEG parameters such as power ratio index (PRI), brain symmetry index (BSI), and phase synchrony index have been validated against fMRI metrics for assessing motor recovery after stroke, demonstrating the clinical utility of cross-modal validation [15].
Experimental Protocols for Validation Studies
Protocol 1: Motor Task Validation
Motor tasks provide robust, replicable activation patterns ideal for cross-validation studies. The following protocol is adapted from Klein et al. (2022), which validated fNIRS measurements of supplementary motor area (SMA) activation against fMRI [87].
Experimental Design:
- Participants: 16-20 healthy adults (older adults preferred for clinical relevance)
- Tasks:
- Motor execution: Actual hand movements (left and right)
- Motor imagery: Imagined hand movements (left and right)
- Motor imagery of whole-body movements
- Paradigm: Block design with 30-second blocks (20-second rest, 10-second task)
- Session Structure: Separate fNIRS and fMRI sessions conducted on different days
Data Acquisition Parameters:
- fMRI: 3T scanner, T2*-weighted EPI sequence, TR=2000ms, TE=30ms, voxel size=3×3×3mm³
- fNIRS: Continuous-wave system, 760nm and 850nm wavelengths, sampling rate=10Hz, optodes positioned over SMA according to 10-20 system
Analysis Pipeline:
- Preprocessing (motion correction, filtering)
- General Linear Model (GLM) analysis for both modalities
- Spatial coregistration of fNIRS channels with fMRI activation maps
- Correlation analysis between fNIRS (Δ[HbO] and Δ[HbR]) and fMRI BOLD signals
- Assessment of spatial specificity and task sensitivity
Validation Metrics:
- Topographical similarity between fNIRS and fMRI activation patterns
- Temporal correlation of hemodynamic responses
- Laterality indices for left vs. right hand movements
- Effect sizes for task-related activation in SMA [87]
Protocol 2: Resting-State Network Validation
Resting-state networks (RSNs) provide a task-free approach to validation. The following protocol is adapted from studies comparing EEG and fMRI-derived RSNs [88] [39].
Experimental Design:
- Participants: 20-30 healthy adults across age groups
- Conditions: Eyes-closed rest (8-10 minutes), eyes-open rest (8-10 minutes)
- Session Structure: Simultaneous EEG-fMRI recording or separate sessions with matched conditions
Data Acquisition Parameters:
- fMRI: 3T scanner, T2*-weighted EPI sequence, TR=2000ms, TE=30ms, whole-brain coverage
- EEG: 61-channel system, sampling rate=1000Hz, impedance <10kΩ
- fNIRS (optional): 36-channel system, sampling rate=10Hz, covering frontoparietal regions
Analysis Pipeline:
- Preprocessing (artifact removal, band-pass filtering)
- Independent Component Analysis (ICA) for RSN identification
- Source reconstruction for EEG data
- Functional connectivity analysis (seed-based or graph-based)
- Comparison of network topology between modalities
Validation Metrics:
- Spatial correlation of RSN maps (e.g., default mode network)
- Correspondence in functional connectivity matrices
- Similarity in network properties (modularity, hub distribution)
- Correspondence between EEG amplitude envelopes and fMRI BOLD signals [88]
Visualization of Cross-Validation Frameworks
Signaling Pathways and Neurovascular Coupling
Figure 1: Neurovascular coupling relationship linking EEG, fMRI, and fNIRS signals. Neural activity triggers metabolic demands that drive hemodynamic responses measured by both fMRI and fNIRS.
Experimental Validation Workflow
Figure 2: Workflow for cross-validation studies comparing fNIRS/EEG with fMRI as reference standard.
The Scientist's Toolkit: Essential Research Reagents
Table 3: Essential materials and software for cross-validation studies
| Item | Function/Purpose | Example Specifications |
|---|---|---|
| fMRI-Compatible fNIRS System | Simultaneous data acquisition | MRI-compatible optodes, fiber-optic cables >5m, magnetic-field-resistant [50] |
| EEG/fMRI Cap | Simultaneous electrophysiological and hemodynamic recording | MRI-compatible electrodes, carbon fiber wires, safe for high-field environments [39] |
| 3D Digitizer | Spatial coregistration of fNIRS/EEG with MRI | Patriot Polhemus or similar, <1mm accuracy, records nasion/inion/preauricular points [87] |
| AtlasViewer Software | fNIRS probe placement guidance | Brain mapping based on standard brains, ensures proper ROI targeting [3] [87] |
| Dynamic Causal Modeling (DCM) | Effective connectivity analysis | Estimates coupling between brain regions; validated for fNIRS-fMRI [89] |
| SPM Software | Statistical parametric mapping | Preprocessing and GLM analysis for both fMRI and fNIRS data [89] |
| MNE-Python | EEG/fNIRS processing | Source reconstruction, connectivity analysis, integration with structural data [39] |
| Brainstorm Software | Multimodal data integration | User-friendly interface for EEG/fNIRS/MRI coregistration and visualization [39] |
Key Findings from Validation Literature
fMRI-fNIRS Validation Outcomes
Recent validation studies demonstrate strong correspondence between fNIRS and fMRI measurements across multiple domains:
Spatial Correspondence: Research by Klein et al. (2022) revealed that fNIRS reliably detected activation in the supplementary motor area (SMA) during both motor execution and motor imagery tasks, with spatial patterns strongly correlating with fMRI activation maps (Spearman correlations significant for most tasks) [87]. The study found that Δ[HbR] provided more specific spatial information than Δ[HbO] for motor imagery tasks.
Temporal Correlations: Simultaneous fNIRS-fMRI recordings show moderate to strong correlations between BOLD signals and fNIRS hemoglobin concentrations. Huppert et al. (2017) found good correspondence between fNIRS, fMRI, and MEG during sensory stimulation tasks, validating source-localized fNIRS on a group level [3].
Clinical Applications: In stroke recovery research, combined fMRI-fNIRS approaches have validated fNIRS as a reliable tool for monitoring motor recovery, with strong correlations between fNIRS measurements and clinical outcome scales [15]. Similar validation has been established for applications in Alzheimer's disease, depression, and autism spectrum disorder [50] [17].
fMRI-EEG Validation Outcomes
Resting-State Networks: Studies comparing EEG and fMRI-derived resting-state networks demonstrate qualitative similarity in spatial patterns, though dynamic functional connectivity shows less agreement between modalities [88]. Medium-density EEG systems (61 channels) can provide network descriptions comparable to those identified by high-density MEG systems [88].
Structure-Function Relationships: Research by [39] reveals that structure-function coupling varies between electrical (EEG) and hemodynamic (fNIRS) networks, with fNIRS structure-function coupling resembling slower-frequency EEG coupling at rest. Greater coupling was observed in the sensory cortex, while increased decoupling occurred in the association cortex.
Quantitative EEG Parameters: In stroke recovery, qEEG parameters such as the power ratio index (PRI) and brain symmetry index (BSI) correlate with fMRI metrics and clinical outcomes, validating their use as prognostic biomarkers [15].
Cross-validation studies using fMRI as a gold standard have firmly established the credibility of both fNIRS and EEG as robust neuroimaging tools. The convergence of findings across modalities strengthens the theoretical foundations of cognitive neuroscience and enhances the methodological rigor of clinical neuroimaging.
Future developments in cross-validation research will likely focus on hardware innovations (such as improved MRI-compatible fNIRS probes), standardized protocols for multimodal data acquisition, and advanced data fusion techniques driven by machine learning approaches [50] [17]. Additionally, efforts to solve the depth limitation of fNIRS and infer subcortical activities through multimodal integration represent promising avenues for expanding the utility of these complementary techniques.
As neuroimaging continues to evolve, the triangulation of evidence from fMRI, fNIRS, and EEG will remain essential for bridging spatial and temporal gaps in our understanding of human brain function, ultimately enhancing diagnostic and therapeutic strategies in clinical neuroscience.
Selecting the appropriate neuroimaging modality is a critical step in designing effective neuroscience or clinical research. Functional Magnetic Resonance Imaging (fMRI), Electroencephalography (EEG), and functional Near-Infrared Spectroscopy (fNIRS) each offer unique insights into brain function, but they differ significantly in their technical principles, capabilities, and practical applications [17] [2] [90]. This framework provides a structured approach, grounded in a comparison of these modalities, to help researchers and drug development professionals select the optimal tool for their specific project goals.
Core Technical Specifications and Physiological Foundations
The fundamental differences between fMRI, EEG, and fNIRS lie in the physiological signals they measure and their resulting performance characteristics. The table below provides a quantitative comparison of their core technical specifications.
Table 1: Core Technical Specifications of fMRI, EEG, and fNIRS
| Feature | fMRI | EEG | fNIRS |
|---|---|---|---|
| What It Measures | Blood Oxygen Level Dependent (BOLD) signal [17] [3] | Electrical potentials from synchronized neuronal firing [72] [90] | Concentration changes in oxygenated (HbO) and deoxygenated hemoglobin (HbR) [72] [3] |
| Spatial Resolution | High (millimeters) [17] [2] | Low (centimeters) [72] [90] | Moderate (1-3 cm), cortical surface only [17] [90] |
| Temporal Resolution | Low (0.5-2 Hz, limited by hemodynamic response) [17] [50] | Very High (milliseconds) [72] [2] | Moderate (seconds, limited by hemodynamic response) [3] [90] |
| Depth Penetration | Whole brain, including deep structures (e.g., amygdala, hippocampus) [17] [50] | Cortical surface [2] [90] | Superficial cortex (up to ~1-2.5 cm) [17] [3] |
| Portability | No, requires fixed scanner [17] [3] | Yes, wearable systems available [90] [33] | Yes, highly portable and wearable [17] [3] |
Physiological Basis and Complementarity:
- fMRI and fNIRS both measure hemodynamic activity, an indirect correlate of neural activity via neurovascular coupling. fMRI detects magnetic properties related to blood oxygenation, while fNIRS uses near-infrared light to measure optical absorption by hemoglobin [3] [50]. fNIRS is often described as a "wearable fMRI" for cortical imaging [50].
- EEG provides a direct measure of neuro-electrical activity with millisecond precision, capturing dynamics that hemodynamic methods cannot [90] [33]. Its spatial resolution is limited because electrical signals are blurred by the skull and scalp [72] [2].
This relationship between the neural and vascular domains, connected by neurovascular coupling, is foundational for selecting and integrating these tools.
Figure 1: Relationship between neural activity, hemodynamic response, and the primary modalities used to measure them. EEG provides a direct, fast measure of electrical activity, while fNIRS and fMRI measure the slower, coupled hemodynamic response.
The Modality Selection Framework: Key Strategic Questions
Navigate the modality selection process by answering the following critical questions about your research objectives, practical constraints, and data needs.
What is the primary brain activity signature of interest?
The nature of the physiological process you aim to capture is the most critical question.
- Choose EEG if: Your research hinges on capturing high-speed neural dynamics. This includes event-related potentials (ERPs), neural oscillations in specific frequency bands, or the precise timing of sensory processing, motor planning, or rapid cognitive tasks [90]. It is the gold standard for studying processes like seizure activity or sleep stages [72] [90].
- Choose fNIRS or fMRI if: Your focus is on localizing sustained cognitive or metabolic activity. This includes studying emotional states, cognitive workload, higher-order executive functions (e.g., in the prefrontal cortex), or the functional localization of a task [17] [90]. fMRI is superior for whole-brain mapping, while fNIRS is ideal for targeted cortical studies.
- Choose fMRI if: Your research requires investigation of subcortical or deep brain structures (e.g., hippocampus, amygdala, thalamus) [17] [50]. fNIRS and EEG are primarily limited to the cortical surface.
What are the spatial and temporal resolution requirements for your study?
Balance your need to know "where" versus "when" brain activity occurs.
- Choose EEG: For the highest temporal resolution to track brain dynamics on a millisecond scale [72] [2].
- Choose fMRI: For the highest spatial resolution and whole-brain coverage, including deep structures [17] [3].
- Choose fNIRS: For a favorable trade-off, offering better spatial resolution than EEG for cortical areas while being more portable than fMRI [72] [90]. Its temporal resolution is sufficient to track the hemodynamic response.
What are the practical and environmental constraints of your study?
The experimental setting and participant population heavily influence the choice.
- Choose fNIRS or mobile EEG if: Your study occurs in a naturalistic, real-world setting (e.g., classroom, sports field, rehabilitation clinic) or requires any degree of participant movement [17] [3] [90]. fNIRS is notably more robust to movement artifacts than EEG [90].
- Choose fNIRS or EEG if: You are studying populations with low compliance (e.g., infants, young children, or individuals with neurological disorders like Alzheimer's), for whom the confined, loud environment of an fMRI scanner is prohibitive [72] [3].
- Choose fMRI if: The study can be conducted in a highly controlled laboratory setting and requires the unique whole-brain, high-spatial-resolution data that fMRI provides [17].
- Avoid fMRI if: Participants have metal implants (e.g., pacemakers) or cannot tolerate the loud noise and confined space (claustrophobia) [3].
What is the scope of your budget and infrastructure?
Consider the total cost of ownership, not just initial purchase.
- Choose EEG or fNIRS if: Your project has budget constraints or aims for high-throughput testing. These modalities have significantly lower costs per measurement compared to fMRI, which has high costs for both the equipment and facility maintenance [72] [3].
- Choose fNIRS or EEG if: You need a flexible, portable system that can be used in multiple locations without a dedicated scanning facility [17] [33].
Would a multimodal approach provide a more complete answer?
Often, the most powerful approach is to combine modalities to overcome their individual limitations.
- Consider EEG + fNIRS: This is a highly synergistic combination for studying cortical function. It allows you to capture the electrical neural activity (EEG) and the complementary hemodynamic response (fNIRS) simultaneously, providing a more complete picture of brain function [72] [33]. This is particularly valuable in Brain-Computer Interface (BCI) development, cognitive neuroscience, and clinical neurology [20] [33].
- Consider fMRI + fNIRS: This combination is often used for validating fNIRS signals against the gold-standard spatial localization of fMRI or for using fMRI to inform fNIRS probe placement for longitudinal or naturalistic studies [17] [50].
Figure 2: A strategic decision framework for selecting a neuroimaging modality based on project-specific requirements.
Experimental Protocols for Multimodal Integration
Integrating EEG and fNIRS is a powerful approach to overcome the limitations of either modality alone. Below is a detailed methodology for a simultaneous EEG-fNIRS experiment, as used in studies on motor imagery and semantic decoding [39] [20].
Protocol: Simultaneous EEG-fNIRS Recording During a Cognitive Task
1. Research Question: Can combined EEG and fNIRS signals accurately decode brain states during a mental imagery task?
2. Equipment and Reagent Setup:
- Integrated Cap: An EEG cap with pre-defined openings or fixtures for fNIRS optodes. Custom 3D-printed or thermoplastic helmets can also be used for better fit and probe stability [72].
- EEG System: Amplifier and 30+ electrodes placed according to the international 10-5 or 10-20 system, sampled at 1000 Hz [39] [20].
- fNIRS System: Sources and detectors arranged over the region of interest (e.g., motor cortex, prefrontal cortex) with an inter-optode distance of 30 mm, using wavelengths of 760 nm and 850 nm, sampled at 12.5 Hz [39] [20].
- Synchronization Unit: A unified processor or external hardware trigger (e.g., TTL pulses) to synchronize EEG and fNIRS data acquisition with millisecond precision [72] [90].
- Stimulus Presentation Software: To display task cues and record event markers.
3. Participant Preparation:
- Fit the integrated cap on the participant, ensuring good contact.
- For EEG: Apply electrolyte gel to achieve impedance below 10 kΩ.
- For fNIRS: Ensure optodes have firm but comfortable scalp contact, verified via a scalp-coupling index [39].
4. Experimental Paradigm (e.g., Motor Imagery):
- Baseline (60 s): Participant rests with eyes open [39].
- Task Trials (30 trials):
- Cue (2 s): An on-screen instruction (e.g., "Imagine left hand") cues the task.
- Imagery (10 s): Participant performs the cued motor imagery without moving.
- Rest (Randomized): A variable rest period to allow the hemodynamic response to return to baseline.
5. Data Preprocessing (Separate Pipelines):
- EEG:
- Bandpass filter (e.g., 0.5-40 Hz).
- Remove artifacts using Independent Component Analysis (ICA) to correct for eye blinks and muscle noise.
- Re-reference to average reference.
- fNIRS:
- Convert raw light intensity to optical density.
- Apply bandpass filter (e.g., 0.02-0.2 Hz) to remove cardiac pulsation and slow drift.
- Convert to concentration changes of HbO and HbR using the Modified Beer-Lambert Law.
- Use Principal Component Analysis (PCA) to remove global physiological noise from the scalp [39].
6. Data Fusion and Analysis:
- Temporal Alignment: Align preprocessed EEG and fNIRS data using the synchronization markers.
- Feature Extraction:
- From EEG: Extract power in specific frequency bands (e.g., alpha, beta) from the imagery period.
- From fNIRS: Extract mean HbO concentration changes during the imagery period.
- Joint Analysis: Use machine learning classifiers (e.g., Support Vector Machines) or data-driven fusion techniques like joint Independent Component Analysis (jICA) to combine the EEG and fNIRS features for brain state classification [33].
Table 2: Essential Research Reagents and Materials for a Simultaneous EEG-fNIRS Study
| Item | Function | Key Considerations |
|---|---|---|
| Integrated EEG-fNIRS Cap | Holds electrodes and optodes in a stable, co-registered configuration on the scalp. | Use pre-configured caps or custom 3D-printed/thermoplastic designs for better fit and probe stability [72]. |
| EEG Electrolyte Gel | Ensures conductive connection between scalp and electrodes, reducing impedance. | Required for high-quality signal acquisition. Water-based gels are typical. |
| fNIRS Optodes | Emit near-infrared light (sources) and detect light that has scattered through tissue (detectors). | Typically use two wavelengths (e.g., 760 & 850 nm) to resolve HbO and HbR [39]. |
| Synchronization Hardware/Software | Ensures temporal alignment of EEG and fNIRS data streams with high precision. | Critical for correlating fast electrical signals with slower hemodynamic changes [72] [33]. |
| Digitization System | Records the 3D spatial positions of EEG electrodes and fNIRS optodes relative to scalp landmarks. | Enables accurate co-registration of data with anatomical brain atlases [39]. |
The choice between fMRI, EEG, and fNIRS is not a matter of identifying the "best" technology, but rather the most appropriate one for a specific scientific question and practical context. fMRI remains unparalleled for whole-brain, high-spatial-resolution mapping in controlled settings. EEG is the definitive tool for capturing the rapid dynamics of neural electrical activity. fNIRS offers a powerful blend of portability, tolerability, and localized hemodynamic measurement, making it ideal for real-world and clinical applications.
By systematically applying the decision framework outlined here—evaluating the target brain signature, resolution needs, practical constraints, and budget—researchers can make a strategic and justified modality selection. Furthermore, the growing toolkit for multimodal integration, particularly EEG with fNIRS, promises to unlock richer, more comprehensive insights into the intricate functioning of the human brain.
The quest to understand the human brain relies profoundly on our ability to observe its structure and function. Non-invasive neuroimaging techniques have become cornerstones of cognitive neuroscience and clinical practice, each providing a unique window into neural activity. Among the most prominent are functional Magnetic Resonance Imaging (fMRI), which measures blood oxygenation changes; Electroencephalography (EEG), which records electrical activity from the scalp; and functional Near-Infrared Spectroscopy (fNIRS), which uses light to measure hemodynamic responses in the cortex [2] [91]. While these modalities all probe brain function, they differ fundamentally in their physical principles, spatiotemporal resolution, and practical applicability.
The future of neuroimaging does not lie in the supremacy of a single technique, but in their strategic integration. Emerging trends are defined by multimodal approaches that combine complementary strengths, the application of advanced machine learning to decipher complex brain signals, and a push toward accessible, robust technologies suitable for naturalistic settings and diverse populations. This evolution is paving the way for more nuanced investigations into brain networks, personalized medicine in neurology and psychiatry, and a deeper understanding of human cognition in real-world environments.
Core Neuroimaging Modalities: A Technical Comparison
To appreciate the trajectory of neuroimaging, one must first understand the core characteristics of its primary tools. The following table provides a detailed, quantitative comparison of fMRI, EEG, and fNIRS.
Table 1: Technical Comparison of fMRI, EEG, and fNIRS
| Feature | fMRI | EEG | fNIRS |
|---|---|---|---|
| What It Measures | Blood Oxygenation Level Dependent (BOLD) signal [17] [9] | Electrical potentials from synchronized neuronal firing [2] [91] | Concentration changes in oxygenated (HbO) & deoxygenated hemoglobin (HbR) [17] [91] |
| Physiological Basis | Neurovascular coupling (hemodynamic response) [9] | Post-synaptic potentials of cortical pyramidal cells [91] | Neurovascular coupling (hemodynamic response) [3] |
| Spatial Resolution | High (millimeters) [17] [2] | Low (centimeters) [2] [91] | Moderate (centimeters, cortical surface) [17] [57] |
| Temporal Resolution | Low (seconds) [17] [2] | Very High (milliseconds) [2] [91] | Moderate (seconds) [91] |
| Depth Penetration | Whole brain (cortical & subcortical) [17] | Cortical surface [2] [91] | Superficial cortex (1-2.5 cm) [17] [91] |
| Portability / Environment | Low (requires MRI scanner, restrictive) [17] [3] | High (increasingly wireless) [91] | High (wearable, portable systems) [57] [3] |
| Tolerance to Motion | Low (highly sensitive to motion) [17] [9] | Low (susceptible to movement artifacts) [91] | High (relatively robust to motion) [57] [91] |
| Cost & Accessibility | High (expensive equipment and scans) [2] [3] | Generally lower [91] | Generally higher than EEG, but lower than fMRI [91] [3] |
| Key Strengths | Gold standard for spatial localization; whole-brain coverage [17] [9] | Direct measure of neural activity; excellent for tracking fast neural dynamics [91] | Good balance of portability and spatial resolution; ideal for naturalistic studies [57] [3] |
| Primary Limitations | Expensive, noisy, confines participants, poor temporal resolution [17] [3] | Poor spatial resolution, sensitive to artifacts, limited to cortical surface [2] [91] | Cannot image subcortical structures, limited spatial resolution compared to fMRI [17] [3] |
Emerging Trends and Technological Advances
The Multimodal Integration Paradigm
A dominant trend in modern neuroimaging is the move away from unimodal studies toward integrated, multimodal approaches. Recognizing that no single technique can fully capture the brain's complexity, researchers are combining modalities to achieve a more holistic view [17] [9]. The synergy between fMRI and fNIRS is a prime example. fMRI provides high-resolution spatial maps of brain activity, covering both cortical and subcortical structures, while fNIRS offers superior temporal resolution, portability, and higher tolerance for movement, making it suitable for naturalistic and interactive settings [17]. This combination allows for the validation of fNIRS signals against the fMRI gold standard and enables experimental designs where detailed baseline scans are acquired in the scanner (fMRI), followed by portable monitoring with fNIRS in real-world environments [17] [9].
Integration methodologies are categorized into synchronous and asynchronous modes. Synchronous data acquisition involves collecting fMRI and fNIRS data simultaneously, allowing for direct correlation of signals and advanced data fusion techniques [17]. Asynchronous acquisition involves using the modalities in separate sessions, often using the high-resolution fMRI data to inform the placement and interpretation of fNIRS optodes in subsequent experiments [17]. These approaches are advancing research in neurological disorders (e.g., stroke, Alzheimer's), social cognition, and neuroplasticity [17].
Machine Learning and Advanced Analytics
The growing complexity and volume of neuroimaging data have made machine learning (ML) and advanced statistical analyses indispensable. These tools are critical for identifying patterns in data that are not discernible through traditional analysis.
- Enhancing Diagnostic Precision: In clinically challenging areas like Disorders of Consciousness (DoC), ML models trained on fNIRS-based functional connectivity features have demonstrated high accuracy in differentiating between vegetative state and minimally conscious state patients [32]. These models use features derived from whole-brain and network analyses to provide objective biomarkers for diagnosis and prognosis [32].
- Improving Data Quality and Reproducibility: Machine learning algorithms are being deployed to automatically identify and correct motion artifacts, improve signal-to-noise ratio, and classify data quality. This is particularly relevant given the findings of the FRESH initiative, which highlighted that reproducibility in fNIRS research is significantly influenced by data quality and analytical choices [59]. Standardized ML-driven preprocessing pipelines can help mitigate analytical variability across research groups.
- Powering Brain-Computer Interfaces (BCIs): The high temporal resolution of EEG has traditionally made it the go-to modality for BCIs. However, fNIRS is emerging as a complementary technology, especially for applications where sustained cognitive states, rather than transient signals, are used for control. ML algorithms decode the hemodynamic signals from fNIRS to control external devices [57].
The Push for Accessibility and Ecological Validity
There is a growing demand for neuroimaging technologies that can be used outside the confines of a dedicated laboratory, making brain research more accessible and ecologically valid.
- Portability and Wearability: fNIRS and mobile EEG systems are at the forefront of this trend. The development of fiberless, wearable HD-DOT (High-Density Diffuse Optical Tomography) systems represents a significant leap, enabling high-density brain imaging while participants are mobile [57]. This allows for studies of brain function during real-world activities like social interaction, exercise, and driving [91] [3].
- Accessibility for Special Populations: The portability and motion tolerance of fNIRS make it particularly suitable for populations that are difficult to study with fMRI, such as infants, young children, and patients with neurological disorders or metal implants [17] [92] [3]. This is expanding research into developmental trajectories and the neural correlates of developmental psychopathology [92].
- High-Density Arrays for Improved Resolution: To address the spatial resolution limitations of traditional fNIRS, high-density (HD) arrays with overlapping, multi-distance channels are being developed. Studies statistically comparing HD arrays to traditional sparse arrays show that HD configurations provide superior localization of brain activity, better sensitivity, and greater inter-subject consistency, bringing fNIRS performance closer to that of fMRI [57].
Experimental Protocols for Multimodal Neuroimaging
The following section provides a detailed methodology for a representative multimodal study that investigates brain activation during a cognitive task using combined fMRI and fNIRS, a common paradigm for validating fNIRS and exploring brain function.
Protocol: Simultaneous fMRI-fNIRS Acquisition During a Cognitive Task
Objective: To validate fNIRS-derived hemodynamic responses against the fMRI BOLD signal and to leverage the portability of fNIRS to extend the experimental paradigm into a naturalistic setting.
Task Paradigm: The Word-Color Stroop (WCS) task is an excellent candidate. In this task, participants are shown color words (e.g., "BLUE") printed in either a congruent (the word "BLUE" in blue ink) or incongruent (the word "BLUE" in red ink) color. The incongruent condition elicits cognitive conflict and robustly activates the dorsolateral prefrontal cortex (dlPFC) [57]. The task can be presented in a block design (e.g., 30-second blocks of congruent trials alternating with 30-second blocks of incongruent trials, separated by rest periods).
Procedure:
- Participant Preparation: After obtaining informed consent, screen participants for MRI contraindications. Fit the participant with an MRI-compatible fNIRS probe cap. These caps are designed with non-metallic materials and use fiber-optic cables that extend to the scanner control room to prevent interference and ensure participant safety [17].
- Hardware Synchronization: Synchronize the clocks of the fMRI scanner and the fNIRS system. Use a trigger pulse from the fMRI scanner at the start of the functional scan to simultaneously initiate the fNIRS recording and the presentation of the task paradigm. This ensures temporal alignment of the data streams for subsequent fusion and analysis [17] [91].
- Data Acquisition:
- fMRI: Acquire whole-brain BOLD images (e.g., using a T2*-weighted gradient-echo echo-planar imaging sequence). Parameters might include: TR = 2000 ms, TE = 30 ms, voxel size = 3x3x3 mm³.
- fNIRS: Use a system with dual-wavelength (e.g., 730 nm and 850 nm) light sources and detectors arranged over the prefrontal cortex. The source-detector distance should typically be 3 cm to ensure cortical sensitivity [32]. Record continuous light intensity data at a high sampling rate (e.g., 10 Hz).
- Data Preprocessing:
- fMRI Data: Process using a standard pipeline (e.g., in SPM or FSL) including slice-time correction, realignment, co-registration to a structural image, normalization to standard space (e.g., MNI), and spatial smoothing.
- fNIRS Data: Process using a toolbox like Homer2 or NIRS-KIT [32]. Steps include:
- Converting raw intensity to optical density.
- Identifying and rejecting bad channels based on a coefficient of variation (CV) threshold (e.g., >20%) [32].
- Applying a motion artifact correction algorithm (e.g., wavelet-based or PCA-based).
- Band-pass filtering (e.g., 0.01 - 0.2 Hz) to remove physiological noise (heart rate, respiration) and slow drifts.
- Converting optical density to concentration changes of HbO and HbR using the Modified Beer-Lambert Law.
- Data Analysis:
- First-Level Analysis: For both modalities, model the hemodynamic response to the congruent and incongruent task conditions using a general linear model (GLM).
- Spatial Correspondence: Co-register the fNIRS channel locations to the fMRI anatomical space using 3D digitization or predefined MRI-compatible probe layouts. Then, extract the mean fMRI BOLD signal from the cortical regions underlying each fNIRS channel and correlate it with the fNIRS-derived HbO/HbR time courses [17] [9].
- Group-Level Analysis: Perform group-level random-effects analysis for each modality separately to create statistical maps of brain activation. Compare the spatial localization and statistical power of the activation detected by each modality.
Diagram 1: Simultaneous fMRI-fNIRS Experimental Workflow
The Scientist's Toolkit: Key Research Reagent Solutions
Table 2: Essential Materials for a Multimodal fMRI-fNIRS Study
| Item / Solution | Function / Rationale |
|---|---|
| MRI-Compatible fNIRS System | A specialized fNIRS system with non-magnetic components and fiber-optic cables that extend outside the MRI scanner room, preventing electromagnetic interference and ensuring participant safety [17]. |
| 3D Digitizer Probe | A magnetic or optical digitizer to record the precise 3D locations of fNIRS optodes relative to anatomical landmarks on the participant's head. This is critical for accurate co-registration of fNIRS data with anatomical MRI scans [17]. |
| High-Density fNIRS Probe Cap | A cap with a high-density array of source and detector optodes, often in a hexagonal pattern with multiple source-detector distances (e.g., 1.5 cm, 3.0 cm). This configuration improves spatial resolution, depth sensitivity, and signal quality through overlapping measurement fields [57]. |
| Synchronization Trigger Box | A hardware device that generates a TTL pulse from the fMRI scanner to the fNIRS computer and stimulus presentation software, ensuring all data streams are aligned with millisecond precision for temporal fusion [91]. |
| Short-Separation Channels | fNIRS channels with a very short source-detector distance (e.g., 0.8 cm). These channels are primarily sensitive to systemic physiological noise in the scalp. Their signals are used in regression algorithms to clean the data from standard channels, significantly improving the quality of the cortical brain signal [57]. |
| Data Fusion Software Toolboxes | Software platforms like Homer2, NIRS-KIT, SPM, FSL, and custom MATLAB or Python scripts that provide integrated pipelines for preprocessing, visualizing, and statistically analyzing multimodal datasets [59] [32]. |
The trajectory of neuroimaging is clear: a future dominated by integrated, accessible, and intelligent technologies. Key areas for future development include:
- Hardware Innovation: Continued development of MRI-compatible, wearable, and high-density sensor arrays is crucial. This includes miniaturizing electronics, creating more flexible and comfortable wearables, and developing novel probes that can extend the depth sensitivity of optical techniques [17] [57].
- Standardized Methodologies and Data Sharing: The FRESH initiative underscores the critical need for standardized data processing pipelines and reporting standards to enhance reproducibility and transparency in neuroimaging research, particularly for emerging techniques like fNIRS [59].
- Advanced Computational Models: The application of deep learning and other complex ML models will continue to grow, enabling more powerful denoising, source localization, and the discovery of novel, high-dimensional biomarkers for neurological and psychiatric diseases [17] [32].
- Hyperscanning and Interactive Paradigms: The portability of fNIRS and EEG makes them ideal for "hyperscanning" – simultaneously recording brain activity from multiple individuals during real-time social interactions. This will open new frontiers in social neuroscience [17].
In conclusion, the differences between fMRI, EEG, and fNIRS are not weaknesses but rather sources of complementary strength. fMRI remains the gold standard for detailed spatial mapping, EEG for capturing rapid neural dynamics, and fNIRS for its unique blend of portability, robustness, and hemodynamic monitoring. The future of neuroimaging lies in a holistic strategy that leverages these complementary tools, powered by machine learning, to create a more complete, dynamic, and ecologically valid picture of the functioning human brain. This integrated approach promises to revolutionize our understanding of brain networks, accelerate drug development by providing sensitive biomarkers, and ultimately improve diagnostic and therapeutic strategies for a wide range of brain disorders.
Conclusion
fMRI, EEG, and fNIRS are not competing technologies but rather complementary tools in the neuroimaging arsenal, each offering a unique window into brain function. fMRI remains unparalleled for detailed spatial mapping of deep brain structures, EEG excels at capturing the rapid dynamics of neural communication, and fNIRS offers a unique balance of portability and robustness for real-world applications. The future of brain research lies in multimodal approaches that integrate these strengths to overcome individual limitations. For biomedical and clinical research, this means developing standardized protocols for data fusion, leveraging machine learning to extract more information from hybrid datasets, and creating more accessible, next-generation portable systems. This evolution will be crucial for advancing personalized medicine, improving neurorehabilitation strategies, and accelerating drug development by providing richer, more ecologically valid biomarkers of brain health and disease.
References
- 1. fNIRS vs EEG: Comparing Non-Invasive Brain Imaging ... [https://imotions.com/blog/learning/research-fundamentals/fnirs-vs-eeg/?srsltid=AfmBOoqyiPgivi4cvKtBOWk9saT4y7uEhWDIwPqPGGCReXy2x13vNgWx]
- 2. What is the difference between fMRI, EEG and TD-fNIRS? [https://docs.kernel.com/docs/what-is-the-difference-between-fmri-eeg-and-td-fnirs]
- 3. Comparison of fNIRS with other neuroimaging modalities [https://www.artinis.com/blogpost-all/comparison-fnirs-vs-fmri]
- 4. Functional Near-infrared Spectroscopy (fNIRS) of Brain ... [https://pmc.ncbi.nlm.nih.gov/articles/PMC3294084/]
- 5. Exploring the Frontiers of Neuroimaging - PubMed Central - NIH [https://pmc.ncbi.nlm.nih.gov/articles/PMC10381462/]
- 6. Hemodynamic and electrophysiological signals of conflict ... [https://pubmed.ncbi.nlm.nih.gov/19895124/]
- 7. EEG Normal Waveforms - StatPearls - NCBI Bookshelf [https://www.ncbi.nlm.nih.gov/books/NBK539805/]
- 8. Frontiers | fMRI at High : Implications for... Spatial Resolution [https://www.frontiersin.org/journals/computational-neuroscience/articles/10.3389/fncom.2016.00066/full]
- 9. Functional Magnetic Resonance Imaging and Functional Near ... [https://pmc.ncbi.nlm.nih.gov/articles/PMC5563305/]
- 10. EEG vs. MRI vs. fMRI - What are the Differences? [https://imotions.com/blog/learning/research-fundamentals/eeg-vs-mri-vs-fmri-differences/?srsltid=AfmBOoo4uH6bkw0yzkJ5fAhnAsB9EQqG6ZLzLCQWPA9WB0s2BGC9dV3O]
- 11. fNIRS vs EEG: Comparing Non-Invasive Brain Imaging ... [https://imotions.com/blog/learning/research-fundamentals/fnirs-vs-eeg/?srsltid=AfmBOorIuCGVvgS2Q8VFWI0x9dhysCR7LPEjwv3X79xbpq8KBz_-040T]
- 12. Magnitude and phase behavior of multiresolution BOLD - PMC signal [https://pmc.ncbi.nlm.nih.gov/articles/PMC2947032/]
- 13. Quantitative Analyses Help in Choosing Between ... [https://pmc.ncbi.nlm.nih.gov/articles/PMC6335318/]
- 14. The relationship between EEG and fMRI connectomes is ... [https://www.sciencedirect.com/science/article/pii/S1053811921001415]
- 15. Current implications of EEG and fNIRS as functional ... [https://pmc.ncbi.nlm.nih.gov/articles/PMC11629311/]
- 16. fNIRS vs EEG: Comparing Non-Invasive Brain Imaging ... [https://imotions.com/blog/learning/research-fundamentals/fnirs-vs-eeg/?srsltid=AfmBOopDvYvxRtOBa11iEIbAfeuooP-eb1gvQcH_RbtYdZA89mHBEqi6]
- 17. Applications and advances of combined fMRI-fNIRs ... [https://www.frontiersin.org/journals/neurology/articles/10.3389/fneur.2025.1542075/full]
- 18. Time is of the Essence: A Review of Electroencephalography ... [https://pmc.ncbi.nlm.nih.gov/articles/PMC5693972/]
- 19. Combining three techniques boosts brain-imaging precision [https://news.illinois.edu/combining-three-techniques-boosts-brain-imaging-precision/]
- 20. Simultaneous EEG and fNIRS recordings for semantic ... [https://www.nature.com/articles/s41597-025-04967-0]
- 21. vs fNIRS : EEG Non-Invasive Brain Comparing ... - iMotions Imaging [https://imotions.com/blog/learning/research-fundamentals/fnirs-vs-eeg/]
- 22. Applications of Functional Near-Infrared Spectroscopy (fNIRS ... [https://pmc.ncbi.nlm.nih.gov/articles/PMC12347915/]
- 23. Overview of Functional Magnetic Resonance Imaging - PMC [https://pmc.ncbi.nlm.nih.gov/articles/PMC3073717/]
- 24. Functional MRI (fMRI) of the brain [https://www.radiologyinfo.org/en/info/fmribrain]
- 25. Electroencephalogram - StatPearls - NCBI Bookshelf - NIH [https://www.ncbi.nlm.nih.gov/books/NBK563295/]
- 26. A Dynamic Model of Brain Hemodynamics in Near-Infrared ... [https://pubmed.ncbi.nlm.nih.gov/31751221/]
- 27. Unfolding the real-time neural mechanisms in addiction [https://www.sciencedirect.com/science/article/pii/S2772392522000438]
- 28. Multimodal fNIRS-EEG sensor fusion: Review of data- ... [https://pubmed.ncbi.nlm.nih.gov/41211102/]
- 29. fNIRS vs EEG: Comparing Non-Invasive Brain Imaging ... [https://imotions.com/blog/learning/research-fundamentals/fnirs-vs-eeg/?srsltid=AfmBOoqPkODztH1KTLOLn4DbKmiNW_8X3EZr05nRyJhr6e2nXOf1x_m2]
- 30. Functional near-infrared spectroscopy for the assessment ... [https://www.frontiersin.org/journals/neurology/articles/10.3389/fneur.2025.1524806/full]
- 31. HEFMI-ICH: a hybrid EEG-fNIRS motor imagery dataset for ... [https://www.nature.com/articles/s41597-025-06100-7]
- 32. Functional connectivity in whole-brain and network ... [https://translational-medicine.biomedcentral.com/articles/10.1186/s12967-025-07181-z]
- 33. Multimodal fNIRS–EEG sensor fusion: Review of data-driven ... [https://pmc.ncbi.nlm.nih.gov/articles/PMC12592382/]
- 34. EEG–fNIRS signal integration for motor imagery ... [https://www.sciencedirect.com/science/article/pii/S2772528625000299]
- 35. Functional Near-Infrared Spectroscopy in Schizophrenia ... [https://pmc.ncbi.nlm.nih.gov/articles/PMC12413766/]
- 36. fNIRS vs EEG: Comparing Non-Invasive Brain Imaging ... [https://imotions.com/blog/learning/research-fundamentals/fnirs-vs-eeg/?srsltid=AfmBOooJYK5G6huTDfRmGPW2tl-7YGQAkfSTmA-Md7VO1hXyZE9dZthU]
- 37. Integrated Brain Connectivity Analysis with fMRI, DTI, and ... [https://pmc.ncbi.nlm.nih.gov/articles/PMC11383444/]
- 38. Benchmarking methods for mapping functional connectivity ... [https://www.nature.com/articles/s41592-025-02704-4]
- 39. Comparing structure–function relationships in brain ... [https://www.nature.com/articles/s41598-024-79817-x]
- 40. fNIRS vs EEG: Comparing Non-Invasive Brain Imaging ... [https://imotions.com/blog/learning/research-fundamentals/fnirs-vs-eeg/?srsltid=AfmBOoqphbGi5oHIrq37XDT8JGGd_z0DUUGYRsIzGkVa4VQ7E22PAgf7]
- 41. Event-related Potentials of the Brain and Cognitive ... [https://pubmed.ncbi.nlm.nih.gov/3703232/]
- 42. 14 Event Related Potentials (ERP) - Components and ... [https://www.neuroelectrics.com/blog/14-event-related-potentials-erp-components-and-modalities]
- 43. EEG Recording and Analysis for Sleep Research - PMC [https://pmc.ncbi.nlm.nih.gov/articles/PMC2824445/]
- 44. Polysomnography (sleep study) [https://www.mayoclinic.org/tests-procedures/polysomnography/about/pac-20394877]
- 45. EEG-based epileptic seizure detection using binary ... [https://www.nature.com/articles/s41598-023-44318-w]
- 46. Effective Early Detection of Epileptic Seizures through EEG ... [https://pmc.ncbi.nlm.nih.gov/articles/PMC10252693/]
- 47. The functional near infrared spectroscopy applications in ... [https://www.frontiersin.org/journals/neurology/articles/10.3389/fneur.2025.1495138/full]
- 48. A Cross-Disciplinary Review of the fNIRS-EEG Dual ... [https://www.mdpi.com/2076-3425/14/10/1022]
- 49. Functional near-infrared spectroscopy in pediatric clinical ... [https://www.spiedigitallibrary.org/journals/neurophotonics/volume-10/issue-2/023517/Functional-near-infrared-spectroscopy-in-pediatric-clinical-research--Different/10.1117/1.NPh.10.2.023517.full]
- 50. Applications and advances of combined fMRI-fNIRs ... [https://pmc.ncbi.nlm.nih.gov/articles/PMC11958174/]
- 51. Evaluating the effects of multimodal EEG-fNIRS ... [https://journals.plos.org/plosone/article?id=10.1371/journal.pone.0331177]
- 52. Task-based functional connectivity in infants after exposure ... [https://www.nature.com/articles/s41598-025-14774-7]
- 53. fNIRS vs EEG: Comparing Non-Invasive Brain Imaging ... [https://imotions.com/blog/learning/research-fundamentals/fnirs-vs-eeg/?srsltid=AfmBOooLnQYH97QMVsvHhloo2YtyCfNU4wR5vQVffhJbALWu9BlK1Dr2]
- 54. Evaluating the effects of multimodal EEG-fNIRS ... [https://pmc.ncbi.nlm.nih.gov/articles/PMC12425317/]
- 55. fNIRS-based brain-computer interfaces: a review - PMC [https://pmc.ncbi.nlm.nih.gov/articles/PMC4309034/]
- 56. BCI & Neurofeedback with FNIRS | Concurrent NIRS EEG ... [https://nirx.net/fnirs-bci-neurofeedback]
- 57. High-density multidistance fNIRS enhances detection of ... [https://pmc.ncbi.nlm.nih.gov/articles/PMC12412631/]
- 58. Recent applications of EEG-based brain-computer-interface in ... [https://mmrjournal.biomedcentral.com/articles/10.1186/s40779-025-00598-z]
- 59. fNIRS reproducibility varies with data quality, analysis ... [https://www.nature.com/articles/s42003-025-08412-1]
- 60. EEG at the Edge: Signals, Selves, and Systems [https://www.scientificarchives.com/article/eeg-at-the-edge-signals-selves-and-systems]
- 61. Functional near-infrared spectroscopy (fNIRS) detects brain ... [https://pmc.ncbi.nlm.nih.gov/articles/PMC12489781/]
- 62. A quantitative comparison of NIRS and fMRI across multiple ... [https://pmc.ncbi.nlm.nih.gov/articles/PMC3021967/]
- 63. Longer scans boost prediction and cut costs in brain-wide ... [https://www.nature.com/articles/s41586-025-09250-1]
- 64. A Quantitative Comparison of Simultaneous BOLD fMRI ... [https://www.sciencedirect.com/science/article/abs/pii/S1053811902912279]
- 65. Brain activity characteristics of RGB stimulus: an EEG study [https://www.nature.com/articles/s41598-023-46450-z]
- 66. Concurrent fNIRS and EEG for Brain Function Investigation [https://pmc.ncbi.nlm.nih.gov/articles/PMC9371171/]
- 67. fNIRS vs EEG: Comparing Non-Invasive Brain Imaging ... [https://imotions.com/blog/learning/research-fundamentals/fnirs-vs-eeg/?srsltid=AfmBOoqqQ5KZfR4l0i4l28IRz5kUQmtcazthkJq5Ft92gRQuCyOOMuYO]
- 68. Spatial and temporal resolutions of EEG - PubMed Central - NIH [https://pmc.ncbi.nlm.nih.gov/articles/PMC4548479/]
- 69. Detection and reduction of EEG artifacts due to head motion [https://www.sciencedirect.com/science/article/abs/pii/S1053811915006291]
- 70. EEG Source Imaging: A Practical Review of the Analysis ... [https://www.frontiersin.org/journals/neurology/articles/10.3389/fneur.2019.00325/full]
- 71. Correcting physiological noise in whole-head functional ... [https://www.sciencedirect.com/science/article/pii/S0165027021001977]
- 72. A Cross-Disciplinary Review of the fNIRS-EEG Dual-Modality ... [https://pmc.ncbi.nlm.nih.gov/articles/PMC11506513/]
- 73. Functional near-infrared spectroscopy reveals brain activity ... [https://pmc.ncbi.nlm.nih.gov/articles/PMC9231602/]
- 74. fNIRS vs EEG: Comparing Non-Invasive Brain Imaging ... [https://imotions.com/blog/learning/research-fundamentals/fnirs-vs-eeg/?srsltid=AfmBOooyOweTtzkRStkprBgOKlpoWwLrtkCKGRbvEj-ERPvNWEXDFN34]
- 75. Optimizing spatial specificity and signal quality in fNIRS [https://pmc.ncbi.nlm.nih.gov/articles/PMC11188482/]
- 76. Optimizing spatial specificity and signal quality in fNIRS [https://www.frontiersin.org/journals/neuroergonomics/articles/10.3389/fnrgo.2024.1286586/full]
- 77. The application of fNIRS in studies on occupational workload [https://www.frontiersin.org/journals/public-health/articles/10.3389/fpubh.2025.1560605/full]
- 78. Applications of Functional Near-Infrared Spectroscopy ... [https://pubmed.ncbi.nlm.nih.gov/40806818/]
- 79. Functional Magnetic Resonance Imaging and ... [https://www.frontiersin.org/journals/human-neuroscience/articles/10.3389/fnhum.2017.00419/full]
- 80. fNIRS vs EEG: Comparing Non-Invasive Brain Imaging ... [https://imotions.com/blog/learning/research-fundamentals/fnirs-vs-eeg/?srsltid=AfmBOorbHE69N-F7W0vBwKqAIp0Xdsllf5dWTOSUky_LAMCjU8_3Kxr8]
- 81. Comparing structure–function relationships in brain networks using... [https://www.nature.com/articles/s41598-024-79817-x?error=cookies_not_supported&code=d1ad66cf-0c6c-4c27-8ff2-1352f15acc91]
- 82. fNIRS vs EEG: Comparing Non-Invasive Brain Imaging ... [https://imotions.com/blog/learning/research-fundamentals/fnirs-vs-eeg/?srsltid=AfmBOop49Rax9F_e1gKa-3AX3-XP-RMcD9tZTjIHQrjMpJP0WNdMx62w]
- 83. Simultaneous multimodal fNIRS-EEG recordings reveal ... [https://www.nature.com/articles/s41598-023-31609-5]
- 84. Best practices for fNIRS publications - PMC - PubMed Central [https://pmc.ncbi.nlm.nih.gov/articles/PMC7793571/]
- 85. Neurophysiological data augmentation for EEG-fNIRS ... [https://www.sciencedirect.com/science/article/abs/pii/S0169260725000112]
- 86. Differences between EEG, NIRS, fMRI and MEG [https://brainlatam.com/blog/differences-between-eeg-nirs-fmri-and-meg-924]
- 87. fMRI-based validation of continuous-wave fNIRS ... [https://www.nature.com/articles/s41598-022-06519-7]
- 88. Comparison between EEG and MEG of static and dynamic ... [https://pmc.ncbi.nlm.nih.gov/articles/PMC11372824/]
- 89. Dynamic causal modelling on infant fNIRS data [https://www.sciencedirect.com/science/article/pii/S1053811918303185]
- 90. fNIRS vs EEG: Comparing Non-Invasive Brain Imaging ... [https://imotions.com/blog/learning/research-fundamentals/fnirs-vs-eeg/?srsltid=AfmBOoqkHdc-0P7uN1rELU66Y_k-cCCFbUWTTe73v0aWK0fDWumWTBkr]
- 91. fNIRS vs EEG: Comparing Non-Invasive Brain Imaging ... [https://imotions.com/blog/learning/research-fundamentals/fnirs-vs-eeg/?srsltid=AfmBOor-NFo50ssbjHc81XXWWnxjgpZhFf0lwUp3pSumFFUmpsRtdrjW]
- 92. Considerations for conducting developmental neuroimaging ... [https://pubmed.ncbi.nlm.nih.gov/40885851/]