Advanced Non-Invasive Brain Imaging Methods: A Comprehensive Guide for Researchers and Drug Developers
This article provides a comprehensive overview of cutting-edge non-invasive brain imaging and stimulation methods, tailored for researchers and drug development professionals.
Advanced Non-Invasive Brain Imaging Methods: A Comprehensive Guide for Researchers and Drug Developers
Abstract
This article provides a comprehensive overview of cutting-edge non-invasive brain imaging and stimulation methods, tailored for researchers and drug development professionals. It covers the foundational principles of major modalities like fMRI, EEG, PET, and TMS, explores their specific applications in clinical trials for target engagement and patient stratification, addresses key methodological challenges and optimization strategies, and offers a comparative analysis of technique validation. By synthesizing the latest advances from 2024-2025, this guide aims to equip scientists with the knowledge to effectively integrate these tools into research and development pipelines, ultimately de-risking drug development and improving clinical outcomes in neuroscience.
Core Principles and Emerging Frontiers in Non-Invasive Neuroimaging
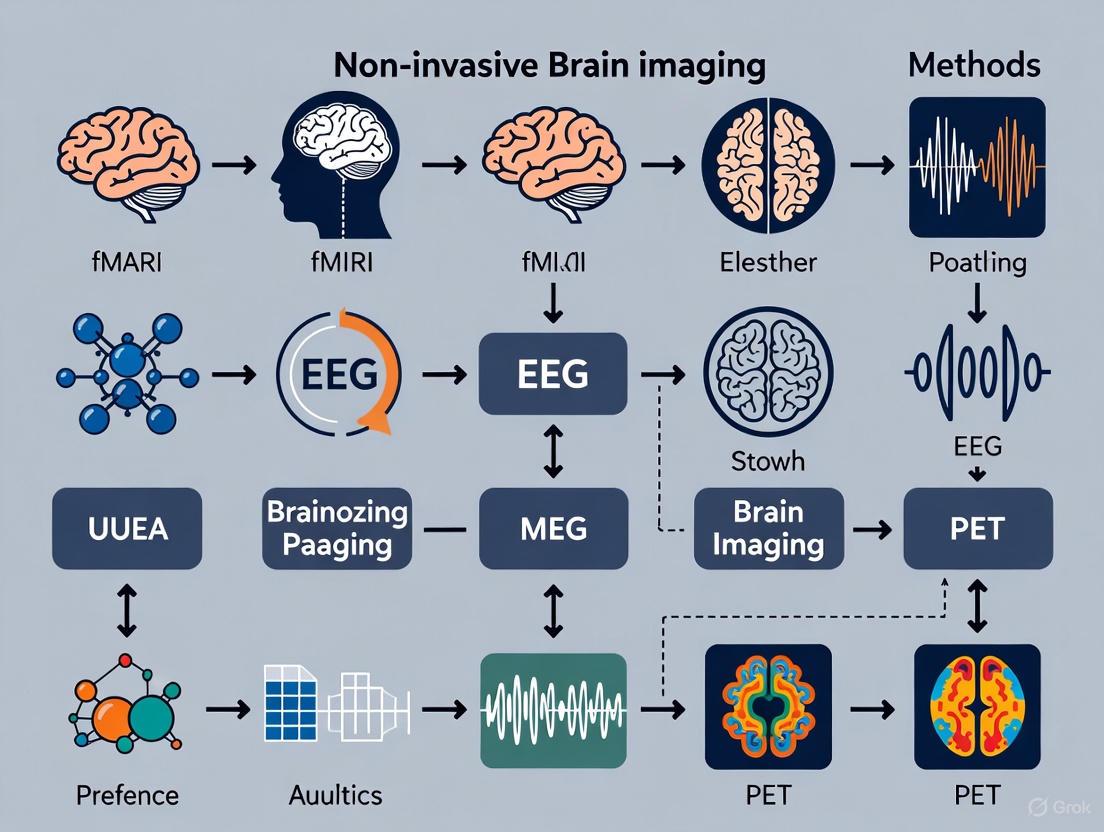
Modern neuroscience research and drug development rely heavily on a suite of non-invasive neuroimaging technologies that allow for the direct observation of brain structure, function, and physiology. These methods form an essential toolkit for investigating neural mechanisms, diagnosing disorders, and evaluating treatments. The four cornerstone techniques—Magnetic Resonance Imaging (MRI/functional MRI), Electroencephalography (EEG), Positron Emission Tomography (PET), and Transcranial Magnetic Stimulation (TMS)—each provide unique and complementary windows into brain activity and organization [1]. MRI offers high-resolution anatomical detail, while fMRI maps brain function through blood flow changes. EEG captures millisecond-scale electrical activity, PET visualizes metabolic and molecular processes, and TMS probes causal brain-behavior relationships through stimulation. When integrated in multimodal approaches, these tools powerfully de-risk drug development by providing early pharmacodynamic readouts and enabling patient stratification, ultimately improving clinical outcomes in psychiatry and neurology [2]. This technical guide details the principles, methodologies, and integrated applications of these core technologies for research and clinical development professionals.
Comparative Analysis of Core Neuroimaging Modalities
The selection of an appropriate neuroimaging tool depends on the specific research question, considering factors such as spatial and temporal resolution, physiological basis, and practical constraints like cost and availability. The following table provides a systematic comparison of the four core modalities.
Table 1: Technical Comparison of Core Neuroimaging Modalities
| Modality | Spatial Resolution | Temporal Resolution | Primary Measures | Key Applications | Main Advantages | Main Limitations |
|---|---|---|---|---|---|---|
| MRI/fMRI | High (sub-mm) | Seconds | Brain structure (MRI), Blood-oxygen-level-dependent (BOLD) signal (fMRI) | Tumor detection, structural anomalies, brain function mapping, connectivity | Excellent soft-tissue contrast, no ionizing radiation, high-resolution structural and functional data | Time-consuming, expensive, sensitive to motion, contraindicated for certain metal implants [1] |
| EEG | Low (cm) | Milliseconds | Electrical potentials from synchronized neuronal firing | Epilepsy, sleep disorders, cognitive event-related potentials (ERPs) | Real-time direct brain activity measurement, cost-effective, fully portable | Poor spatial resolution, limited to cortical surface, sensitive to non-neural artifacts [1] [2] |
| PET | Moderate (mm) | Minutes | Radioactive tracer distribution (metabolism, receptor occupancy) | Neurodegenerative diseases, cancer, neuropharmacology, metabolism | Molecular and metabolic process visualization, specific target engagement assessment | Involves ionizing radiation, costly, requires cyclotron for many tracers, lower temporal resolution [1] [2] |
| TMS | Moderate (cm) | Milliseconds (stimulation) | Induced electric fields, evoked potentials (when combined with EEG) | Neuropsychiatric treatment, causal brain-behavior mapping, pre-surgical mapping | Causal intervention (not just observation), therapeutic application, probes brain connectivity | Superficial cortical targeting, inter-subject variability in electric field, requires neuronavigation for precision [3] |
Detailed Methodologies and Experimental Protocols
Magnetic Resonance Imaging (MRI/fMRI)
Protocol 1: Structural MRI for Anatomical Reference
- Pulse Sequence: T1-weighted magnetization-prepared rapid gradient echo (MPRAGE).
- Parameters: Typical resolution = 1 mm³ isotropic; TR/TI/TE = 2300/900/2.9 ms; flip angle = 9°.
- Procedure: Participants are positioned supine with head immobilized. A multi-channel head coil is used for signal reception. Scan duration is approximately 5-8 minutes. Data is reconstructed into 3D volumes for analysis of cortical thickness, volumetry, and as an anatomical reference for functional scans.
Protocol 2: Resting-State fMRI for Functional Connectivity
- Pulse Sequence: T2*-weighted echo-planar imaging (EPI).
- Parameters: Resolution = 2–3 mm³ isotropic; TR/TE = 2000/30 ms; ~10 minutes acquisition.
- Procedure: Participants are instructed to keep their eyes open, fixate on a cross, and let their mind wander without sleeping. Preprocessing includes slice-time correction, motion realignment, normalization to standard space, and band-pass filtering (0.01–0.1 Hz). Connectivity is analyzed using seed-based correlation or independent component analysis to identify networks like the default mode network (DMN) [4].
Electroencephalography (EEG)
Protocol 3: Event-Related Potentials (ERPs) for Cognitive Processing
- System Setup: High-density EEG system (64–128 channels) with active electrodes.
- Parameters: Sampling rate ≥ 1000 Hz; impedance kept below 10 kΩ.
- Procedure: Participants perform a computerized task (e.g., oddball, Go/No-Go) while EEG is continuously recorded. Data is offline-referenced, filtered (0.1–30 Hz), and segmented into epochs time-locked to stimuli. Artifact rejection (e.g., for eye blinks) is performed, and epochs are averaged to extract components like the P300, which reflects cognitive processes such as attention and memory Updating [2].
Positron Emission Tomography (PET)
Protocol 4: Target Engagement with Radioligand PET
- Tracer Selection: Tracer specific to the molecular target (e.g., [¹¹C]raclopride for D2/D3 receptors).
- Procedure: A bolus of the radiotracer is injected intravenously. Dynamic PET scanning is performed for 60–90 minutes to measure the time-course of tracer concentration in the brain. Arterial blood sampling may be used to measure the metabolite-corrected input function. Using a compartmental model, the binding potential (BPND) is calculated. To assess engagement, this protocol is repeated after drug administration; the percentage reduction in BPND indicates target occupancy [2].
Transcranial Magnetic Stimulation (TMS)
Protocol 5: Neuronavigated TMS for Precise Target Engagement
- System Setup: TMS system with a biphasic pulse capable figure-of-eight coil, integrated with MRI-based neuronavigation and EMG/EEG.
- Procedure:
- Subject-Specific Targeting: An individual structural MRI is loaded into the neuronavigation system. The target (e.g., dorsolateral prefrontal cortex - DLPFC) is defined based on individual anatomy or connectivity, moving beyond standardized coordinates [3].
- Motor Threshold (MT) Determination: The TMS coil is positioned over the primary motor cortex (M1) to elicit motor evoked potentials (MEPs) in a hand muscle. The resting MT is defined as the minimum intensity required to produce MEPs of >50 μV in 5 out of 10 trials.
- Stimulation: The coil is navigated to the DLPFC target. Stimulation intensity is set as a percentage of MT (e.g., 120%). Intermittent theta-burst stimulation (iTBS: 2s trains of 3 pulses at 50 Hz repeated at 5 Hz, every 10s for 3 minutes) can be applied for therapeutic protocols.
- Assessing Connectivity: Concurrent TMS-EEG is used to measure TMS-evoked potentials (TEPs), providing a direct readout of cortical reactivity and effective connectivity in the targeted network [3].
Table 2: Essential Research Reagents and Materials for Neuroimaging Experiments
| Item | Function/Purpose | Example Use Case |
|---|---|---|
| High-Density EEG System (64+ channels) | Records electrical brain activity with high temporal resolution | Capturing event-related potentials (ERPs) or resting-state oscillations in cognitive studies [2] |
| MRI-Compatible Eye Tracker | Monitors eye position and pupil diameter during fMRI | Controlling for vigilance, identifying sleep, or studying arousal in task-based fMRI |
| Specific PET Radioligand (e.g., [¹¹C]PBR28) | Binds to a specific molecular target (e.g., TSPO in neuroinflammation) | Quantifying target availability and drug occupancy in the living brain [2] |
| Neuromodulation: TMS with Neuronavigation | Precisely targets and stimulates specific brain circuits based on individual anatomy | Probing causal brain-behavior links; therapeutic stimulation in depression [3] |
| Analysis Suites (FSL, FreeSurfer, SPM) | Processes and analyzes structural and functional MRI data | Cortical reconstruction, volumetric segmentation, and statistical parametric mapping |
| BIDS Validator | Ensures neuroimaging data is organized according to the Brain Imaging Data Structure | Promoting reproducibility and facilitating data sharing across labs [5] |
Multimodal Integration and Advanced Applications
Workflows for Multimodal Integration
Combining neuroimaging modalities provides a more comprehensive understanding of brain structure and function than any single technique can offer. The following diagram illustrates a standard workflow for integrating multiple modalities to optimize TMS target engagement, a key application in modern neuromodulation.
This integrated workflow addresses a major challenge in neuromodulation: the traditional "one target for all" approach leads to poorly defined electric field intensity and uncertain engagement outside the primary motor cortex [3]. By combining anatomical (sMRI), structural connectivity (dMRI), and functional (fMRI) data, researchers can identify personalized targets. This precise targeting is then realized using neuronavigated TMS, with concurrent EEG providing a direct readout of the neurophysiological impact of the stimulation, thereby closing the loop.
Application in Drug Development and Psychiatry
Multimodal neuroimaging is increasingly critical in de-risking drug development, particularly in psychiatry. It serves two principal functions: establishing pharmacodynamics (does the drug engage its intended brain target and alter relevant circuits?) and enabling patient stratification (can we identify patients most likely to respond?) [2].
For example, in developing a treatment for Cognitive Impairment Associated with Schizophrenia (CIAS), a functional target engagement approach using EEG/ERP was more informative than molecular PET imaging. While PET showed that high doses of a phosphodiesterase 4 inhibitor (PDE4i) were required for substantial target occupancy, EEG revealed that pro-cognitive effects on brain signals occurred at much lower, better-tolerated doses [2]. This highlights how functional neuroimaging can critically inform optimal dose selection.
In studying disorders like PTSD, a unimodal approach (e.g., using only MRI or EEG) is often insufficient to capture the complex, integrated neural mechanisms of the disorder. A multimodal approach that simultaneously probes structure (sMRI), white matter connectivity (DTI), and function (fMRI, EEG) can better capture dysregulation across large-scale brain networks like the Default Mode, Salience, and Central Executive Networks, aiding in the search for robust biomarkers [4].
Research Infrastructure and Credibility
Data Management and Reproducibility
Robust and credible neuroimaging research requires careful attention to data management and analytical practices. Key resources and practices include:
- Data Organization: The Brain Imaging Data Structure (BIDS) provides a simple and scalable standard for organizing neuroimaging data, facilitating easier sharing and analysis [5]. Tools like
dcm2bidscan automate the conversion of raw data into BIDS format. - Computational Environments: Cloud-based and containerized computational environments, such as the NITRC Computational Environment (NITRC-CE), provide pre-installed neuroimaging software (FSL, FreeSurfer, AFNI), ensuring reproducibility and reducing setup time for complex analyses [6].
- Code-Based Visualization: Programmatic generation of neuroimaging figures using R, Python, or MATLAB, as opposed to manual GUI-based methods, is crucial for creating replicable, publication-ready visualizations. Sharing this code is a cornerstone of open science [7].
- Data Sharing and FAIR Principles: Shared data should adhere to the FAIR principles (Findable, Accessible, Interoperable, and Reusable). Repositories like NeuroVault (for statistical maps) and OpenNeuro (for raw data) support this goal, but data sharing must be GDPR-compliant, often requiring participant consent and a Data User Agreement [5].
Methodological Rigor
- Preregistration: Preregistering study hypotheses, methods, and analysis plans via registries like the Open Science Framework or as a Registered Report is a powerful guard against bias and flexible data analysis [5].
- Sample Size Planning: Neuroimaging studies often require large samples for reproducible results. Power calculations, guided by tools like
fMRIpoweror simulations, are essential during the planning stage, even given the cost constraints of neuroimaging [5]. - Reporting Standards: Following community-developed reporting checklists, such as the COBIDAS (Committee on Best Practice in Data Analysis and Sharing) guidelines, ensures comprehensive and transparent reporting of methods and results [5].
Non-invasive neuroimaging stands as a cornerstone of modern neuroscience, yet it remains constrained by a fundamental trade-off: no single modality can simultaneously capture brain activity with both high spatial and high temporal resolution. Techniques like magnetoencephalography (MEG) provide millisecond-scale temporal precision but suffer from poor spatial detail, whereas functional magnetic resonance imaging (fMRI) offers millimeter-scale spatial mapping but tracks the sluggish hemodynamic response over seconds [8]. This limitation presents a significant barrier to understanding complex neural processes—such as speech comprehension or cognitive task performance—that involve rapidly evolving, distributed network interactions [8].
Multimodal integration has emerged as the principal strategy to transcend this barrier. By combining complementary data streams, researchers can reconstruct a more complete picture of brain function. Current approaches generally fall into two categories: data-driven fusion methods, which use machine learning to discover latent relationships between modalities [9], and model-based integration, which incorporates biophysical forward models to constrain source estimates [8]. The evolution of these methods marks a paradigm shift from simply comparing parallel datasets to generating unified, high-fidelity estimates of underlying neural activity that are otherwise inaccessible non-invasively.
Multimodal Integration Frameworks and Technical Approaches
Deep Learning-Based Encoding Models
A cutting-edge approach involves transformer-based encoding models that integrate MEG and fMRI data collected during naturalistic experiments, such as narrative story comprehension [8]. This framework treats the inverse problem—estimating neural sources from sensor data—as a supervised learning task.
The model architecture inputs three parallel feature streams representing the stimulus: contextual word embeddings (from GPT-2), phoneme features, and mel-spectrograms of the audio [8]. A transformer encoder processes these features, and its output is projected into a latent source space representing cortical activity. This latent source must simultaneously predict both the MEG sensor readings (via a lead-field matrix based on Maxwell's equations) and the fMRI BOLD signals (via a hemodynamic response model) from the same subjects [8]. The training objective ensures that the estimated source activity consistently generates both measurement types through their respective biophysical forward models.
Table: Key Components of a Transformer-Based MEG-fMRI Encoding Model
| Component | Function | Specifications |
|---|---|---|
| Input Features | Represents naturalistic stimuli | 768D word embeddings, 44D phoneme features, 40D mel-spectrograms [8] |
| Transformer Encoder | Captures temporal dependencies | 4 layers, 2 heads, feed-forward size=512, causal window=500 tokens (10s) [8] |
| Source Space | Represents cortical activity | 8,196 sources on "fsaverage" cortical surface [8] |
| Forward Models | Maps sources to sensor data | Lead-field matrix (MEG), hemodynamic response model (fMRI) [8] |
Symmetric Data-Driven Fusion for Wearable Neuroimaging
For naturalistic settings outside the laboratory, symmetric data-driven fusion of functional near-infrared spectroscopy (fNIRS) and electroencephalography (EEG) offers a promising alternative [9]. Unlike model-based approaches, these methods typically employ blind source separation and multivariate decomposition techniques to identify shared latent components between modalities without strong a priori assumptions.
These approaches are particularly valuable because they can function without precise stimulus timing information, making them suitable for studying brain dynamics during continuous, real-world tasks [9]. The complementarity of EEG (millisecond-scale electrical activity) and fNIRS (hemodynamic changes with better spatial localization) enables researchers to disambiguate neural signals from pervasive physiological confounds like cardiac activity, respiration, and motion artifacts, which manifest differently in each modality [9].
Precision Neuroimaging at Ultra-High Fields
The push for higher resolution has also driven advances in single-modality acquisition frameworks. The Precision Neuroimaging and Connectomics (PNI) dataset exemplifies this trend, employing 7 Tesla MRI across multiple sessions to achieve unprecedented individual-specific mapping [10]. This protocol aggregates multiple quantitative contrasts:
- T1 relaxometry for cortical myelination mapping
- Multi-shell diffusion MRI for structural connectomics
- Magnetization transfer imaging for myelin sensitivity
- Multi-echo fMRI for enhanced BOLD signal fidelity [10]
The multi-session design (∼90 minutes/session across three visits) provides sufficient data to study individual brains in their native space without relying on group averaging, thereby capturing subject-specific network organization with high reliability [10].
Quantitative Methodologies and Experimental Protocols
MEG-fMRI Fusion Experimental Protocol
The naturalistic MEG-fMRI fusion study provides a template for complex multimodal experimentation [8]:
- Stimulus: Narrative stories (>7 hours total)
- MEG Acquisition: Whole-head systems during passive listening
- fMRI Dataset: Leveraged existing data collected with identical stimuli [8]
- Source Space Construction: Individualized using structural MRI with MNE-Python
- Validation Approach: Cross-modality generalization and prediction of held-out electrocorticography (ECoG) data
This protocol's key innovation is using the same rich, naturalistic stimuli across modalities and subjects, enabling the model to learn complex feature-response mappings that generalize across measurement techniques.
Table: Comparison of Multimodal Integration Approaches
| Approach | Spatiotemporal Resolution | Primary Applications | Technical Challenges |
|---|---|---|---|
| MEG-fMRI Encoding Model [8] | High (millimeter-millisecond estimate) | Naturalistic cognition, language processing | Computational complexity, requires large datasets |
| fNIRS-EEG Symmetric Fusion [9] | Medium (EEG: ms; fNIRS: ~1cm) | Brain-computer interfaces, neurorehabilitation, naturalistic settings | Artifact separation, physiological confounds |
| Precision 7T MRI [10] | High spatial (sub-millimeter), low temporal (seconds) | Microstructural mapping, individual connectomics | Cost, accessibility, participant burden |
Arterial Spin Labeling Protocols for Pediatric Populations
For pediatric imaging, where contrast agents and radiation are concerning, arterial spin labeling (ASL) provides a noninvasive alternative for cerebral blood flow measurement [11]. A recent pediatric-focused study compared:
- Single-delay ASL: Traditional approach with fixed post-labeling delay
- Multi-delay ASL: Multiple inflow times to account for developmental differences in arterial transit time [11]
The research demonstrated that multi-delay ASL yields more robust perfusion measurements in developing brains, as it accommodates age-related variability in hemodynamics that can invalidate single-delay assumptions [11]. This protocol is particularly suitable for longitudinal studies of brain maturation and for populations like premature infants where repeated scanning is necessary.
Diffusion MRI Tractography Optimization
A critical methodological study examined how anisotropic voxels in diffusion MRI affect tractography metrics, finding that standard upsampling techniques cannot fully recover microstructural information once acquired at low resolution [12] [13]. The protocol recommended:
- Acquisition: Isotropic voxels (1.25mm³ or better) when possible
- Processing: Resampling to 1mm isotropic for improved bundle measure repeatability
- Metrics Affected: Fractional anisotropy (FA), mean diffusivity (MD), bundle volume/length/surface area [13]
This work highlights the importance of acquisition parameters—not just processing pipelines—for achieving accurate connectome reconstruction.
The Scientist's Toolkit: Essential Research Reagents
Table: Key Reagent Solutions for Multimodal Brain Imaging Research
| Reagent/Resource | Function/Role | Example Implementation |
|---|---|---|
| MNE-Python [8] | Source space construction and forward modeling | Individualized cortical surface meshes with equivalent current dipoles |
| Lead-Field Matrix [8] | Maps source activity to MEG sensor data | Computed from subject-specific anatomy using Maxwell's equations |
| Source Morphing Matrix [8] | Transforms sources between brain templates | Enables cross-subject alignment in "fsaverage" space |
| fNIRS Short-Separation Channels [9] | Measures and removes superficial hemodynamics | <1.5cm source-detector pairs for systemic artifact regression |
| Multi-Echo fMRI Sequences [10] | Discriminates BOLD from non-BOLD signals | T2* decay modeling at each voxel (e.g., TE=10.80/27.3/43.8ms) |
| Transformer-Based Encoders [8] | Models complex stimulus-feature relationships | 4-layer transformer with causal attention for naturalistic stimuli |
| Arterial Spin Labeling (ASL) [11] | Noninvasive cerebral blood flow quantification | Multi-delay protocols for pediatric populations |
Visualization of Multimodal Integration Frameworks
MEG-fMRI Encoding Model Workflow
Multimodal fNIRS-EEG Fusion Pipeline
Validation Strategies and Performance Metrics
Validating multimodal integration approaches presents unique challenges, as ground truth neural activity at high spatiotemporal resolution is inaccessible non-invasively. Researchers have developed several innovative validation strategies:
- Cross-modality generalization: A model trained to predict MEG and fMRI is considered validated if its latent source estimates accurately predict both modalities simultaneously [8].
- Invasion prediction: The most compelling validation involves testing whether non-invasively estimated sources can predict held-out electrocorticography (ECoG) data. Remarkably, one study showed that MEG-fMRI fusion models could predict ECoG signals better than models trained directly on ECoG data [8].
- Test-retest reliability: For microstructural and connectome mapping, bundle measure repeatability across scanning sessions provides validation, with resampling to 1mm isotropic resolution shown to improve reliability [13].
Quantitative performance metrics include prediction accuracy of held-out neural data, effect sizes for anisotropic voxel impacts (Cohen's d), and statistical significance of microstructural differences across resolutions (Wilcoxon Signed-Rank tests) [13].
Future Directions and Clinical Translation
The trajectory of multimodal neuroimaging points toward increasingly sophisticated integration frameworks and expanding clinical applications. Promising directions include:
- Dynamic neurovascular coupling models: Moving beyond static relationships to capture time-varying interactions between electrical and hemodynamic activity [9].
- Wearable multimodal systems: Integrating high-density DOT with EEG for naturalistic brain monitoring outside laboratory constraints [9] [14].
- AI-powered precision medicine: Leveraging machine learning for patient stratification and treatment prediction in neuropsychiatric disorders [15].
- Real-time closed-loop systems: Combining wearable imaging with neuromodulation for adaptive therapeutic interventions [14].
Clinical translation is already underway, with multimodal approaches demonstrating utility in tracking therapeutic response for rare neurological diseases like GM1 gangliosidosis [16], optimizing neuromodulation targets using individual connectome data [14], and developing noninvasive biomarkers for neurodegenerative conditions [15]. As these technologies mature, they promise to transform both fundamental neuroscience and clinical practice by providing unprecedented windows into brain function across spatiotemporal scales.
::: {.section} ::: {.section-title} 1 Introduction: From Noise to Neural Signature :::
The field of human neuroimaging has undergone a paradigm shift with the realization that spontaneous, task-independent brain activity is not merely noise but a rich source of information about the brain's functional architecture. The discovery that low-frequency fluctuations in the blood-oxygen-level-dependent (BOLD) signal are spatially correlated across distinct neural systems revolutionized the study of brain organization [17]. This phenomenon, known as functional connectivity (FC), forms the basis of resting-state fMRI (rsfMRI), a paradigm where participants simply rest in the scanner, placing minimal cognitive burden on them [17]. This approach has proven exceptionally valuable for studying populations across the lifespan, from pediatric to geriatric and clinical cohorts [17].
The initial observation of FC between left and right sensorimotor cortices [17] has since expanded into the field of network neuroscience, which conceptualizes the brain as a complex network of interacting regions. This perspective has led to the identification of reproducible intrinsic connectivity networks (ICNs), such as the default mode, dorsal attention, and frontoparietal control networks [17]. A key insight is that these resting-state networks closely recapitulate the spatial topography of networks activated during goal-directed tasks [17]. The scope of FC analysis has broadened from mapping static connections to capturing the brain's dynamic functional connectivity, revealing how networks reconfigure over time in health and disease [18]. Today, rsfMRI is poised to answer critical questions in neuroscience and is increasingly integrated into clinical translation efforts, particularly in de-risking drug development and advancing precision psychiatry [17] [2]. :::
::: {.section} ::: {.section-title} 2 Core Analytical Approaches in Functional Connectivity :::
The analysis of rsfMRI data encompasses a suite of methods designed to uncover the brain's spatiotemporal organization at multiple levels. The following table summarizes the key quantitative approaches and the biomarkers they yield.
Table 1: Core Analytical Methods and Biomarkers in Functional Connectivity Research
| Method Category | Specific Technique | Key Metric/Biomarker | Primary Application |
|---|---|---|---|
| Static Functional Connectivity | Seed-Based Correlation Analysis [19] | Correlation coefficient (r) / Z-score [19] | Quantifying connection strength between a seed region and all other brain voxels. |
| Independent Component Analysis (ICA) [17] | Spatial map components | Data-driven identification of whole-brain intrinsic connectivity networks (ICNs). | |
| Pearson Correlation Matrix [18] | Correlation matrix (N x N) | Constructing comprehensive whole-brain functional connectomes for network analysis. | |
| Dynamic Functional Connectivity | Sliding Window Correlation [18] | Time-varying connectivity strength | Tracking how functional connections between regions fluctuate over the scan duration. |
| Graph Recurrent Neural Networks [18] | Spatio-temporal features | Classifying brain states and capturing non-linear temporal patterns in dynamic networks. | |
| Network Neuroscience | Graph Theory [17] | Degree centrality, Betweenness centrality [18] | Identifying hub regions and quantifying their importance in network information flow. |
| Graph Pooling (e.g., SAGPooling) [18] | Top-K node selection | Dynamically selecting the most salient brain regions for classification or analysis. |
Static and Dynamic Connectivity
Static FC assumes temporal stationarity, summarizing connectivity over an entire scan. Seed-based correlation is a model-driven approach that calculates the temporal correlation between a pre-defined 'seed' region's BOLD signal and all other brain voxels, generating a whole-brain connectivity map [19]. In contrast, probabilistic independent component analysis (ICA) is a data-driven method that decomposes the rsfMRI data into statistically independent spatial components, each representing a large-scale functional network like the default mode or salience network [17].
Dynamic FC (dFC) moves beyond this stationary assumption to capture the brain's time-varying connectivity patterns [18]. The sliding window technique is a common approach, where the rsfMRI time-series is divided into consecutive windows, and a correlation matrix is calculated for each window, creating a time series of connectivity states [18]. Advanced machine learning models, such as the Dynamic Graph Recurrent Neural Network (Dynamic-GRNN), are now being applied to these dFC data to better model complex, non-linear temporal dependencies and improve disease classification accuracy [18].
Network Neuroscience and Graph Theory
Graph theory provides a mathematical framework to model the brain as a graph consisting of nodes (brain regions) and edges (functional connections). This allows for the quantification of network topology. Key metrics include degree centrality, which measures the number of connections a node has, and betweenness centrality, which identifies nodes that act as bridges on many shortest paths between other nodes [18]. These metrics help identify critical hub regions. Furthermore, techniques like self-attention graph pooling (SAGPooling) can dynamically select the most salient nodes (brain regions) across time, enhancing the interpretability and performance of classification models in disorders like Mild Cognitive Impairment (MCI) and Alzheimer's Disease (AD) [18]. :::
::: {.section} ::: {.section-title} 3 Experimental Protocols for Resting-State fMRI :::
Protocol 1: Basic Seed-Based Functional Connectivity Analysis
This protocol is a foundational method for investigating the functional connectivity of a specific brain region.
- Aim: To map the whole-brain functional connectivity pattern of a pre-defined Region of Interest (ROI).
- Materials: Resting-state fMRI data (BOLD signal), structural T1-weighted data, ROI definition (coordinates or mask).
- Procedure:
- Data Acquisition: Acquire T1-weighted structural images and 5-10 minutes of resting-state fMRI BOLD data with participants instructed to keep their eyes open or closed, remain awake, and not think of anything in particular [17].
- Image Preprocessing: Process functional images using standard pipelines (e.g., in SPM, FSL, or DPABI) [19]. Key steps include:
- Slice-timing correction and realignment for head motion.
- Co-registration of functional and structural images.
- Normalization to a standard stereotaxic space (e.g., MNI).
- Spatial smoothing and band-pass filtering (typically 0.01-0.1 Hz) to reduce noise [19].
- Nuisance regression to remove signals from white matter, cerebrospinal fluid, and head motion parameters [19].
- Seed Time-Series Extraction: Extract the average BOLD time-series from all voxels within the defined ROI.
- First-Level Correlation Analysis: Calculate the Pearson's correlation coefficient between the seed time-series and the time-series of every other voxel in the brain for each subject [19].
- Statistical Analysis: Transform correlation coefficients to Z-scores using Fisher's transformation. Perform group-level inference (e.g., one-sample t-tests) on the individual Z-score maps to identify connections that are significantly different from zero [19].
Protocol 2: Dynamic Functional Connectivity for Classification
This advanced protocol is used to capture time-varying network properties for distinguishing clinical groups.
- Aim: To classify patients (e.g., with MCI or AD) from healthy controls using dynamic functional connectivity features [18].
- Materials: Resting-state fMRI data from patients and controls, high-performance computing resources.
- Procedure:
- Data Preprocessing and Parcellation: Preprocess rsfMRI data as in Protocol 1. Parcellate the brain into multiple regions of interest (ROIs) using a standard atlas.
- Dynamic Network Construction:
- Apply a sliding window (e.g., 30-60 seconds width) to the preprocessed rsfMRI time-series.
- For each window, calculate a functional connectivity matrix (e.g., using Pearson Correlation) between all ROIs, creating a time-series of connectivity matrices [18].
- (Optional) Apply methods like Slide Piecewise Aggregation (SPA) to enhance features and suppress noise [18].
- Spatio-Temporal Feature Extraction: Input the dynamic networks into a model like a Dynamic Graph Recurrent Neural Network (Dynamic-GRNN). This model jointly learns the functional relationships (spatial) and their temporal evolution to extract discriminative features [18].
- Node Selection and Classification: Employ a technique like temporal self-attention graph pooling (SAGPooling) to dynamically select the most salient brain regions across time. Feed the resulting features into a classifier (e.g., a fully connected layer) to distinguish between groups [18].
The following diagram illustrates the logical workflow and data transformation in a dynamic functional connectivity analysis pipeline.
(Diagram: Dynamic FC Analysis Workflow) :::
::: {.section} ::: {.section-title} 4 The Scientist's Toolkit: Essential Research Reagents and Materials :::
Successful execution of functional connectivity studies requires a suite of analytical tools and data resources. The following table details the key components of the modern network neuroscientist's toolkit.
Table 2: Essential Research Reagents and Computational Tools
| Category | Item/Software | Specific Function |
|---|---|---|
| Data & Populations | ADHD-200 Sample [19] | Publicly available dataset with rsfMRI data from ADHD patients and controls for method validation. |
| Alzheimer's Disease Neuroimaging Initiative (ADNI) [18] | Provides multimodal longitudinal data for studying MCI and AD progression. | |
| Processing & Analysis Software | SPM, FSL, AFNI | Standard software packages for core fMRI preprocessing (realignment, normalization, smoothing). |
| DPABI [19] | A toolbox for "Data Processing & Analysis for Brain Imaging," streamlining pipeline implementation. | |
| Conn Toolbox [19], GIFT | Specialized software for functional connectivity and independent component analysis (ICA). | |
| Graph Neural Network Libraries (e.g., PyTorch Geometric) | Frameworks for implementing dynamic graph models for advanced time-varying connectivity analysis [18]. | |
| Computational Frameworks | Graph Theory Metrics (Brain Connectivity Toolbox) | Quantifies network properties (e.g., centrality, modularity) from functional connectomes. |
| Cross-Dataset Validation [19] | A critical protocol for ensuring the generalizability and robustness of identified biomarkers. |
:::
::: {.section} ::: {.section-title} 5 Translational Applications in Drug Development and Therapeutics :::
The principles of functional connectivity are increasingly being leveraged to address high failure rates in central nervous system (CNS) drug development. Neuroimaging biomarkers offer objective, quantifiable readouts of brain function that can de-risk decision-making across the clinical development pipeline [2] [20] [21]. The primary use cases are as pharmacodynamic measures and patient stratification tools [2].
As a pharmacodynamic measure, rsfMRI can demonstrate functional target engagement. For instance, a drug designed to enhance cognition in schizophrenia could be tested in Phase I to see if it modulates connectivity within the frontoparietal network—a network critical for cognitive control—even in the absence of a task [2]. This approach can establish brain penetration and inform dose selection by identifying the dose-response relationship on a functional brain outcome, which may be more sensitive than molecular occupancy alone (e.g., as measured by PET) [2].
For patient stratification, rsfMRI can identify neurophysiological subtypes within a heterogeneous diagnostic category. Patients with Major Depressive Disorder who exhibit hyperconnectivity in the default mode network, for example, might be more likely to respond to a drug that normalizes this circuitry [2]. Enriching clinical trials with such biomarker-defined subgroups increases the probability of detecting a clinical signal of efficacy [2] [21].
Furthermore, FC analysis is guiding the development of non-pharmacological interventions. For disorders like ADHD, meta-analyses of fMRI studies combined with cross-dataset FC validation have identified novel stimulation targets for non-invasive brain stimulation (NIBS), such as specific locations on the dorsolateral prefrontal cortex and supplementary motor area, moving beyond traditional, less effective targets [19].
The following diagram summarizes how functional connectivity is integrated across the various stages of the drug development process.
(Diagram: FC in Drug Development Pipeline) :::
::: {.section} ::: {.section-title} 6 Conclusion and Future Directions :::
Functional connectivity and network neuroscience have fundamentally transformed our understanding of the brain's intrinsic organization, moving the field from a focus on static localization to dynamic, system-level interactions. The analytical toolkit, encompassing everything from seed-based correlation to dynamic graph neural networks, provides researchers with powerful means to quantify the brain's functional architecture and its perturbations in disease. The translational pathway for these methods is now clearly established, with a growing track record of applications in de-risking drug development by objectively demonstrating functional target engagement, optimizing dose selection, and enabling patient stratification through neurophysiological biomarkers [2] [21].
The future of the field lies in greater integration and validation. This includes the need for cross-dataset validation of biomarkers to ensure generalizability [19], the development of standardized analytical practices, and a deeper mechanistic understanding of the neurophysiological origins of the BOLD signal [17]. Furthermore, the full potential of FC will be realized through its integration with other data modalities—from genetics to digital phenotyping—within a precision psychiatry framework. As these tools become more robust and accessible, they hold the promise of not only accelerating the development of novel therapeutics but also of ultimately guiding treatment selection in clinical practice to improve outcomes for patients with neurological and psychiatric disorders [17] [2]. :::
The recent discovery of the glymphatic system has fundamentally transformed our understanding of brain physiology, particularly regarding waste clearance and fluid dynamics within the central nervous system (CNS). This pathway is essential for nutrient distribution and the removal of metabolic waste, operating predominantly during sleep, and has been strongly implicated in the pathogenesis of neurodegenerative diseases such as Alzheimer's and Parkinson's disease [22]. The glymphatic system functions as a brain-wide perivascular network through which cerebrospinal fluid (CSF) enters the brain parenchyma, exchanges with interstitial fluid, and clears neurotoxins, including amyloid beta (Aβ) and tau proteins [23] [24]. Impairment of this clearance mechanism is now recognized as a significant contributor to the abnormal protein accumulation characteristic of many neurodegenerative disorders.
In response to the critical need for non-invasive assessment methods, advanced magnetic resonance imaging (MRI) techniques have emerged as powerful tools for evaluating glymphatic function in living humans. Among these, Diffusion Tensor Imaging Analysis Along the Perivascular Space (DTI-ALPS) and perivascular space (PVS) MRI have gained prominence as promising, contrast-free approaches for quantifying glymphatic activity [24] [22]. These techniques leverage the unique anatomical organization of perivascular spaces and the directional movement of water molecules within them to generate indices of glymphatic function. The integration of these imaging biomarkers into clinical research protocols offers unprecedented opportunities to investigate glymphatic dysfunction across the spectrum of neurological disorders, from stroke and epilepsy to neurodegenerative conditions, potentially enabling earlier diagnosis and intervention [25] [26] [27].
Technical Foundations of DTI-ALPS
Biophysical Principles and Computational Framework
The DTI-ALPS method leverages the unique anatomical configuration of perivascular spaces (PVS) that run parallel to medullary veins in the cerebral white matter, approximately perpendicular to the lateral ventricles [23] [28]. At this specific location, three dominant directional components intersect: (1) the perivascular spaces (and medullary veins) oriented primarily in the right-left (x-axis) direction; (2) the superior-inferior (z-axis) oriented projection fibers; and (3) the anterior-posterior (y-axis) oriented association fibers [23]. This geometric arrangement enables the computation of an index that emphasizes water diffusion along the perivascular spaces while accounting for diffusion along the other two orthogonal axes.
The foundational equation for calculating the DTI-ALPS index is:
DTI-ALPS = (mean of Dxproj and Dxassoc) / (mean of Dyproj and Dzassoc)
In this formula, Dxproj represents the diffusivity along the x-axis (right-left) in the region dominated by projection fibers (superior-inferior oriented), while Dxassoc represents diffusivity along the x-axis in the region dominated by association fibers (anterior-posterior oriented). Conversely, Dyproj represents diffusivity along the y-axis in the projection area, and Dzassoc represents diffusivity along the z-axis in the association area [23]. The underlying assumption is that increased water mobility specifically along the perivascular spaces (x-axis), relative to diffusivity in directions perpendicular to the dominant fiber orientations, reflects more robust glymphatic function [23] [28].
Evolution of Computational Methodologies
Initial implementations of DTI-ALPS relied on manual placement of regions of interest (ROIs), which introduced operator dependency and limited reproducibility. Recent advances have focused on developing automated pipelines to enhance standardization and enable large-scale application [23]. These automated approaches typically use image registration in software platforms like FSL to consistently place spherical ROIs of 5-mm radius in an axial plane slightly distal to the top of the lateral ventricles, where the medullary veins run left-right [23].
Methodological refinements have further improved the reliability of DTI-ALPS measurements. One significant modification involves replacing mean with median values for diffusivity calculations to reduce outlier effects [23]. Additionally, implementing direction-based voxel selection excludes voxels with primary diffusion directions misaligned with the expected orientation of the corticospinal and association tracts, minimizing contamination from adjacent structures or ventricular spaces [23]. These technical enhancements have demonstrated improved consistency in measurements across different MRI protocols and scanner vendors, with intraclass correlation coefficients (ICCs) supporting good agreement in multi-scanner studies [23].
Figure 1: Computational Workflow for DTI-ALPS Index Calculation. The pipeline begins with DTI acquisition and preprocessing, followed by automated ROI placement, directional diffusivity calculation, and final ALPS index computation. Key methodological refinements include direction-based voxel selection and median-based calculations to improve reliability.
Advanced PVS MRI Methodologies
Segmentation and Quantification Approaches
The assessment of perivascular spaces (PVS) using structural MRI has evolved significantly with the advent of automated segmentation algorithms that enable precise quantification of PVS burden. Deep learning approaches, particularly those utilizing U-Net architectures, have demonstrated remarkable efficacy in segmenting PVS from conventional T1-weighted and T2-weighted MRI sequences [26]. One such implementation, PINGU (Perivascular-Space Identification Nnunet for Generalized Usage), applies a specialized deep-learning algorithm to automatically segment PVS and calculate PVS volume fraction (PVS-VF), defined as the proportion of PVS volume relative to the total volume of the region of interest [26].
Quantification typically focuses on specific anatomical compartments, primarily the basal ganglia (BG) and cerebral white matter (WM), which exhibit distinct PVS characteristics and clinical correlations. The analytical workflow involves calculating PVS volume fraction separately for these regions, followed by statistical modeling with diagnostic group as the independent variable of interest [26]. Additional regional analyses can include temporal lobe-specific assessments, particularly in conditions like temporal lobe epilepsy, where hemispheric asymmetries may provide pathological insights [26].
Multi-modal Integration and Analytical Frameworks
Advanced PVS analysis increasingly incorporates multi-modal imaging data to enhance pathophysiological interpretation. This integrated approach typically combines PVS metrics with complementary imaging biomarkers, including white matter hyperintensity (WMH) burden from FLAIR sequences, free water (FW) mapping from diffusion MRI, and choroid plexus volume fraction (CPVF) from structural T1-weighted images [29]. The combination of these measures provides a more comprehensive assessment of glymphatic function and its structural correlates.
The field is also moving toward more sophisticated analytical frameworks that account for topological distribution patterns of PVS beyond simple volumetric measures. Some recent methodologies generate spatial probability maps of PVS distribution and apply graph theory analyses to characterize PVS networks [26] [22]. These advanced approaches aim to capture not only the burden of PVS but also their spatial organization and potential implications for fluid transport efficiency throughout the brain.
Experimental Protocols and Validation Studies
Implementation in Large-Scale Population Studies
The application of DTI-ALPS in large-scale population studies has demonstrated both the feasibility and clinical relevance of this glymphatic imaging biomarker. The Mayo Clinic Study of Aging (MCSA), a population-based sample of Olmsted County, Minnesota, implemented an automated DTI-ALPS pipeline in 2,715 participants aged 30+ years with cross-sectional diffusion MRI [23]. The methodology was rigorously validated through a crossover study design where 81 participants underwent scanning on both GE and Siemens scanners within a two-day period, confirming that with appropriate processing modifications, consistent DTI-ALPS measurements can be obtained across different scanner platforms and protocols [23].
The statistical approaches employed in these large-scale studies typically incorporate linear mixed effects models to evaluate predictors of longitudinal DTI-ALPS changes while adjusting for potential confounders such as age and sex [23]. The MCSA analysis revealed several key findings: DTI-ALPS showed negative correlations with age, vascular risk factors, and white matter hyperintensity burden, while demonstrating positive correlations with cognitive scores and higher values in females compared to males [23]. Notably, in longitudinal models, white matter hyperintensities explained the greatest variability in the decline of DTI-ALPS, suggesting a strong association with vascular dysfunction rather than Alzheimer's disease pathology [23].
Application in Neurodegenerative Disease Cohorts
Multiple research groups have implemented DTI-ALPS protocols in dedicated neurodegenerative disease cohorts to elucidate the role of glymphatic dysfunction in specific conditions. In Parkinson's disease (PD) research, studies have categorized participants into prodromal PD (pPD), de novo PD (dnPD), and healthy control (HC) groups, further stratified by age to account for the known negative correlation between ALPS index and aging [27]. The imaging protocol typically includes 3T MRI with standardized DTI acquisitions, often supplemented by clinical assessments using Unified Parkinson's Disease Rating Scale (UPDRS) parts II and III, Hoehn and Yahr (H-Y) staging, and Montreal Cognitive Assessment (MoCA) [27].
Statistical analyses in these studies employ ANCOVA models to test for group differences in ALPS index while controlling for age, with subsequent correlation analyses to examine relationships between ALPS index and clinical measures [27]. False discovery rate (FDR) correction is commonly applied to account for multiple comparisons. In the PD cohort, results demonstrated a significant interaction effect between age subgroup and diagnostic status on the ALPS index, with older PD participants (≥65 years) showing more pronounced glymphatic dysfunction [27]. Longitudinal analysis further revealed that a lower baseline ALPS index predicted progression of both motor and non-motor symptoms in pPD patients, suggesting its potential utility as a prognostic biomarker [27].
Table 1: Key DTI-ALPS Findings Across Neurological Disorders
| Condition | Sample Size | Key Findings | Clinical Correlations |
|---|---|---|---|
| Alzheimer's Disease & Lewy Body Disease [28] | DLB (N=32), AD (N=14), MCI-LB (N=31), MCI-AD (N=31), HC (N=48) | Significantly lower DTI-ALPS in DLB vs HC (Estimate=-0.084, p=0.004); Lower in MCI-LB vs HC (Estimate=-0.058, p=0.047) | Associated with baseline (t[147]=2.22, p=0.028) and longitudinal cognitive decline (t[127]=2.41, p=0.017); Correlated with plasma NfL (t[141]=-2.72, p=0.007) and GFAP (t[141]=-2.83, p=0.005) |
| Ischemic Stroke [25] | 5 cohorts (n=29-120 per cohort) | Early ipsilesional ALPS depression with partial recovery over weeks to months; AUC for early cognitive impairment: 0.868 (sensitivity 96%, specificity 66%) | Correlated with MoCA (r≈0.43-0.56); Predictive of poor 6-month outcome (AUC=0.786); In lacunar stroke, higher baseline ALPS related to lower dementia risk (HR≈0.33) |
| Parkinson's Disease [27] | pPD (N=91), dnPD (N=183), HC (N=89) | Significant main effects of age (F=15.743, p<0.001) and diagnosis (F=8.453, p<0.001) on ALPS; Significant interaction (F=5.081, p=0.007) | In dnPD, correlated with PDSS (r=0.184, p=0.014), H-Y stage (r=-0.186, p=0.012), PDNMS (r=-0.176, p=0.018); In older dnPD, correlated with UPDRS-III (r=-0.299, p=0.025) |
| β-Thalassemia Major [29] | β-TM (N=35), HC (N=40) | Significantly lower bilateral ALPS (1.4087 vs 1.4884, p=0.001); Higher choroid plexus volume fraction (1.0731 vs 0.9095, p=0.01) | Lower ALPS associated with poorer cognitive performance across multiple domains (p<0.05) |
| Epilepsy [26] | Epilepsy (N=467), HC (N=473) | Not applicable (DTI-ALPS not measured) | Increased PVS volume fraction in basal ganglia across all epilepsy subtypes (101%-140%, effect size=0.95-1.37, p<3.77×10⁻¹⁵) |
Standardized Acquisition Parameters
The reproducibility of DTI-ALPS measurements depends critically on consistent MRI acquisition parameters across sites and scanners. The following table summarizes typical protocol specifications implemented in recent multi-scanner studies:
Table 2: Standardized DTI Acquisition Protocols for Glymphatic Imaging
| Parameter | GE Scanner Protocol | Siemens Scanner Protocol |
|---|---|---|
| Spatial Resolution | 2.7 mm across slices | 2.0 mm isotropic voxels |
| Field of View | 350 × 350 × 159 mm | 232 × 232 × 162 mm |
| Echo Time (TE) | 68 ms | 71 ms |
| Repetition Time (TR) | 10,200 ms | 3,400 ms |
| Diffusion Weightings | 5 b=0 volumes + 41 b=1000 s/mm² directions | Multiband acceleration factor=3; 3 shells (13 b=0, 6 b=500, 48 b=1000, 60 b=2000 s/mm²) |
| Special Considerations | No angulation to avoid eddy interactions | Directions evenly interspersed in time |
The Scientist's Toolkit: Research Reagent Solutions
Table 3: Essential Methodological Components for Glymphatic System MRI Research
| Component | Function/Description | Implementation Examples |
|---|---|---|
| Diffusion MRI Acquisition | Measures directional water mobility in perivascular spaces | 3T scanners (GE, Siemens); Multi-shell protocols; Isotropic voxels (2.0-2.7mm) [23] |
| Automated ROI Placement | Standardizes region selection for DTI-ALPS computation | FSL registration tools; 5-mm radius spheres at lateral ventricles; Direction-based voxel exclusion [23] |
| PVS Segmentation Algorithms | Quantifies perivascular space burden from structural MRI | PINGU (deep learning U-Net); White matter and basal ganglia compartment analysis; PVS volume fraction calculation [26] |
| Free Water Mapping | Estimates extracellular fluid increases reflecting impaired clearance | DTI-based free water elimination models; Correlation with cognitive performance [29] |
| Choroid Plexus Segmentation | Measures choroid plexus volume as CSF production source | Automated segmentation from T1-weighted MRI; Choroid plexus volume fraction calculation [29] |
| Multi-modal Integration | Combines glymphatic metrics with other biomarkers | White matter hyperintensity burden; Amyloid-PET; Tau-PET; Plasma biomarkers (NfL, GFAP) [23] [28] |
Emerging Technical Innovations
Voxel-Wise DTI-ALPS Mapping
A significant limitation of conventional DTI-ALPS methodology is its restriction to specific regions of interest near the lateral ventricles, which provides only a partial view of glymphatic function throughout the brain. In response to this constraint, researchers have developed a novel voxel-based DTI-ALPS mapping approach that enables comprehensive visualization and quantification of the ALPS index across the entire cerebral white matter [30]. This innovative technique segments white matter fibers into multiple distinct regions (typically 30 separate areas) and computes ALPS values for each voxel, generating a whole-brain glymphatic function map [30].
The voxel-wise mapping method has demonstrated superior sensitivity in detecting group differences associated with cognitive decline compared to the conventional ROI-based approach [30]. Initial validation studies have confirmed strong consistency between the mean ALPS values derived from voxel-wise mapping and those obtained through traditional methods, supporting its reliability while offering a more detailed perspective on regional variations in glymphatic function [30]. This technical advancement represents a substantial step forward in glymphatic imaging, potentially enabling researchers to identify specific spatial patterns of glymphatic dysfunction associated with different neurological disorders and track their progression over time.
Multi-modal Biomarker Integration
The field is increasingly moving toward integrated analytical frameworks that combine DTI-ALPS with complementary imaging and fluid biomarkers to enhance pathophysiological interpretation. This multi-modal approach typically incorporates free water (FW) mapping to quantify extracellular fluid increases, perivascular space volume fraction (PVSVF) from structural MRI, choroid plexus volume fraction (CPVF) as a measure of CSF production capacity, and white matter hyperintensity (WMH) burden as an indicator of small vessel disease [29]. The combination of these metrics provides a more comprehensive assessment of glymphatic system structure and function.
Beyond imaging, researchers are increasingly correlating DTI-ALPS measurements with plasma biomarkers such as neurofilament light (NfL) chain as a marker of axonal injury, and glial fibrillary acidic protein (GFAP) as an indicator of astrocytic activation [28]. Studies in Lewy body disease have demonstrated significant associations between lower DTI-ALPS values and higher levels of both NfL (t[141]=-2.72, p=0.007) and GFAP (t[141]=-2.83, p=0.005), suggesting links between glymphatic dysfunction and neuronal damage [28]. This multi-modal integration strengthens the biological validity of DTI-ALPS as a meaningful indicator of brain health and provides a more nuanced understanding of its relationship to neurodegenerative processes.
DTI-ALPS and PVS MRI techniques represent significant advances in the non-invasive assessment of the human glymphatic system, offering researchers powerful tools to investigate brain fluid dynamics in health and disease. While methodological standardization remains a challenge, ongoing technical refinements in automated processing, multi-modal integration, and whole-brain mapping approaches are steadily enhancing the reliability and information content of these biomarkers. The consistent demonstration of glymphatic dysfunction across diverse neurological conditions, coupled with its association with clinical symptoms and disease progression, underscores the fundamental importance of fluid clearance mechanisms in brain pathophysiology. As these imaging techniques continue to evolve and validate against more direct measures of glymphatic function, they hold substantial promise for accelerating therapeutic development aimed at enhancing waste clearance and potentially modifying the course of neurodegenerative diseases.
Neuroimaging technologies have transitioned from purely research-oriented tools to indispensable assets in the clinical drug development pipeline. In an era where central nervous system (CNS) disorders represent the leading cause of global disability [31] and drug development faces formidable challenges including high failure rates and disease heterogeneity, neuroimaging provides critical quantitative biomarkers that objectively measure drug effects on the brain. The current Alzheimer's disease (AD) drug development pipeline alone hosts 182 trials involving 138 drugs, with biomarkers serving as primary outcomes in 27% of active trials [32]. This technical guide examines how non-invasive imaging modalities—including structural and functional MRI, PET, and emerging optical techniques—are systematically de-risking drug development from target identification through clinical validation. By enabling precise patient stratification, demonstrating target engagement, and providing early indicators of treatment efficacy, neuroimaging technologies are fundamentally enhancing the precision, efficiency, and success rates of CNS therapeutic development.
The development of therapeutics for central nervous system disorders presents unique challenges that have historically contributed to high failure rates in clinical trials. The blood-brain barrier (BBB) prevents more than 98% of small-molecule drugs and all macromolecular therapeutics from accessing the brain [31], creating significant hurdles for drug delivery. Additionally, the complex pathophysiology and heterogeneity of CNS disorders complicate both diagnostic precision and the measurement of therapeutic response.
Neuroimaging addresses these challenges by providing non-invasive, quantifiable biomarkers that can be leveraged throughout the drug development lifecycle. These biomarkers enable researchers to:
- Establish biodistribution of therapeutic agents within the CNS
- Verify target engagement and mechanism of action
- Monitor pharmacodynamic effects and biological responses
- Identify patient subgroups most likely to respond to treatment
- Provide objective efficacy endpoints that may detect signals earlier than clinical assessments
The growing importance of neuroimaging is reflected in the current AD drug development pipeline, where 73% of agents are disease-targeted therapies (DTTs) relying heavily on biomarker evidence [32]. Furthermore, the repurposing of existing agents for new CNS indications—representing 33% of the AD pipeline—frequently utilizes neuroimaging to demonstrate novel mechanisms of action in the brain [32].
Neuroimaging Modalities: Technical Specifications and Applications
Different neuroimaging modalities offer complementary strengths for assessing brain structure, function, and molecular activity. The table below summarizes the key technical aspects of primary modalities used in drug development contexts.
Table 1: Neuroimaging Modalities in CNS Drug Development
| Modality | Measured Parameter | Spatial Resolution | Temporal Resolution | Primary Applications in Drug Development |
|---|---|---|---|---|
| sMRI | Brain anatomy and tissue density | Sub-millimeter | Static (single time point) | Measuring atrophy rates, tumor volume, surgical planning [33] |
| fMRI | BOLD signal (cerebral blood flow) | 1-3 mm | 1-3 seconds | Mapping functional connectivity, task-based brain activation, network dynamics [34] [33] |
| DWI/DTI | Water molecule diffusion | 1-3 mm | Static (single time point) | Assessing white matter integrity, structural connectivity, axonal injury [33] |
| PET | Radioligand binding and distribution | 3-5 mm | Minutes to hours | Quantifying target engagement, receptor occupancy, metabolic activity (FDG) [34] [35] |
| EEG | Electrical activity | ~10 mm | Milliseconds | Measuring neural oscillations, seizure activity, event-related potentials [33] |
| MEG | Magnetic fields from neural activity | 3-5 mm | Milliseconds | Localizing epileptic foci, mapping functional networks with high temporal precision [33] |
| fNIRS | Hemodynamic changes | 1-3 cm | 1-5 seconds | Monitoring cortical activation patterns in naturalistic settings [33] |
Advanced Methodological Considerations
The integration of multiple imaging modalities—such as PET/MRI systems—enables simultaneous assessment of brain structure, function, and molecular targets. This multimodal approach provides a more comprehensive picture of drug effects than any single modality alone. For example, combining fMRI's detailed functional mapping with PET's molecular specificity allows researchers to correlate target engagement with downstream effects on neural circuitry [33] [35].
Modern analytical frameworks for neuroimaging data must address several unique challenges: the extremely high dimensionality of data (often comprising millions of data points per subject), complex spatiotemporal structures, heterogeneity across subjects and sites, and the need to integrate imaging data with genetic, clinical, and biomarker data [33]. Statistical learning methods have evolved to address these challenges through dimensional reduction techniques, object-oriented data analysis, and sophisticated integration pipelines that can establish causal pathways linking genetics to imaging phenotypes and clinical outcomes [33].
Strategic Applications Across the Drug Development Pipeline
Target Validation and Engagement
Neuroimaging provides critical human validation for targets identified in preclinical models. PET imaging with target-specific radioligands can directly demonstrate that a drug candidate engages its intended biological target in the human brain at physiologically relevant concentrations. For example, the 5-HT2A receptor agonist PET ligand [¹¹C]Cimbi-36 has been used to establish that the acute subjective effects of psilocybin (through its active metabolite psilocin) are directly related to its binding at 5-HT2A receptors [35]. This approach provides unambiguous evidence of target engagement that can help prioritize compounds for further development.
Table 2: Molecular Imaging Targets for CNS Drug Development
| Therapeutic Area | Molecular Target | PET Radioligand Examples | Application in Drug Development |
|---|---|---|---|
| Alzheimer's Disease | Amyloid-beta plaques | [¹¹C]PIB, [¹⁸F]Flutemetamol, [¹⁸F]Florbetapir | Patient stratification, monitoring plaque reduction [32] |
| Alzheimer's Disease | Tau tangles | [¹⁸F]Flortaucipir, [¹⁸F]MK-6240 | Tracking pathology spread, correlation with cognitive decline [32] |
| Psychedelic Therapy | 5-HT2A receptors | [¹¹C]Cimbi-36, [¹⁸F]Altanserin, [¹¹C]MDL100907 | Establishing mechanism of action, dose-occupancy relationships [35] |
| Neuroinflammation | TSPO protein | [¹¹C]PK-11195, [¹¹C]PBR28 | Monitoring microglial activation, inflammatory responses [34] |
| Dopaminergic System | D2/D3 receptors | [¹¹C]Raclopride, [¹¹C]PHNO | Assessing dopamine release, antipsychotic drug occupancy [35] |
Experimental Protocol: Establishing Target Engagement with PET
Objective: To quantify the target occupancy of a novel CNS drug candidate at its intended molecular target.
Methodology:
- Participant Selection: Recruit healthy volunteers or patients with the target disorder confirmed via appropriate diagnostic criteria.
- Baseline PET Scan: Perform PET imaging with a target-specific radioligand before drug administration to establish baseline binding potential (BPND).
- Drug Administration: Administer the investigational drug at predetermined doses.
- Post-Dose PET Scanning: Conduct follow-up PET scans at predetermined time points (e.g., at expected Tmax and 24 hours post-dose).
- Data Analysis:
- Calculate binding potential (BPND) in target regions of interest (ROIs) using appropriate reference regions
- Determine target occupancy as: Occupancy (%) = [(BPNDbaseline - BPNDpostdose)/BPND_baseline] × 100
- Establish relationship between plasma concentration and target occupancy
Key Considerations: Radiotracer selection should prioritize high specificity for the target and appropriate kinetic properties. Dose-ranging should include sub-therapeutic to supra-therapeutic levels to model the full occupancy curve. This protocol directly addresses the critical proof-of-pharmacology question early in clinical development [35].
Figure 1: Target Engagement Study Workflow
Patient Stratification and Enrichment
Neuroimaging biomarkers enable precision medicine approaches by identifying patient subgroups most likely to respond to specific therapeutic mechanisms. In Alzheimer's disease trials, amyloid PET and tau PET have become essential tools for enriching study populations with patients who have biomarker-confirmed disease pathology, thereby reducing heterogeneity and increasing the likelihood of detecting treatment effects [32]. Similarly, in neuro-oncology, MRI biomarkers help stratify patients based on tumor characteristics that may predict response to specific therapeutic approaches [36].
The strategic value of imaging-based enrichment is substantial: by reducing sample size requirements and increasing statistical power, these approaches can decrease development costs and accelerate timelines. The 2025 AD pipeline analysis notes that biomarkers play crucial roles in determining trial eligibility, with specific molecular imaging signatures often required for participant inclusion [32].
Experimental Protocol: Imaging-Based Patient Stratification in Alzheimer's Trials
Objective: To identify and enroll patients with biomarker evidence of Alzheimer's disease pathology for clinical trial participation.
Methodology:
- Prescreening: Identify potential participants based on clinical criteria (e.g., MCI or mild dementia).
- Amyloid PET Imaging: Perform amyloid PET scanning using an FDA-approved radiotracer.
- Image Analysis:
- Quantitative: Calculate standardized uptake value ratio (SUVR) relative to a reference region (e.g., cerebellar gray matter)
- Qualitative: Trained readers assess scan positivity based on established visual read criteria
- Stratification: Classify participants as amyloid-positive (eligible) or amyloid-negative (excluded) based on predefined SUVR thresholds.
- Optional Additional Biomarkers: Include tau PET or volumetric MRI for further stratification or as secondary endpoints.
Key Considerations: Standardized acquisition protocols and centralized reading minimize variability across sites. Thresholds for positivity should be established a priori based on validated cutpoints against amyloid status confirmed by other biomarkers (e.g., CSF) or autopsy [32].
Measuring Pharmacodynamic Effects and Treatment Response
Beyond establishing target engagement, neuroimaging can demonstrate that engagement with the biological target translates to meaningful changes in brain structure, function, or pathology. Functional MRI has been particularly valuable for mapping drug effects on brain networks and task-based activation patterns. In psychedelic drug development, fMRI has revealed that compounds like psilocybin and LSD produce profound alterations in brain network connectivity, characterized by increased functional integration and decreased segregation of major brain networks [35]. These functional changes provide mechanistic insights that help explain clinical effects.
In Alzheimer's disease trials, serial volumetric MRI measures of hippocampal atrophy rate can serve as a sensitive marker of disease modification, potentially requiring smaller sample sizes than clinical endpoints to demonstrate slowing of neurodegeneration [32]. Similarly, in multiple sclerosis trials, MRI measures of lesion formation and brain volume loss provide objective evidence of treatment effects on disease activity.
Experimental Protocol: Assessing Functional Connectivity Changes with fMRI
Objective: To quantify changes in resting-state functional connectivity following therapeutic intervention.
Methodology:
- Study Design: Implement a longitudinal design with pre-treatment and post-treatment scanning sessions.
- fMRI Acquisition: Collect resting-state BOLD fMRI data (e.g., 10-minute scan with eyes open, fixating on a cross).
- Preprocessing:
- Realignment and motion correction
- Spatial normalization to standard template
- Nuisance regression (motion parameters, white matter, CSF signals)
- Band-pass filtering (typically 0.01-0.1 Hz)
- Network Analysis:
- Define regions of interest based on established atlases
- Extract mean time series from each region
- Compute correlation matrices between all region pairs
- Apply Fisher's z-transform to correlation coefficients
- Statistical Analysis:
- Compare pre- vs. post-treatment connectivity matrices using network-based statistics
- Examine correlations between connectivity changes and clinical outcomes
Key Considerations: Strict motion control is critical, with exclusion criteria for excessive head movement. The choice of parcellation scheme (e.g., fine-grained vs. broad regions) should align with the specific hypotheses [33] [35].
Figure 2: Functional Connectivity Assessment
The Scientist's Toolkit: Essential Research Reagents and Materials
Successful implementation of neuroimaging in drug development requires specialized reagents, equipment, and analytical tools. The following table details key components of the neuroimaging toolkit.
Table 3: Essential Research Reagents and Materials for Neuroimaging Studies
| Category | Specific Items | Function/Application | Technical Notes |
|---|---|---|---|
| PET Radiotracers | [¹¹C]Cimbi-36, [¹¹C]PIB, [¹⁸F]FDG, [¹¹C]Raclopride | Target engagement, metabolic activity, neurotransmitter release | Short-lived isotopes ([¹¹C], t½=20 min) require on-site cyclotron; [¹⁸F] (t½=110 min) allows regional distribution [35] |
| MRI Contrast Agents | Gadolinium-based agents, Superparamagnetic iron oxide nanoparticles (SPIONs) | Enhancing structural lesions, blood-brain barrier integrity, tracking cellular migration | SPIONs show promise for molecular imaging when conjugated to targeting moieties (e.g., Aβ antibodies) [34] |
| Image Analysis Software | FSL, FreeSurfer, SPM, AFNI, CONN | Processing structural and functional data, volumetric segmentation, connectivity analysis | Open-source platforms facilitate method standardization and replication; cloud-based implementations enable multi-site studies [33] |
| Data Management Platforms | XNAT, LORIS, COINS | Centralized storage, quality control, and distribution of imaging data | Critical for maintaining data integrity in multi-center trials; often include automated QC pipelines [33] |
| Phantom Test Objects | MRI geometric phantoms, PET resolution phantoms, FDG dose calibrators | Quality assurance, cross-site standardization, longitudinal calibration | Essential for multi-center trials to ensure consistent data acquisition across different scanner models and sites [33] |
Future Directions and Emerging Applications
The field of neuroimaging in drug development continues to evolve with several promising trends shaping its future application. Multimodal integration approaches that combine data from multiple imaging techniques (e.g., PET/MRI simultaneous acquisition) are providing more comprehensive assessments of drug effects by linking molecular targeting with functional and structural consequences [33]. Artificial intelligence and machine learning methods are being increasingly applied to extract subtle imaging signatures that predict treatment response or disease progression, potentially identifying novel biomarkers beyond conventional region-of-interest analyses [33] [31].
The development of novel radiotracers for previously "undruggable" targets continues to expand the utility of molecular imaging. In the psychedelic therapy domain, the recent availability of agonist radiotracers like [¹¹C]Cimbi-36 has enabled more accurate assessment of 5-HT2A receptor engagement than was possible with previous antagonist tracers [35]. Similar advances are needed for other target classes to further enhance the precision of target engagement studies.
Emerging ultrasound-mediated blood-brain barrier opening techniques in combination with neuroimaging are creating new opportunities for CNS drug delivery [31]. MRI-guided focused ultrasound can temporarily disrupt the BBB in precise locations, permitting entry of therapeutic agents that would otherwise be excluded, with real-time monitoring of both the procedure and its effects.
The growing recognition of neuroimaging's value is reflected in its expanding application across therapeutic areas. From its established role in neurodegenerative disease trials, neuroimaging is now being deployed in psychedelic-assisted therapy, neuro-oncology, neuroinflammation, and neurodevelopmental disorders. This expansion underscores the versatile role of imaging biomarkers in de-risking drug development across the spectrum of CNS disorders.
Neuroimaging technologies have fundamentally transformed CNS drug development by providing objective, quantifiable biomarkers that address key points of failure in the therapeutic pipeline. From initial target validation through clinical proof-of-concept, imaging biomarkers enable more informed decision-making, reduce clinical trial heterogeneity, and provide mechanistic insights that strengthen the chain of evidence from target engagement to clinical outcome. The systematic integration of these technologies—including structural and functional MRI, molecular PET, and emerging multimodal approaches—represents a powerful strategy for de-risking the complex process of bringing new CNS therapies to patients. As imaging technologies continue to advance in resolution, specificity, and analytical sophistication, their pivotal role in illuminating the path from molecular target to meaningful clinical benefit will only expand, ultimately accelerating the development of effective treatments for the many neurological and psychiatric disorders that remain areas of high unmet medical need.
Practical Applications in Research and Clinical Trial Contexts
In the development of central nervous system (CNS) therapeutics, pharmacodynamic (PD) biomarkers are objectively measured indicators that provide crucial evidence of a drug's biological activity on its intended target within the brain [37]. These biomarkers serve as a direct bridge between a compound's administration and its interaction with the pathological processes it aims to modify. Unlike diagnostic biomarkers, which identify the presence of a disease, PD biomarkers confirm that a drug has successfully engaged its target and is modulating the intended biological pathway [37] [38]. This confirmation is especially critical in neurodegenerative and psychiatric disorders, where the gap between animal models and human pathophysiology is wide, and clinical endpoints may take years to manifest.
The value chain of PD biomarkers spans from early preclinical development through late-stage clinical trials, addressing several fundamental questions in drug development [38] [2]. First, they provide evidence of brain penetration, confirming that a therapeutic agent can cross the blood-brain barrier (BBB) and reach pharmacologically relevant concentrations at its site of action. Second, they demonstrate target engagement, verifying that the drug binds to and modulates its intended molecular target. Third, they establish proof of mechanism by showing that target engagement translates to modulation of downstream biological pathways [38]. This information is indispensable for dose selection, go/no-go decisions, and optimizing clinical trial designs.
Table 1: Categories and Functions of Biomarkers in CNS Drug Development
| Biomarker Category | Measurement Timing | Primary Function | Representative Examples |
|---|---|---|---|
| Pharmacodynamic | Baseline and on-treatment | Demonstrate biological activity of drug; confirm target engagement | CSF sTREM2 reduction; LRRK2 degradation in PBMCs; EEG/ERP changes |
| Prognostic | Baseline only | Identify likelihood of clinical event or disease progression | Total CD8+ count in tumors; APOE genotype in Alzheimer's |
| Predictive | Baseline only | Identify patients most likely to benefit from specific treatment | PD-L1 expression for checkpoint inhibitors |
| Safety | Baseline and on-treatment | Monitor likelihood, presence, or extent of toxicity | IL6 for cytokine release syndrome |
The Role of PD Biomarkers in the Drug Development Continuum
The "five-star matrix" framework offers a comprehensive approach to translational drug discovery, consisting of five critical dimensions: (1) biodistribution, (2) target binding/occupancy, (3) proximal effect, (4) biological effect, and (5) disease effect [38]. PD biomarkers operate across these dimensions, creating a continuum from initial compound exposure to clinically relevant outcomes. This framework enables researchers to test hypotheses systematically from early target assessment through clinical studies, with biomarkers serving as the evidentiary foundation at each stage.
In the context of biodistribution, PD biomarkers answer the fundamental question: "Have pharmacologically relevant drug concentrations been achieved at the target site in the brain over the desired period?" [38] This is particularly challenging for CNS targets, where the BBB presents a formidable obstacle. For target binding and occupancy, the key question becomes: "Can target binding be demonstrated in a physiological and disease-relevant setting?" Target engagement does not guarantee functional efficacy, but its absence invariably predicts therapeutic failure [38]. The third dimension addresses proximal effects: "Have endpoints related to the primary pharmacology been measured in the most relevant systems?" These endpoints represent the most direct functional consequences of target activity [38].
The transition from preclinical models to human studies represents the most significant challenge in CNS drug development. PD biomarkers serve as essential bridging tools, providing quantitative readouts that are translatable across species [38]. When a biomarker response observed in animal models is replicated in human studies, it significantly de-risks subsequent development phases and provides compelling evidence that the drug is engaging its intended target and producing the expected biological effects [2].
Non-Invasive Brain Imaging Modalities for PD Biomarker Assessment
Molecular Imaging with Positron Emission Tomography (PET)
PET imaging represents the gold standard for directly measuring target occupancy in the living human brain [2]. This technique utilizes radioactive ligands (tracers) that bind specifically to molecular targets of interest. When a drug candidate competes with these tracers for the same binding site, it reduces the PET signal in a dose-dependent manner, allowing researchers to quantify the percentage of target occupancy achieved at different dose levels [2]. This approach provides direct evidence of brain penetration and target engagement at a molecular level.
The development of novel PET probes is expanding the utility of this technique for assessing target engagement in neurodegenerative and neurodevelopmental disorders [39]. For example, researchers are developing probes targeting the GluN2B subunit of NMDA receptors for Alzheimer's disease and vasopressin receptors for autism spectrum disorder [39]. These tools enable non-invasive quantification of target expression and distribution in the living brain, providing insights otherwise inaccessible for biochemical analysis. However, PET imaging has limitations, including the high cost and lengthy development process for novel tracers, limited temporal resolution, and radiation exposure concerns that restrict repeated measurements [2].
Functional Imaging with fMRI and EEG
Functional magnetic resonance imaging (fMRI) and electroencephalography (EEG) provide complementary approaches to assessing target engagement at a systems level rather than a molecular level [2]. While PET measures direct binding to specific molecular targets, functional neuroimaging modalities capture the downstream consequences of target engagement on brain activity, connectivity, and network function.
fMRI measures changes in blood oxygenation level dependent (BOLD) signals that correlate with neural activity, providing excellent spatial resolution for localizing drug effects across brain networks [2]. Task-based fMRI can probe specific cognitive, emotional, or sensory processes known to engage particular brain circuits, while resting-state fMRI assesses spontaneous fluctuations in brain activity that reveal intrinsic functional connectivity networks. EEG records electrical activity from the scalp with millisecond temporal resolution, capturing rapid neural dynamics that may be modulated by pharmacological interventions [2]. Event-related potentials (ERPs) derived from EEG data reflect specific cognitive processes and have shown sensitivity to various drug classes.
These functional modalities can address all key pharmacodynamic questions—brain penetration, functional target engagement, dose-response relationships, and indication selection [2]. Unlike PET, they can detect functional effects even when the molecular target is unknown or lacks a specific tracer. However, they provide indirect measures of target engagement and may be influenced by numerous confounding factors unrelated to the drug's mechanism of action.
Table 2: Comparison of Non-Invasive Brain Imaging Modalities for PD Biomarkers
| Imaging Modality | Spatial Resolution | Temporal Resolution | Primary PD Application | Key Advantages | Key Limitations |
|---|---|---|---|---|---|
| PET | 1-4 mm | Minutes to hours | Direct target occupancy measurement | Direct molecular quantification; well-established for dose-occupancy relationships | Limited tracer availability; radiation exposure; high cost |
| fMRI | 1-3 mm | 1-3 seconds | Functional circuit engagement | Excellent spatial resolution; no radiation; widely available | Indirect measure of neural activity; confounded by vascular factors |
| EEG/ERP | ~10 mm | Milliseconds | Neural circuit dynamics | Direct neural electrical activity; excellent temporal resolution; low cost | Poor spatial resolution; sensitive to artifacts |
Fluid-Based PD Biomarkers in CNS Therapeutics
Cerebrospinal fluid (CSF) and blood-based biomarkers provide complementary molecular information to imaging modalities, offering insights into biochemical pathways modulated by therapeutic interventions. The advent of highly sensitive proteomic, metabolomic, and genomic technologies has significantly expanded the repertoire of fluid-based PD biomarkers for CNS applications.
In neurodegenerative diseases, CSF biomarkers are particularly valuable for demonstrating target engagement and pathway modulation, as they provide a window into biochemical processes within the CNS compartment [40] [41]. For example, in recent Phase 1 trials of ARV-102, a PROTAC LRRK2 degrader for Parkinson's disease, unbiased proteomic analyses of CSF revealed significant decreases in lysosomal pathway markers and neuroinflammatory microglial markers after 14 days of treatment [40]. These changes provided critical evidence of pathway engagement, demonstrating that LRRK2 degradation produced the intended biological effects on downstream processes known to be dysregulated in Parkinson's disease.
Microglia-focused therapeutic strategies have yielded several promising PD biomarkers [41]. Soluble TREM2 (sTREM2), a cleavage product of the microglial receptor TREM2, has emerged as a dynamic biomarker of microglial activation and a potential PD marker for TREM2-targeted therapies [41]. In clinical trials of TREM2-activating antibodies, dose-dependent reductions in CSF sTREM2 levels have served as evidence of target engagement, likely reflecting receptor internalization and degradation following antibody binding [41]. Other microglial biomarkers under investigation include progranulin (PGRN) for frontotemporal dementia and various cytokines and chemokines that reflect neuroinflammatory processes [41].
The emergence of blood-based PD biomarkers would represent a significant advancement for CNS drug development, given the invasiveness and practical limitations of repeated CSF sampling. While blood-brain barrier penetration complicates the interpretation of peripheral measurements, technological advances in detecting brain-derived proteins and vesicles in blood are progressing rapidly [41].
Experimental Protocols for PD Biomarker Assessment
Protocol for PET Target Occupancy Studies
Objective: To quantify the relationship between drug dose/plasma concentration and target occupancy in the human brain.
Methodology:
- Participant Selection: Healthy volunteers or patients (typically n=6-12 per dose level) screened for contraindications to PET scanning and study drug.
- Tracer Selection: Validate specificity, kinetics, and test-retest variability of radioligand for the target of interest.
- Study Design:
- Baseline scan to establish individual reference binding potential (BP~ND~)
- Post-dose scans at predetermined timepoints to capture peak and trough occupancy
- Multiple dose levels to characterize occupancy-dose relationship
- Arterial or reference region input function for quantitative modeling
- Image Acquisition & Analysis:
- Dynamic PET scanning for 60-120 minutes post-tracer injection
- Reconstruction with attenuation and scatter correction
- Quantification of binding parameters using validated compartmental models (e.g., simplified reference tissue model)
- Target occupancy calculated as: Occupancy (%) = [1 - (BP~ND~-postdose/BP~ND~-baseline)] × 100
Key Outputs: Dose-occupancy and plasma concentration-occupancy relationships; minimal pharmacologically active occupancy level; duration of target engagement [2].
Protocol for Functional MRI PD Biomarker Studies
Objective: To demonstrate dose-dependent modulation of brain circuit activity by an investigational drug.
Methodology:
- Participant Selection: Typically larger sample sizes than PET (n=20-40 per group) to detect functional effects.
- Task Paradigm: Selection of cognitive, emotional, or sensory tasks known to engage target neural circuits (e.g., working memory tasks for prefrontal cortex, emotional face processing for amygdala).
- Study Design:
- Randomized, placebo-controlled, crossover or parallel-group designs
- Multiple dose levels to characterize dose-response relationships
- Scanning sessions timed to coincide with peak plasma concentrations
- Include behavioral performance measures alongside imaging
- Image Acquisition:
- BOLD fMRI at 3T or higher field strength
- High-resolution structural scan for registration and normalization
- Task-based fMRI: block or event-related designs optimized for detection power
- Resting-state fMRI: 8-10 minutes of eyes-open fixation
- Data Analysis:
- Standard preprocessing pipelines (realignment, normalization, smoothing)
- General linear model for task fMRI; functional connectivity measures for resting-state
- Dose-response modeling of BOLD signal changes in target regions
Key Outputs: Dose-dependent modulation of target circuit activity; effect sizes for powering subsequent trials; relationship between circuit modulation and clinical outcomes [2].
Protocol for CSF Biomarker Assessment in Clinical Trials
Objective: To demonstrate target engagement and pathway modulation through molecular biomarkers in CSF.
Methodology:
- Participant Selection: Patients with the target disease; careful screening for contraindications to lumbar puncture.
- Sample Collection:
- Standardized lumbar puncture procedures (typically L3/L4 or L4/L5 interspace)
- Consistent timing relative to drug administration (trough and peak timepoints)
- Collection in polypropylene tubes to minimize protein adsorption
- Immediate processing: centrifugation, aliquoting, storage at -80°C
- Minimization of freeze-thaw cycles
- Biomarker Assays:
- Targeted immunoassays (ELISA, MSD) for specific proteins of interest
- Unbiased proteomics (LC-MS/MS) for discovery approaches
- Standard curves and quality controls in matched matrix
- Blinded sample analysis to prevent bias
- Experimental Design:
- Baseline (pre-dose) and multiple on-treatment sampling timepoints
- Place-controlled design to distinguish drug effects from disease progression
- Multiple dose levels to establish dose-response relationships
- Correlation with clinical and imaging measures
Key Outputs: Dose-dependent changes in target-relevant biomarkers; proof of pathway modulation; relationship between biomarker changes and clinical outcomes [40] [41].
The Scientist's Toolkit: Essential Research Reagents and Materials
Table 3: Essential Research Reagents for PD Biomarker Studies
| Reagent/Material | Function/Application | Examples/Specifications |
|---|---|---|
| Selective PET Tracers | Quantifying target occupancy and distribution | GluN2B antagonists for NMDAR imaging; vasopressin receptor ligands |
| Validated Antibodies | Immunoassays for fluid biomarkers; immunohistochemistry | TREM2 antibodies for microglial phenotyping; phospho-tau antibodies |
| CSF Collection Systems | Standardized biofluid sampling | Polypropylene collection tubes; protease inhibitor cocktails |
| ELISA/MSD Assay Kits | Quantifying specific protein biomarkers | sTREM2 ELISA kits; phospho-Rab10 assays for LRRK2 activity |
| EEG Cap Systems | High-density electrophysiology recording | 64-128 channel caps with amplified electrodes; ERP paradigms |
| fMRI Task Paradigms | Engaging specific neural circuits | Working memory n-back tasks; emotional face processing tasks |
| Data Analysis Pipelines | Processing neuroimaging data | SPM, FSL, FreeSurfer for fMRI; EEGLAB, FieldTrip for EEG |
Integration of PD Biomarkers in Clinical Development Strategy
Effective implementation of PD biomarkers requires strategic planning across all phases of drug development. In Phase 1 trials, PD biomarkers should be deployed to answer fundamental questions about brain penetration, target engagement, and dose-response relationships [2]. Traditionally underpowered Phase 1 studies often fail to provide definitive answers to these questions, resulting in the advancement of significant risk into later development phases. Adequately powered Phase 1 studies using functional neuroimaging can detect realistic effect sizes and establish dose-response relationships for brain effects, informing dose selection for subsequent trials [2].
In Phase 2 trials, PD biomarkers serve to validate the mechanism of action in the target patient population and establish relationships between target engagement and early clinical signals [37]. This is particularly important for diseases with slow progression, where clinical endpoints may require extended observation periods. Demonstrating that the drug produces the intended pharmacological effects on the target pathway in patients provides confidence to proceed to larger, longer, and more expensive Phase 3 trials.
The integration of multimodal PD biomarkers—combining imaging, fluid, and clinical measures—provides the most comprehensive assessment of target engagement and biological activity [2] [41]. For example, a TREM2-targeted therapy might combine PET imaging to demonstrate brain penetration, CSF sTREM2 measurements to confirm target engagement, and CSF proteomics to demonstrate broader effects on microglial and neuroinflammatory pathways [41]. This multidimensional approach creates a compelling chain of evidence linking drug exposure to target modulation and downstream biological effects.
Diagram 1: The Five-Dimension Framework for PD Biomarker Assessment. This workflow illustrates the sequential process from drug administration to clinical effect, with associated biomarker technologies mapped to each dimension.
The field of pharmacodynamic biomarkers for CNS therapeutics is rapidly evolving, driven by advances in neuroimaging technologies, molecular assays, and computational analytics. Several emerging trends are shaping the future landscape. First, the integration of artificial intelligence and machine learning with multimodal biomarker data is enabling more precise patient stratification and prediction of treatment response [41]. Second, the development of novel PET tracers for an expanding range of neurological targets is increasing the scope of direct target engagement assessment [39]. Third, advances in ultra-sensitive assay technologies are making blood-based biomarkers increasingly viable for monitoring CNS target engagement, potentially reducing reliance on CSF sampling [41].
The successful application of PD biomarkers requires careful consideration of their context of use, validation state, and fit-for-purpose in the drug development pipeline [37]. While ideal biomarkers are quantitatively precise, temporally dynamic, causally linked to the mechanism of action, and practically feasible for repeated measures, in practice, most biomarkers represent compromises among these attributes. Strategic deployment of PD biomarkers—whether for internal decision-making, dose selection, or regulatory purposes—should be guided by their specific evidentiary needs and validation status.
In conclusion, pharmacodynamic biomarkers for target engagement and brain penetration represent indispensable tools in the development of CNS therapeutics. By providing direct evidence of biological activity in the human brain, these biomarkers bridge the translational gap between preclinical models and clinical efficacy, de-risking drug development and accelerating the delivery of novel treatments for neurological and psychiatric disorders. As biomarker technologies continue to advance, their integration across the drug development continuum will be essential for realizing the promise of precision medicine in neuroscience.
The development of central nervous system (CNS) therapeutics is fraught with high failure rates, often due to an inability to conclusively demonstrate target engagement and establish an optimal dosing regimen in early-phase trials [42]. Functional neuroimaging techniques, specifically electroencephalography (EEG) and event-related potentials (ERP), and task-based functional magnetic resonance imaging (fMRI), provide powerful, non-invasive methods to address this challenge. These modalities enable the quantitative measurement of a drug's effects on brain activity, allowing researchers to model the relationship between drug dose and brain response [42]. This guide details the application of EEG/ERP and task-based fMRI for establishing dose-response relationships, a critical step in de-risking drug development and advancing precision psychiatry.
Core Physiological Principles and Signaling Pathways
Understanding the biological signals measured by each technique is fundamental to designing robust dose-response studies.
The fMRI Blood-Oxygen-Level-Dependent (BOLD) Signal
Task-based fMRI indirectly measures neural activity by detecting localized changes in blood flow, blood volume, and blood oxygenation that accompany neuronal firing. This is known as the Blood-Oxygen-Level-Dependent (BOLD) contrast [43] [44].
- Neurovascular Coupling: When a population of neurons becomes active, they consume energy, leading to a local increase in cerebral blood flow (CBF) that delivers oxygenated hemoglobin [43].
- The BOLD Effect: The influx of oxygenated hemoglobin causes a net decrease in the concentration of deoxygenated hemoglobin (dHb) in the local vasculature. Because dHb is paramagnetic (more magnetic) and oxygenated hemoglobin is diamagnetic (less magnetic), this reduction in dHb leads to an increase in the MRI signal [43] [45]. The entire hemodynamic response unfolds over 10-12 seconds, peaking at 4-6 seconds post-stimulus [43].
The following diagram illustrates the cascade from neural activity to the measurable fMRI signal:
EEG and Event-Related Potentials (ERP)
EEG/ERP measures provide a more direct, high-temporal-resolution view of neuronal function.
- EEG Fundamentals: EEG records the brain's electrical activity via electrodes placed on the scalp, capturing postsynaptic potentials from synchronized populations of pyramidal neurons [42].
- Event-Related Potentials (ERPs): ERPs are neural responses time-locked to a specific sensory, cognitive, or motor event. They are extracted from the ongoing EEG signal by averaging multiple trials, which helps cancel out background noise. ERPs are characterized by their polarity (P for positive, N for negative) and latency (e.g., P300, a positive wave around 300 ms post-stimulus associated with attention and context updating) [42].
Experimental Design for Dose-Response Studies
A well-designed experiment is crucial for obtaining meaningful dose-response data. The core workflow involves careful planning from subject selection to data acquisition.
Key Design Considerations
- Within-Subjects Design: The most powerful design for detecting dose-related changes is a within-subjects, placebo-controlled crossover study, where each participant receives all dose levels (including placebo) in a randomized order. This design controls for inter-individual variability in brain structure and function [42].
- Task Selection: The cognitive or sensory task performed during scanning must be robust and reliable, engaging the neural circuitry known to be modulated by the drug's target.
- For fMRI: Tasks should produce strong, localized BOLD activation (e.g., working memory n-back task for prefrontal cortex, emotional face matching for amygdala).
- For EEG/ERP: Tasks should elicit a clear, quantifiable component (e.g., oddball paradigm for P300, passive auditory stimulation for MMN (Mismatch Negativity)).
- Dosing Strategy: Doses should be selected based on preclinical data and Phase I pharmacokinetics to cover a range from sub-therapeutic to supra-therapeutic, aiming to characterize the full sigmoidal dose-response curve.
The following workflow chart outlines the key stages of a dose-response study using these modalities:
Detailed Methodologies and Protocols
This section provides specific protocols for acquiring and analyzing data for dose-response modeling.
Task-based fMRI Protocol
Objective: To measure dose-dependent changes in BOLD signal during a cognitive task.
- Participant Preparation: Screen for MRI contraindications (e.g., pacemakers, metallic implants). Instruct participants to avoid psychoactive substances (e.g., caffeine, alcohol) for a specified period before the scan. Use head restraints and padding to minimize motion [45].
- Data Acquisition:
- Scanner Parameters: A 3T MRI scanner or higher is recommended for sufficient signal-to-noise ratio.
- Pulse Sequence: Use T2*-weighted gradient-echo echo-planar imaging (EPI) for BOLD sensitivity.
- Spatial/Temporal Resolution: Typical parameters include voxel sizes of 2-4 mm isotropic and a repetition time (TR) of 1.5-2.5 seconds, balancing spatial coverage and temporal resolution.
- Task Design: Employ a block or event-related design. For dose-response, a parametric design where task difficulty increases with dose can be highly informative.
- Data Preprocessing:
- Slice-Timing Correction: Adjusts for acquisition time differences between brain slices.
- Realignment: Corrects for head motion.
- Spatial Normalization: Warps individual brains into a standard stereotaxic space (e.g., MNI).
- Spatial Smoothing: Applies a Gaussian kernel to increase signal-to-noise ratio.
EEG/ERP Protocol
Objective: To measure dose-dependent changes in electrical brain activity and specific cognitive components.
- Participant Preparation: Clean the scalp to achieve electrode impedances below 5 kΩ. Use an EEG cap with 32, 64, or 128 electrodes based on the spatial resolution required.
- Data Acquisition:
- Sampling Rate: Typically 500-1000 Hz to capture high-frequency components.
- Reference and Ground: Apply standard placements (e.g., linked mastoids, average reference).
- Task Paradigm: Implement a task designed to elicit the ERP component of interest (e.g., an auditory oddball task for P300).
- Data Preprocessing:
- Filtering: Apply a high-pass filter (e.g., 0.1 Hz) to remove slow drifts and a low-pass filter (e.g., 30 Hz) to remove muscle and line noise.
- Artifact Removal: Use algorithms (e.g., ICA - Independent Component Analysis) to identify and remove artifacts from eye blinks, eye movements, and muscle activity.
- Epoching: Segment the continuous data into epochs time-locked to the event of interest (e.g., -200 ms to 800 ms around a stimulus).
- Baseline Correction: Subtract the average signal in the pre-stimulus period from each epoch.
- Averaging: Average all epochs within the same condition to extract the ERP.
Quantitative Data Analysis and Dose-Response Modeling
After preprocessing, key outcome measures are extracted for statistical modeling.
Table 1: Key Quantitative Outcome Measures for Dose-Response Modeling
| Modality | Primary Outcome Measures | Description | Example in Dose-Response |
|---|---|---|---|
| task-based fMRI | BOLD Signal Change (%) | Percent change in signal in a task condition vs. baseline, within a pre-defined Region of Interest (ROI) [43]. | Dose-dependent increase in prefrontal cortex BOLD signal during a working memory task. |
| Contrast Estimates (Beta Weights) | Statistical parameter representing the strength of the relationship between the task regressor and BOLD signal in a general linear model (GLM) [43]. | Increasing beta weights for a target brain region with higher dose levels. | |
| EEG/ERP | Component Amplitude (µV) | The magnitude (positive or negative voltage) of a specific ERP component [42]. | Increase in P300 amplitude with dose, indicating enhanced attentional allocation. |
| Component Latency (ms) | The time from stimulus onset to the peak of an ERP component [42]. | Decrease in P300 latency with dose, indicating faster cognitive processing speed. | |
| Spectral Power (dB) | The magnitude of oscillatory activity in specific frequency bands (e.g., theta, alpha, beta, gamma) [42]. | Dose-related suppression of alpha power during eyes-open rest. |
- Statistical Modeling for Dose-Response:
- Primary Analysis: Use a repeated-measures analysis of variance (RM-ANOVA) with Dose as a within-subjects factor to test if the outcome measure differs across dose levels.
- Dose-Response Curve Fitting: Fit the data to non-linear regression models to characterize the relationship.
- Sigmoidal Emax Model:
E = E0 + (Emax * D^H) / (ED50^H + D^H), whereEis the effect,E0is the baseline effect,Emaxis the maximum effect,ED50is the dose producing 50% ofEmax, andHis the Hill slope. - Inverted-U Model: Some CNS drugs, particularly pro-cognitive agents, may show an "inverted-U" curve, where effects are optimal at a moderate dose and diminish at higher doses [42] [46].
- Sigmoidal Emax Model:
The Scientist's Toolkit: Essential Research Reagents and Materials
Table 2: Essential Materials and Tools for Neuroimaging Dose-Response Studies
| Item | Function / Rationale | Technical Considerations |
|---|---|---|
| High-Density EEG System (e.g., 64+ channels) | Records electrical brain activity with high temporal resolution. Essential for capturing ERPs and oscillatory dynamics. | Ensure compatibility with stimulus presentation software and magnetic shielding for concurrent fMRI-EEG. |
| MRI Scanner (3T or higher) | Generates the high magnetic field required for BOLD fMRI. Provides the structural and functional image data. | A 3T scanner is standard; 7T provides higher signal but is less common. Ensure availability of task presentation hardware inside the scanner bore. |
| Stimulus Presentation Software (e.g., E-Prime, Presentation) | Precisely controls the timing and delivery of visual, auditory, or other stimuli to the participant during scanning/recording. | Must be capable of sending synchronization pulses (TTL triggers) to the EEG and fMRI scanners to mark stimulus onset with millisecond accuracy. |
| Pharmacological Reference Compound | A well-characterized drug with known effects on the target neural system. | Serves as a positive control to validate the experimental paradigm and signal sensitivity to pharmacological manipulation. |
| Biometric Data Acquisition System | Records physiological data (heart rate, respiration, galvanic skin response). | These signals can be physiological confounds in fMRI data and should be recorded for use as nuisance regressors in analysis. |
| Statistical Analysis Software (e.g., SPM, FSL, AFNI for fMRI; EEGLAB, ERPLAB for EEG) | Provides a suite of tools for preprocessing, statistical analysis, and visualization of neuroimaging data. | Choice depends on lab expertise. Most are open-source. Ensure scripts can be adapted for batch processing of multiple subjects and dose conditions. |
Integrated Data Analysis and Visualization
The final step involves integrating analyzed data to inform decision-making.
- Visualizing Dose-Response Curves: Plot the group average (and individual) outcome measures (e.g., BOLD percent signal change, P300 amplitude) against dose level. Superimpose the fitted dose-response model (e.g., sigmoidal or inverted-U curve) to visually communicate the relationship [47].
- Determining Optimal Dose: The ED50 derived from the model, along with safety and tolerability data, informs the dose selection for subsequent Phase 2 and 3 clinical trials [42]. For example, research on phosphodiesterase 4 inhibitors (PDE4i's) used EEG/ERP to demonstrate pro-cognitive effects at doses achieving only ~30% target occupancy, a finding that would have been missed with PET alone, which might have suggested pushing to higher, less tolerable doses [42].
EEG/ERP and task-based fMRI are indispensable tools for establishing dose-response relationships in CNS drug development. By providing quantitative, mechanistically informed readouts of a drug's functional impact on the brain, these non-invasive techniques help answer critical questions about brain penetration, functional target engagement, and optimal dose selection early in the clinical development process. A rigorous experimental design, careful execution of protocols, and sophisticated modeling of the resulting data are key to leveraging these functional measures for de-risking the development of novel neurotherapeutics.
Positron Emission Tomography (PET) has emerged as an indispensable, non-invasive technology for quantifying drug-target interactions and developing novel biomarkers in the central nervous system (CNS). By enabling the in vivo measurement of target occupancy (%TO) for drug candidates and the pharmacokinetic properties of novel tracers, PET imaging provides critical data that informs Go/No-Go decisions and dose selection throughout clinical development [48]. This technical guide details the methodologies, applications, and recent advancements in PET for target occupancy studies and tracer development, providing researchers and drug development professionals with essential protocols and reference data.
PET Tracer Development for Neurodegenerative Diseases
Current Landscape and Challenges
The development of targeted PET radiotracers represents a cornerstone of molecular imaging for neurodegenerative diseases. An ideal tracer must demonstrate high specificity and affinity for its intended target, appropriate pharmacokinetics for imaging, and the ability to cross the blood-brain barrier (BBB) efficiently. Significant progress is being made toward creating tracers for pathological hallmarks of various neurodegenerative conditions, though several challenges remain [49] [50] [51].
Table: PET Tracer Development for Neurodegenerative Disease Targets
| Biological Target | Disease Association | Tracer Development Status | Key Challenges |
|---|---|---|---|
| Alpha-synuclein | Parkinson's Disease (PD) | Multiple candidates in clinical trials (Merck, Mass General, QST-Japan) [49] | Achieving specificity over other protein aggregates; validation [49] |
| Tau (Non-AD forms) | Non-AD Tauopathies (e.g., PSP, CBD) | Active development of novel radioligands [51] | Heterogeneity of tau filaments across different diseases [51] |
| VMAT2 | Movement Disorders (e.g., TD, Huntington's) | [¹⁸F]AV-133 validated and used in clinical studies [48] | Establishing target occupancy benchmarks for efficacy [48] |
| Reactive Oxygen Species | Multiple NDs (AD, PD, Tauopathy) | [¹⁸F]ROStrace evaluated in preclinical models [52] | Translating oxidative stress detection to human applications [52] |
Advancements in Imaging Technology
Technological improvements in PET hardware are simultaneously enhancing tracer capabilities. The recently developed Neuroexplorer PET camera, for instance, offers dramatically higher resolution and sensitivity compared to conventional systems [49]. This allows researchers to visualize smaller brain structures, such as the substantia nigra, which is critically involved in Parkinson's disease but was previously difficult to image clearly. Such advancements improve the output quality of any tracer and are vital for detecting subtle biological changes in clinical trials [49].
Quantitative Methodologies in PET Imaging
Measuring Molecular Blood-Brain Barrier Permeability
The blood-brain barrier's permeability (BBB PS) is a critical parameter for both tracers and therapeutics. A novel, non-invasive PET method leveraging high-sensitivity, long axial field-of-view (total-body) scanners now enables the quantification of the permeability-surface area (PS) product for molecular radiotracers using a single scan, eliminating the need for a separate cerebral blood flow (CBF) scan [53].
The methodology employs high-temporal resolution (HTR) dynamic imaging (e.g., 1-2 second frames) during the first two minutes post-injection. The data are analyzed using the Adiabatic Approximation to the Tissue Homogeneity (AATH) model, which accounts for intravascular transport and tracer exchange across the BBB. This model jointly estimates CBF and the tracer-specific BBB transport rate (K₁) from a single HTR scan, from which the molecular PS is derived [53].
Table: Kinetic Parameters from HTR PET for BBB Permeability [53]
| Radiotracer | Primary BBB Transport Mechanism | Estimated CBF (Grey Matter, ml/min/cm³) | BBB Transport Rate K₁ (Grey Matter, ml/min/cm³) | Approximate BBB PS Order |
|---|---|---|---|---|
| ¹¹C-butanol | Diffusion (highly extracted flow tracer) | 0.476 ± 0.100 | Nearly equal to CBF | 10⁻¹ ml/min/cm³ |
| ¹⁸F-FDG | Glucose Transporter 1 (GLUT1) | 0.476 ± 0.100 | 0.173 ± 0.036 | 10⁻¹ ml/min/cm³ |
| ¹⁸F-fluciclovine | System L amino acid transporter | 0.476 ± 0.100 | Lower than ¹⁸F-FDG | Not Specified |
Parametric Imaging and Scan Time Reduction
Parametric PET imaging, which generates voxel-wise maps of physiological parameters, often provides superior lesion contrast and quantification compared to conventional static imaging. A significant innovation is the relative Patlak plot method, which when used with total-body PET scanners like EXPLORER, can reduce parametric scan times for cancer imaging from 60 minutes to 20 minutes or less without sacrificing data quality. This is achieved by combining the relative Patlak method with an artificial intelligence technique called deep kernel noise reduction to mitigate image graininess, making advanced parametric imaging more feasible for routine clinical use [54].
PET for Target Occupancy Studies: Protocols and Applications
Experimental Protocol for VMAT2 Occupancy
A standard methodology for determining %TO using PET involves a blocking study design, as exemplified by research on the vesicular monoamine transporter type 2 (VMAT2) [48]. The following protocol outlines the key steps:
Detailed Methodology [48]:
- Baseline Scan: A dynamic PET scan is performed on a naive subject (e.g., nonhuman primate or human) using a validated radiotracer ([¹⁸F]AV-133 for VMAT2). Time-activity curves (TACs) are generated for target (e.g., caudate, putamen) and reference (cerebellum) regions.
- Pharmacological Blockade: The subject receives the drug candidate. In the referenced study, a bolus loading dose was administered, followed by a constant intravenous infusion to achieve steady-state plasma exposure.
- Post-Dose Scan: After a set period (e.g., 1 hour), a second dynamic PET scan is conducted using the same radiotracer.
- Pharmacokinetic Sampling: Whole blood samples are collected at multiple time points during the scan. Plasma concentration of the drug is analyzed (e.g., via LC-MS/MS), and the average plasma concentration (Cₐᵥₑ) during the scan is calculated.
- Data Analysis:
- Non-displaceable binding potential (BPND) is estimated for both baseline and post-dose scans using non-invasive Logan graphical analysis with the cerebellum as a reference region.
- Target Occupancy (%TO) is calculated for target regions using the formula:
%TO = [1 - (BPND(post-block) / BPND(baseline))] × 100 - PK-TO Relationship: The relationship between %TO and Cₐᵥₑ is fitted with a simplified Emax model:
%TO = [Drug] / ([Drug] + EC₅₀), where EC₅₀ is the plasma concentration for half-maximal occupancy.
Establishing Target Occupancy Benchmarks
PET-derived %TO is particularly powerful when established for clinically efficacious drugs, creating a benchmark for novel drug candidates. For VMAT2 inhibitors, the PK-%TO relationship for NBI-98782 (the active metabolite of valbenazine) was used to estimate that 85-90% VMAT2 occupancy is achieved by the 80 mg dose of valbenazine, which produces a large effect size (Cohen's d = 0.9) in treating tardive dyskinesia and Huntington's chorea [48]. This benchmark allows for direct comparison; for instance, the experimental inhibitor NBI-750142 was estimated to achieve only 36-78% VMAT2 occupancy at acceptable doses, suggesting potential inferiority [48].
The Scientist's Toolkit: Essential Research Reagents and Materials
Table: Key Reagents for PET Occupancy and Tracer Studies
| Reagent / Material | Function and Role in Research |
|---|---|
| Validated PET Radiotracer (e.g., [¹⁸F]AV-133) | Binds specifically to the target of interest (e.g., VMAT2); enables quantification of baseline target availability and post-dose occupancy [48]. |
| Drug Candidate | The investigational compound whose interaction with the biological target is being quantified. |
| Reference Region Tissue | A brain region with negligible specific binding of the radiotracer (e.g., cerebellum for VMAT2); used to estimate non-specific binding and free tracer concentration [48]. |
| LC-MS/MS System | Provides highly sensitive and specific bioanalytical quantification of drug candidate concentration in plasma samples [48]. |
| High-Sensitivity PET Scanner (e.g., Neuroexplorer, uEXPLORER) | Provides the high temporal and/or spatial resolution needed for advanced kinetic modeling and imaging of small brain structures [49] [53]. |
| Kinetic Modeling Software | Implements compartment models (e.g., AATH, Logan plot) to derive physiological parameters (CBF, K₁, BPND) from dynamic PET data [53] [48]. |
PET imaging for target occupancy and tracer development provides an unparalleled window into the in vivo pharmacokinetics and pharmacodynamics of CNS-targeting compounds. The continuous refinement of radiotracers for challenging targets like alpha-synuclein, coupled with technological advancements in PET hardware and kinetic modeling techniques, is expanding the boundaries of non-invasive brain imaging. By adhering to robust experimental protocols and leveraging quantitative benchmarks, researchers can effectively accelerate the development of novel therapeutics for neurodegenerative and other CNS disorders.
Neuroimaging biomarkers are revolutionizing the design of central nervous system (CNS) clinical trials by enabling precise patient stratification. These non-invasive tools allow researchers to identify homogeneous patient subgroups based on underlying pathophysiology rather than broad clinical symptoms, thereby enriching trial populations and enhancing the detection of therapeutic efficacy. This whitepaper details the application of advanced magnetic resonance imaging (MRI), positron emission tomography (PET), and analytical frameworks that provide early, objective, and predictive measures of treatment response, ultimately accelerating drug development for neurological diseases.
Patient stratification—the process of categorizing patients into distinct subgroups based on specific biological characteristics—is critical for successful clinical trials in heterogeneous neurological disorders. Neuroimaging biomarkers provide a powerful, non-invasive window into brain structure, function, and molecular pathology, facilitating this stratification. Traditional endpoints, such as changes in tumor size months after therapy, often delay the assessment of treatment efficacy [55]. In contrast, imaging biomarkers can detect early biological changes in response to therapy, often before clinical symptoms improve or structural changes occur. This capability allows for more efficient trial designs, including go/no-go decisions earlier in the drug development process and a higher probability of demonstrating clinical benefit in a precisely selected patient population [56] [57]. Framed within a broader thesis on non-invasive brain imaging, this guide details the operationalization of these biomarkers for stratification, covering key modalities, analytical techniques, and practical implementation protocols.
Key Neuroimaging Biomarkers for Stratification
Several neuroimaging modalities provide unique and complementary biomarkers for patient stratification. The table below summarizes the primary biomarkers, their measured parameters, and their application in clinical trials.
Table 1: Key Neuroimaging Biomarkers for Patient Stratification
| Biomarker / Modality | Measured Parameter | Clinical Application & Stratification Role |
|---|---|---|
| Diffusion MRI (fDM) [55] | Apparent Diffusion Coefficient (ADC); change in water diffusion | Early Prediction of Treatment Response: Stratifies patients as responders vs. non-responders early in therapy (e.g., 3 weeks) based on intracellular changes and cell density. |
| TSPO PET [56] | Translocator Protein (TSPO) density via ligands (e.g., PBR28) | Neuroinflammation Stratification: Identifies patients with elevated neuroinflammation for trials of anti-inflammatory drugs. Correlates with symptom severity in Alzheimer's and Major Depressive Episodes. |
| FLAIR MRI (Texture/Intensity) [58] | Intensity and texture features in White Matter Tracts, WML penumbra, and Blood Supply Territories | Cerebrovascular Disease (CVD) Risk Stratification: Segregates patients into homogeneous subgroups (e.g., high CVD risk, neurodegeneration-unrelated) for targeted interventions. |
| Susceptibility MRI (e.g., 7T) [56] | Presence of iron-laden microglia at lesion edges ("paramagnetic rims") | Prognostic Stratification in MS: Identifies patients with chronic active lesions, indicating failure of early lesion repair and a more aggressive disease phenotype. |
| Postcontrast 3D T2-FLAIR [56] | Leptomeningeal enhancement (indicating blood-meningeal barrier impairment) | Stratification in Progressive MS: Detects chronic meningeal inflammation, associated with greater disability and cortical atrophy, for inclusion in progressive MS trials. |
| COX-1 / P2X7R PET [56] | Cyclooxygenase system activity or purinergic receptor expression | Target Engagement Biomarker: Stratifies patients for target-specific therapies (e.g., NSAIDs, P2X7R antagonists) and measures pharmacodynamic effects. |
Experimental Protocols and Methodologies
Functional Diffusion Mapping (fDM) for Early Treatment Response
The fDM protocol provides a quantitative method for predicting tumor response weeks after treatment initiation [55].
Image Acquisition:
- MRI System: 1.5 T or higher.
- Sequence: Diffusion-weighted spin-echo echo-planar imaging (EPI).
- Parameters: TR/TE = 10,000/100 ms; section thickness = 6 mm.
- Diffusion Weighting: Acquire images at low (b₁ ≈ 0 s/mm²) and high (b₂ = 1000 s/mm²) diffusion sensitivities along three orthogonal directions (x, y, z). Acquisition time is approximately 80 seconds.
Image Analysis:
- Calculation of Apparent Diffusion Coefficient (ADC) Maps: Compute ADC for each direction using the formula:
ADCᵢ = -ln(Sᵢ(b₂)/Sᵢ(b₁)) / (b₂ - b₁), whereSis the signal intensity. - Mean ADC Calculation: Average the three directional ADC maps to create a rotationally invariant mean ADC map:
ADCo = (ADCˣ + ADCʸ + ADCᶻ) / 3. - Image Coregistration: Spatially align all post-treatment scans to the pre-treatment scan using a mutual information algorithm (e.g., "miami fuse").
- Tumor Segmentation: A neuroradiologist manually delineates the tumor volume on pre- and post-treatment images.
- fDM Generation and Voxel Classification: For each voxel present in both pre- and post-treatment tumor volumes, calculate the change in ADC. Classify voxels based on a statistically significant threshold (e.g., 95% prediction interval from normal tissue):
- Red Voxels (Vᴿ): Significant increase in ADC.
- Blue Voxels (Vᴮ): Significant decrease in ADC.
- Green Voxels (Vᴳ): No significant change.
- Quantification: Calculate the normalized volume of significantly changed voxels (e.g., Vᵀ = Vᴿ + Vᴮ) for correlation with clinical response.
FLAIR Biomarker Extraction for Cerebrovascular Disease Stratification
This protocol outlines the process for stratifying vascular disease patients using FLAIR MRI biomarkers [58].
Image Pre-processing:
- Data: 3D T2-FLAIR volumes (e.g., TR/TE/TI: 9000–11000/117–141/2200–2500 ms).
- Intensity Standardization: Normalize image intensities across the cohort.
- Skull Stripping: Remove non-brain tissue.
- Spatial Registration: Register all images to a standard atlas space (e.g., using ANTs symmetric normalization).
Region of Interest (ROI) Segmentation:
- White Matter (WM) Tracts: Use an unsupervised segmentation method (e.g., K-means clustering) on fractional anisotropy (FA) volumes generated from FLAIR via a Generative Adversarial Network (GAN) model.
- WML Penumbra: Define a boundary region around white matter lesions, segmented into five concentric sub-regions (P1 to P5), each one voxel (e.g., 0.86 mm) further from the lesion.
- Blood Supply Territories (BSTs): Use an atlas to segment the brain into regions supplied by the Middle Cerebral Artery (MCA), Posterior Cerebral Artery (PCA), and Anterior Cerebral Artery (ACA).
Biomarker Extraction: From each of the 9 ROIs, extract the following four biomarkers:
- FLAIR Intensity: Mean signal intensity within the ROI.
- Damage Biomarker: Measures local intensity fluctuations.
- Integrity Biomarker: Reflects microstructural tissue organization.
- Wavelet Biomarker: Captures texture information at multiple scales.
Stratification Analysis:
- Clustering: Apply K-means clustering to the matrix of patients x 36 biomarkers to identify homogeneous patient subgroups.
- Subgroup Profiling: Use a Random Forest classifier to identify the 15 most important biomarkers for differentiating subgroups. Analyze clinical variables (e.g., age, WML volume, vascular risk factors) to characterize the clinical phenotype of each subgroup.
Visualizing Workflows and Biomarker Logic
The following diagrams, generated with Graphviz DOT language, illustrate the core experimental workflows and decision pathways for implementing neuroimaging biomarkers in clinical trials.
Diagram 1: Functional Diffusion Map Analysis Workflow
Diagram 2: Patient Stratification Logic Pathway
The Scientist's Toolkit: Essential Research Reagents & Materials
Successfully implementing these stratification strategies requires a suite of specialized tools and reagents.
Table 2: Essential Research Reagents and Solutions for Neuroimaging Biomarker Studies
| Item | Function / Context of Use | Key Examples / Notes |
|---|---|---|
| Second-Generation TSPO PET Ligands | High-affinity radioligands for imaging neuroinflammation via activated microglia. | PBR28; provides higher signal-to-noise ratio than first-generation ligands like PK11195 [56]. |
| Novel Target PET Ligands | Biomarkers for specific target engagement in clinical trials. | Ligands for COX-1, COX-2, and the purinergic receptor P2X7R (e.g., Ligand 739) [56]. |
| Gadolinium-Based Contrast Agents | Visualizing blood-brain barrier (BBB) integrity and active inflammation. | Used in standard T1-weighted MRI; also in post-contrast 3D T2-FLAIR to detect leptomeningeal inflammation [56]. |
| Image Analysis Software & Algorithms | Coregistration, segmentation, and calculation of quantitative biomarker maps. | Mutual Information algorithms (e.g., "miami fuse"), Advanced Normalization Tools (ANTs), GAN models for tract segmentation [55] [58]. |
| Standardized Image Phantoms | Ensuring consistency and reproducibility of quantitative measurements across different scanner platforms and study sites. | Critical for multi-center clinical trials. |
| FLAIR & DTI Atlases | Defining regions of interest for standardized biomarker extraction. | Blood Supply Territory (BST) atlases; White Matter tract atlases [58]. |
Therapeutic neuromodulation represents a paradigm shift in managing neurodegenerative diseases, offering novel strategies to alleviate cognitive deficits where conventional pharmacological interventions have shown limited efficacy. Non-invasive brain stimulation (NIBS) techniques, primarily transcranial magnetic stimulation (TMS) and transcranial direct current stimulation (tDCS), have emerged as promising therapeutic tools for enhancing cognitive function in conditions like Alzheimer's disease (AD) and Parkinson's disease (PD). The therapeutic application of these technologies is increasingly being guided and validated by advanced neuroimaging methods, creating a powerful synergy between brain mapping and targeted intervention [14]. This convergence enables researchers to move beyond symptomatic treatment toward mechanism-based interventions that modulate the neural networks underlying cognitive processes.
The prevalence of neurodegenerative disorders continues to rise globally, with Alzheimer's disease alone affecting over 50 million people worldwide—a number projected to triple by 2050 [59]. These conditions impose a significant burden on individuals, families, healthcare systems, and the global economy. Characterized by progressive cognitive decline encompassing memory, attention, executive function, and language abilities, neurodegenerative diseases have proven particularly challenging to treat with pharmacological approaches alone, which often provide only symptomatic control without altering disease progression [59]. Within this context, neuromodulation techniques have gained traction as potentially disease-modifying interventions that can enhance neuroplasticity, modulate dysfunctional networks, and potentially slow cognitive decline.
This technical guide provides an in-depth examination of TMS and tDCS methodologies for cognitive enhancement in neurodegenerative diseases, with particular emphasis on their integration with neuroimaging biomarkers. We present detailed experimental protocols, quantitative outcome data, and practical implementation frameworks tailored for researchers and drug development professionals working at the intersection of neurostimulation and brain imaging.
Technical Foundations of Neuromodulation Techniques
Transcranial Magnetic Stimulation (TMS)
TMS operates on the principle of electromagnetic induction to generate focal electrical currents in targeted cortical regions without surgical intervention. A rapidly changing current passed through a coil placed on the scalp produces a time-varying magnetic field perpendicular to the coil plane. This magnetic field, typically ranging from 1 to 4 Tesla, induces an electric field in the underlying brain tissue that can depolarize neurons [59]. When administered as repetitive TMS (rTMS), pulses are delivered in trains at frequencies ranging from 1 Hz (inhibitory) to 20 Hz or higher (excitatory), enabling sustained modulation of cortical excitability beyond the stimulation period.
The neurobiological effects of rTMS are mediated through mechanisms akin to synaptic plasticity, primarily involving long-term potentiation (LTP) and long-term depression (LTD). High-frequency rTMS (≥5 Hz) induces LTP-like effects that strengthen synaptic connections, while low-frequency rTMS (1 Hz) triggers LTD-like processes that downregulate maladaptive neural pathways [59]. In neurodegenerative conditions, these mechanisms may counteract the synaptic dysfunction that characterizes diseases like Alzheimer's, potentially restoring network connectivity in circuits critical for cognitive function.
Transcranial Direct Current Stimulation (tDCS)
tDCS modulates spontaneous neuronal activity by applying a weak direct current (typically 1-2 mA) to the scalp via anode and cathode electrodes. Unlike TMS, tDCS does not induce action potentials but rather alters the resting membrane potential, making neurons more or less likely to fire in response to natural inputs. Anodal stimulation typically increases cortical excitability by depolarizing neurons, while cathodal stimulation decreases excitability through hyperpolarization [59]. These neurophysiological effects emerge during stimulation and persist for a period after stimulation cessation, with duration after-effects dependent on stimulation parameters (intensity, duration) and individual factors.
The mechanisms of action of tDCS involve changes in neuronal membrane polarity, modulation of synaptic plasticity, and alterations in functional network connectivity. The after-effects are believed to involve N-methyl-D-aspartate (NMDA) receptor-dependent synaptic plasticity, similar to LTP and LTD [59]. In the context of neurodegenerative diseases, tDCS appears to enhance neuroplasticity and modulate neurotransmitter systems, potentially compensating for network dysfunction caused by pathological processes.
Table 1: Comparison of TMS and tDCS Technical Parameters
| Parameter | TMS | tDCS |
|---|---|---|
| Mechanism | Electromagnetic induction | Direct current application |
| Spatial Resolution | High (focal) | Moderate (diffuse) |
| Depth of Penetration | ~2 cm (figure-8 coil); deeper with H-coils | ~1-2 cm (diffuse) |
| Typical Session Duration | 20-45 minutes | 20-30 minutes |
| Induced Effects | Action potentials | Modulation of resting membrane potential |
| After-effect Duration | Minutes to >1 hour post-stimulation | 30 minutes to 1.5 hours post-stimulation |
| Key Applications in Neurodegeneration | Language, memory, executive function enhancement | Working memory, attention, cognitive control |
Methodological Protocols and Experimental Implementation
TMS Protocol for Cognitive Enhancement in Alzheimer's Disease
Equipment and Setup: A TMS stimulator with biphasic pulse capability and a figure-8 coil is standard for focal stimulation. Neuronavigation systems that co-register the coil position to the individual's MRI enhance targeting precision. For cognitive studies, integration with behavioral task presentation systems is essential.
Target Identification and Localization: The dorsolateral prefrontal cortex (DLPFC) is most frequently targeted for cognitive enhancement, particularly for working memory and executive functions. The left DLPFC can be localized using the EEG 10-20 system (F3 position) or through MRI-guided neuronavigation for greater precision. For language deficits in AD, targeting the left posterior perisylvian region or Broca's area has shown efficacy [59].
Stimulation Parameters:
- Frequency: 10-20 Hz for excitatory effects on cognitive enhancement
- Intensity: 90-120% of resting motor threshold (RMT)
- Trains: 50-60 pulses per train with 20-30 second intertrain intervals
- Total pulses: 1000-2000 pulses per session
- Treatment course: Daily sessions for 2-6 weeks
Procedure:
- Determine RMT by applying single-pulse TMS to the primary motor cortex.
- Identify target region using neuronavigation or the 10-20 EEG system.
- Administer rTMS pulses according to parameter settings.
- Monitor adverse effects and subject tolerance throughout.
- Conduct cognitive assessment pre-, during, and post-treatment series.
Multiple investigations have demonstrated that rTMS has lasting beneficial effects on language performance in patients with AD, particularly in tasks involving action naming and sentence comprehension [59]. These improvements are mediated through the modulation of synaptic plasticity and enhancement of functional connectivity within language-related networks.
tDCS Protocol for Cognitive Enhancement in Neurodegenerative Diseases
Equipment Setup: A constant current stimulator with saline-soaked surface electrodes (typically 25-35 cm²) is used. Electrode placement follows the international 10-20 EEG system or MRI-guided navigation for precision.
Electrode Montages:
- For prefrontal cognitive functions: Anode over left DLPFC (F3), cathode over right supraorbital region (Fp2) or right deltoid
- For language processing: Anode over left posterior perisylvian region or Broca's area, with extracephalic cathode
Stimulation Parameters:
- Current intensity: 1-2 mA
- Current density: 0.03-0.08 mA/cm²
- Ramp-up/ramp-down: 30-60 seconds
- Stimulation duration: 20-30 minutes
- Treatment course: Daily sessions for 1-4 weeks
Procedure:
- Prepare skin surface to reduce impedance.
- Position electrodes according to selected montage.
- Ramp up current slowly to target intensity.
- Maintain stimulation for prescribed duration.
- Ramp down current gradually.
- Assess cognitive performance at baseline, during, and after treatment course.
Studies have demonstrated that tDCS applied to the left dorsolateral prefrontal cortex and language regions significantly enhances daily language abilities and specific language performance in dementia patients with primary progressive aphasia (PPA) [59]. Notable improvements have been observed in tasks involving language repetition, reading, picture naming, and auditory comprehension.
Integration with Neuroimaging
The combination of neuromodulation with pre-post imaging (e.g., TMS-EEG or tDCS-fMRI) strengthens causal inferences about brain-behavior relationships [14]. Functional connectivity MRI can identify network-level changes following stimulation, while diffusion tensor imaging can track white matter integrity modifications. Electroencephalography combined with TMS (TMS-EEG) provides direct measures of cortical excitability and connectivity.
Advanced analysis approaches like the NeuroMark pipeline, a hybrid independent component analysis (ICA) method, enable researchers to capture individual variability in network organization while maintaining cross-subject comparability [60]. This is particularly valuable for identifying biomarkers of treatment response and understanding interindividual variability in neuromodulation outcomes.
Quantitative Outcomes and Efficacy Data
Cognitive Outcomes in Alzheimer's Disease
Research conducted between 2006-2024 indicates promising effects of neuromodulation on cognitive function in neurodegenerative diseases. A bibliometric analysis of 88 publications in this domain revealed an average of 34.82 citations per article, with nearly half of the publications produced after 2021, demonstrating rapidly growing research interest [59].
Table 2: Cognitive Outcomes Following Neuromodulation in Alzheimer's Disease
| Cognitive Domain | Stimulation Technique | Target Region | Key Improvements | Effect Size Range |
|---|---|---|---|---|
| Language Function | rTMS (10-20 Hz) | Left posterior perisylvian region | Action naming, sentence comprehension, auditory comprehension | Moderate to large (0.6-1.2 Cohen's d) |
| Language Function | tDCS (anodal) | Broca's area, left temporoparietal cortex | Picture naming, repetition, reading accuracy | Small to moderate (0.4-0.8 Cohen's d) |
| Executive Function | rTMS (10 Hz) | Left DLPFC | Working memory, cognitive control, set-shifting | Moderate (0.5-0.9 Cohen's d) |
| Executive Function | tDCS (anodal) | Left DLPFC | Attention, inhibitory control, processing speed | Small to moderate (0.3-0.7 Cohen's d) |
| Memory | rTMS (5-20 Hz) | Parietal cortex, DLPFC | Episodic memory recall, recognition | Variable (0.3-0.8 Cohen's d) |
| Global Cognition | Multisession rTMS | Multiple networks | ADAS-Cog, MMSE scores | Small to moderate (0.4-0.7 Cohen's d) |
Neuroimaging Biomarkers of Treatment Response
Quantitative MRI (qMRI) techniques provide objective biomarkers for tracking neuromodulation effects. In Alzheimer's disease, key qMRI biomarkers include volumetry (hippocampus/cortex), ASL-CBF (cerebral blood flow), and QSM (deep nuclei iron) [61]. These metrics can detect subtle changes in brain structure and function following intervention.
Studies combining TMS with neuroimaging have demonstrated modulation of default-mode network connectivity and enhanced glymphatic clearance following continuous theta burst stimulation in patients with cerebral small vessel disease, which often co-occurs with neurodegenerative pathologies [14]. These network-level changes correlate with improvements in information processing speed and executive function.
Advanced analytical approaches like dynamic fusion models that incorporate multiple time-resolved symmetric data fusion decompositions can detect subtle stimulation-induced changes across modalities [60]. For example, structural gray matter dynamic behavior appears to follow a gradient along unimodal versus heteromodal cortices, potentially identifying regions most responsive to neuromodulation.
The Scientist's Toolkit: Research Reagent Solutions
Table 3: Essential Resources for Neuromodulation Research
| Resource Category | Specific Tools/Solutions | Research Application |
|---|---|---|
| Neuromodulation Equipment | TMS stimulators with figure-8 coils; tDCS constant current devices | Delivery of precise stimulation protocols; sham-controlled designs |
| Neuronavigation Systems | MRI-guided TMS navigation; frameless stereotactic systems | Precise target localization; reproducible coil/electrode placement |
| Neuroimaging Platforms | 3T MRI with functional, diffusion, and volumetric sequences; MEG/EEG systems | Target identification; treatment response quantification; network analysis |
| Computational Tools | NeuroMark pipeline [60]; DSI Studio; FSL; SPM | Analysis of individual differences; functional connectivity mapping |
| Cognitive Assessment | Standardized neuropsychological batteries; computerized testing | Objective quantification of cognitive outcomes |
| Physiological Monitoring | EMG systems for motor threshold determination; impedance checkers for tDCS | Safety monitoring; parameter individualization |
Future Directions and Implementation Challenges
The field of therapeutic neuromodulation faces several persistent challenges that require methodological innovation. Interindividual variability in response to stimulation remains a significant hurdle, with factors such as age, disease stage, brain anatomy, and network integrity influencing outcomes [62]. Future research priorities include:
Parameter optimization frameworks leveraging multivariate and adaptive modeling to fine-tune stimulation settings based on individual characteristics [62].
Standardized outcome metrics to enable cross-study comparisons of efficacy and safety across diverse domains and populations [62].
Closed-loop and adaptive systems that dynamically adjust stimulation based on neural or behavioral feedback [62].
Greater integration of neuroimaging, electrophysiology, and computational modeling to capture stimulation effects across spatial and temporal scales [14].
Multimodal data integration approaches that unify structural, functional, and metabolic imaging data to build cross-scale models of cognition [14].
Ethical and regulatory considerations also warrant continued dialogue among researchers, clinicians, ethicists, and policy makers to guide responsible NIBS development and deployment [62]. As brain stimulation becomes increasingly integrated into research and clinical practice, methodological rigor and transparent reporting become paramount for ensuring both efficacy and safety.
Therapeutic neuromodulation using TMS and tDCS represents a promising intervention for cognitive enhancement in neurodegenerative diseases, with an expanding evidence base demonstrating benefits for language, executive function, and memory deficits. The integration of these techniques with advanced neuroimaging methods enables personalized targeting and objective quantification of treatment effects at the network level. Future advances will depend on continued methodological refinement, standardized protocols, and the development of closed-loop systems that dynamically adapt to individual neural signatures. For researchers and drug development professionals, these technologies offer not only therapeutic tools but also powerful experimental approaches for probing brain-behavior relationships in neurodegenerative conditions.
Addressing Technical Challenges and Optimizing Protocol Design
Navigating Inter-individual Variability and Nebulous Dose-Response Relationships
Inter-individual variability presents a fundamental challenge in non-invasive brain imaging research, traditionally treated as noise to be minimized in group-level analyses [63]. However, a paradigm shift is emerging where this variability is recognized as a critical element of brain function, essential for enhancing adaptability and robustness in neural systems [63]. This technical guide examines the theoretical frameworks and methodological approaches for navigating this variability, with particular focus on optimizing study designs in brain-wide association studies (BWAS) and developing personalized non-invasive brain stimulation (NIBS) protocols. We explore how precise characterization of individual differences can transform nebulous dose-response relationships into predictable, quantifiable interactions, ultimately advancing the precision of neuroscientific research and its clinical applications.
Theoretical Framework: Reconceptualizing Neural Variability
From Noise to Functional Feature
Neural variability has historically been considered a barrier to consistent outcomes across neuroscience research. Contemporary perspectives, however, position neural variability and neural noise as fundamental functional features that confer significant advantages to neural systems [63]. This variability underpins brain flexibility and adaptability, enabling robust responses to changing environmental demands and cognitive challenges. Research indicates that capturing this variability through precise indices that represent individual neural states can significantly enhance the precision of neurostimulation protocols and interventions [63].
Probabilistic Framework for Personalization
A probabilistic framework for NIBS personalization incorporates both inter-individual variability and dynamic brain states to optimize intervention outcomes [63]. This framework acknowledges that stimulation protocols must account for individual differences in neural excitability, plasticity, and homeostatic regulation rather than applying standardized parameters across diverse populations. By leveraging detailed brain activity recordings and advanced analytical techniques, researchers can develop personalized stimulation approaches that align with an individual's unique neurophysiological signature [63].
Key Components of the Probabilistic Personalization Framework:
- Inter-individual Variability Mapping: Comprehensive characterization of individual differences in brain structure and function
- Brain State Monitoring: Real-time assessment of dynamic neural states preceding and during intervention
- Dose-Response Modeling: Multifactorial models relating stimulation parameters to individual neurophysiological responses
- Adaptive Protocol Optimization: Continuous adjustment of stimulation parameters based on ongoing neural response assessment
Quantitative Foundations: Optimizing Study Design in BWAS
The Scan Time-Sample Size Tradeoff
A pervasive dilemma in brain-wide association studies involves the allocation of limited resources between functional magnetic resonance imaging (fMRI) scan time per participant and overall sample size [64]. Empirical evidence demonstrates that individual-level phenotypic prediction accuracy increases with both sample size and total scan duration (calculated as sample size × scan time per participant) [64]. A theoretical model derived from extensive analysis explains empirical prediction accuracies well across 76 phenotypes from nine resting-fMRI and task-fMRI datasets (R² = 0.89), spanning diverse scanners, acquisitions, racial groups, disorders, and ages [64].
Table 1: Prediction Accuracy Relative to Total Scan Duration (Sample Size × Scan Time)
| Total Scan Duration (min) | Prediction Accuracy (Pearson's r) | Relationship Phase |
|---|---|---|
| ≤ 20 min | Linear increase with log(duration) | Interchangeable |
| 20-30 min | Diminishing returns | Transition |
| > 30 min | Marked diminishing returns | Sample size prioritized |
For scans of ≤20 minutes, prediction accuracy increases linearly with the logarithm of the total scan duration, suggesting that sample size and scan time are initially interchangeable [64]. However, this relationship exhibits clear diminishing returns, with sample size ultimately proving more important for prediction accuracy than extended scan times per individual, particularly beyond 30 minutes of scanning [64].
Cost-Benefit Optimization
When accounting for overhead costs associated with each participant (including recruitment), longer scans can yield substantial cost savings compared to increasing only sample size for improving prediction performance [64]. Research demonstrates that 10-minute scans are particularly cost-inefficient for achieving high prediction performance, with 30-minute scans representing the most cost-effective approach across most scenarios, yielding 22% savings over 10-minute scans [64].
Table 2: Cost-Effectiveness Analysis of Different Scanning Protocols
| Scan Time (min) | Relative Cost-Efficiency | Recommended Application |
|---|---|---|
| 10 | Low (baseline) | Not recommended for high prediction performance |
| 20 | Moderate | Minimum recommended for BWAS |
| 30 | High (22% savings over 10min) | Optimal for most scenarios |
| >30 | Moderate (overshoot cheaper than undershoot) | Specialized applications |
The cost-benefit analysis reveals that overshooting the optimal scan time is generally cheaper than undershooting it, leading to the recommendation of a minimum scan time of 30 minutes for most BWAS applications [64]. This optimization framework varies by imaging modality, with the most cost-effective scan time being shorter for task-fMRI and longer for subcortical-to-whole-brain BWAS compared to resting-state whole-brain studies [64].
Methodological Approaches for Characterizing Variability
Advanced Imaging Technologies
Advanced imaging technologies that enable non-invasive measurement of brain function are particularly valuable for characterizing inter-individual variability, especially in vulnerable populations. Arterial spin labeling (ASL), for example, provides a noninvasive means to measure cerebral blood flow by labeling molecules in the inflowing arterial blood and observing their movement within brain tissue, requiring no external contrast agents or radioactive tracers [11]. This approach is especially suitable for pediatric populations and longitudinal study designs where repeated measurements are essential for capturing developmental trajectories and individual response patterns.
Recent technological advances have demonstrated that multi-delay ASL protocols yield more robust measurements of cerebral perfusion in the developing brain compared to single-delay approaches, more accurately capturing hemodynamic changes and variability in arterial transit time across individuals [11]. These methodological refinements are crucial for precise quantification of cerebral blood flow and arterial transit time, addressing significant challenges in understanding blood flow changes in the developing brain.
Experimental Protocols for Variability Assessment
Comprehensive Phenotypic Prediction Protocol:
- Data Acquisition: Acquire resting-state or task-based fMRI data using optimized scan durations (minimum 20-30 minutes) [64]
- Image Processing: Calculate resting-state functional connectivity (RSFC) matrices using standardized preprocessing pipelines
- Feature Extraction: Derive connectivity measures from RSFC matrices serving as input features for prediction models
- Prediction Modeling: Implement kernel ridge regression (KRR) or linear ridge regression (LRR) through nested cross-validation procedures
- Performance Validation: Assess prediction accuracy (Pearson's correlation or coefficient of determination) across multiple iterations with different training sample sizes
Individual Variability Profiling Protocol:
- Multimodal Data Collection: Acquire structural, functional, and neurochemical data using non-invasive methods
- Brain State Assessment: Measure baseline neural excitability, plasticity, and homeostatic regulation parameters
- Response Characterization: Administer controlled stimulation protocols while monitoring neural and behavioral responses
- Pattern Identification: Apply advanced analytical techniques to identify individual response patterns across modalities
- Predictive Model Building: Develop models relating individual neurophysiological characteristics to intervention outcomes
Experimental workflow for phenotypic prediction and study optimization
The Researcher's Toolkit: Essential Materials and Methods
Table 3: Research Reagent Solutions for Variability and Dose-Response Studies
| Item/Category | Function/Application | Technical Specifications |
|---|---|---|
| Multi-delay Arterial Spin Labeling (ASL) | Non-invasive cerebral blood flow measurement without contrast agents | Suitable for pediatric populations; multiple delay times for accurate transit time assessment [11] |
| Resting-state fMRI Protocols | Functional connectivity mapping for phenotypic prediction | Minimum 20-30 minute scan duration; 419×419 RSFC matrices [64] |
| Kernel Ridge Regression (KRR) | Individual-level phenotypic prediction from brain connectivity data | Nested cross-validation; applicable to diverse phenotypes [64] |
| Probabilistic NIBS Framework | Personalization of non-invasive brain stimulation protocols | Incorporates inter-individual variability and brain states; enhances precision [63] |
| Neural Variability Indices | Quantification of individual neural noise and flexibility | Multiscale entropy (MSE); E/I balance measures [63] |
Analytical Framework for Dose-Response Characterization
Modeling Approaches for Nebulous Relationships
Traditional dose-response modeling in neuroscience often assumes linear or straightforward sigmoidal relationships between intervention parameters and outcomes. However, inter-individual variability frequently renders these relationships nebulous and difficult to characterize. Advanced modeling approaches that account for this variability include:
- Multilevel Bayesian Modeling: Incorporates individual differences as random effects within a hierarchical framework, allowing for partial pooling of information across individuals while preserving unique response patterns
- Gaussian Process Regression: Captures complex, non-linear response surfaces without pre-specified functional forms, ideal for modeling irregular dose-response relationships
- State-Space Modeling: Separates underlying neural dynamics from measurement noise, enabling more accurate characterization of true response patterns
Integration of Multimodal Data
Comprehensive characterization of dose-response relationships requires integration of multimodal data, including structural imaging, functional connectivity, neurochemical measures, and behavioral assessments. This integration enables the development of personalized response profiles that account for the multifaceted nature of individual differences in brain structure and function [63]. Data fusion techniques such as multimodal canonical correlation analysis and joint independent component analysis facilitate the identification of cross-modal relationships that may underlie differential response patterns.
Probabilistic framework for personalized neurostimulation
Implementation Considerations and Future Directions
Practical Implementation Guidelines
Successful navigation of inter-individual variability and nebulous dose-response relationships requires careful consideration of several practical implementation factors:
- Resource Allocation: Balance between scan time per participant and total sample size based on specific research goals and budgetary constraints, with 30-minute scans generally providing optimal cost-efficiency [64]
- Protocol Standardization: Implement consistent imaging and stimulation protocols while maintaining flexibility for individual adaptation based on real-time response monitoring
- Data Quality Assurance: Establish rigorous quality control procedures for both data acquisition and processing, with particular attention to factors influencing measurement reliability
- Analytical Transparency: Document and share analytical pipelines to enhance reproducibility and facilitate cross-study comparisons
Emerging Frontiers and Technologies
Several emerging technologies and methodologies show particular promise for advancing our understanding and management of inter-individual variability:
- High-Density Electrophysiology: Provides unprecedented temporal resolution for capturing dynamic brain states and their variability across individuals
- Closed-Loop Stimulation Systems: Enable real-time adjustment of stimulation parameters based on ongoing neural activity, potentially optimizing efficacy for each individual
- Multiscale Computational Modeling: Bridges gaps between molecular, cellular, circuit, and systems-level variability to develop comprehensive explanatory frameworks
- Advanced Genetic Profiling: Identifies genetic contributors to individual differences in brain function and intervention response
The continued development and integration of these approaches will progressively transform nebulous dose-response relationships into predictable, quantifiable interactions, ultimately advancing both basic neuroscience and clinical applications through personalized intervention approaches.
Phase 1 clinical trials represent a critical juncture in drug development, yet traditional designs often fail to adequately power pharmacodynamic (PD) assessments, particularly in the context of non-invasive brain imaging. This technical guide examines the systematic shortcomings of conventional Phase 1 approaches and provides methodological frameworks for designing sufficiently powered PD studies. By integrating model-based drug development strategies, advanced neuroimaging modalities, and optimized statistical approaches, researchers can significantly de-risk subsequent development phases and improve clinical outcomes in psychiatry and neurology. The implementation of these methodologies enables reliable detection of functional target engagement, precise dose-response characterization, and informed indication selection early in clinical development.
Traditional Phase 1 clinical trials are primarily designed to assess safety and tolerability in small cohorts of 20-100 participants [65]. While these designs adequately address pharmacokinetic (PK) and safety objectives, they suffer from critical limitations in evaluating pharmacodynamic effects, especially when utilizing non-invasive brain imaging techniques. The prevailing practice of enrolling only 4-6 participants per dose group generates unrealistically large effect size estimates that frequently fail to replicate and provides insufficient statistical power for detecting meaningful biological signals [2].
Neuroimaging, across modalities including positron emission tomography (PET), electroencephalography (EEG), and functional magnetic resonance imaging (fMRI), has been a mainstay of clinical neuroscience research for decades yet has achieved limited penetration into psychiatric drug development beyond often underpowered Phase 1 studies [2]. This inadequacy is particularly problematic given the pressing need to improve probability of success in drug development and enhance clinical efficacy through a precision psychiatry framework. The failure to properly power Phase 1 PD studies results in the counterproductive advancement of early-stage risk into later-stage trials, contributing to the dismal 9.6% rate of drugs entering Phase 1 ultimately achieving market approval [65].
Quantitative Landscape of Current Phase 1 Trials
A systematic review of 475 Phase 1 trials published between 2008-2012, enrolling 27,185 participants, reveals important patterns in current designs and risk profiles. These data provide a baseline for understanding the statistical context in which PD assessments must be powered.
Table 1: Safety Profile of Phase 1 Trials from Systematic Review (n=475 trials, 27,185 participants) [66]
| Metric | Median Incidence | Interquartile Range |
|---|---|---|
| Serious Adverse Events | 0 per 1000 treatment group participants/day | 0-0 |
| Severe Adverse Events | 0 per 1000 treatment group participants/day | 0-0 |
| Mild/Moderate Adverse Events | 1147.19 per 1000 participants | 651.52-1730.9 |
| Mild/Moderate Adverse Events | 46.07 per 1000 participants/AE monitoring day | 17.80-77.19 |
Table 2: Characteristics of Phase 1 Trials from Systematic Review [66]
| Trial Feature | Distribution (%) |
|---|---|
| Investigational Agent Type | |
| Non-antibiotic small molecule | 52.8% |
| Vaccine | 26.1% |
| Biologic | 8.4% |
| Antibiotic | 3.4% |
| Funding Source | |
| Pharmaceutical/Biotech/Medical Device Industry | 60.8% |
| Government | 16.0% |
| Government + Industry | 5.1% |
| Non-profit/NGO | 3.2% |
The demonstrated safety profile of Phase 1 trials, with minimal severe or serious adverse events, suggests that scope exists for more robust PD assessment without compromising participant safety. However, current trial designs do not leverage this safety profile to enhance PD data collection.
Statistical Framework for Adequate Powering
Conventional vs. Exposure-Response Power Methodologies
A fundamental limitation in traditional Phase 1 trials is the application of conventional power calculations to PD endpoints. The standard hypothesis testing framework for binary endpoints compares response probabilities between dose groups (H₀: P₁ = P₂ vs. Hₐ: P₁ ≠ P₂) using normal approximation [67]. This approach fails to leverage available PK information and requires larger sample sizes to achieve sufficient power.
The exposure-response methodology represents a paradigm shift by incorporating pharmacokinetic data from first-in-human studies into power calculations. This approach utilizes the relationship between drug exposure (e.g., area under the concentration-time curve, AUC) and response through logistic regression:
Where β₁ represents the slope of the exposure-response relationship, and the hypothesis test becomes H₀: β₁ = 0 vs. Hₐ: β₁ ≠ 0 [67]. This framework enables substantial sample size reductions while maintaining statistical power, particularly when leveraging prior knowledge from published data or preclinical models.
Table 3: Factors Influencing Exposure-Response Power Calculations [67]
| Factor | Impact on Power | Practical Considerations |
|---|---|---|
| Slope (β₁) | Steeper slopes increase power | Determined by drug potency and endpoint sensitivity |
| Intercept (β₀) | Higher background response increases power | Placebo effect or disease natural history |
| Number of Doses | More doses increase power | Operational complexity and cost |
| Dose Range | Wider ranges increase power | Limited by toxicity concerns |
| PK Variability (CV) | Lower variability increases power | Drug-specific metabolic profile |
Power Determination Algorithm
Implementing adequately powered Phase 1 PD studies requires a systematic simulation-based approach:
Power Determination Algorithm
This algorithm enables researchers to determine the minimum sample size required to achieve 80% power at a 5% significance level across various design scenarios. The approach accommodates different neuroimaging modalities, endpoint types, and anticipated effect sizes.
Neuroimaging Applications in Pharmacodynamic Assessment
Modality-Specific Considerations
Non-invasive brain imaging provides powerful tools for assessing pharmacodynamic effects in Phase 1 trials, but each modality presents unique considerations for study design and powering.
Table 4: Neuroimaging Modalities for Phase 1 Pharmacodynamic Assessment [2]
| Modality | Primary Applications | Sample Size Considerations | Implementation Factors |
|---|---|---|---|
| PET | Target occupancy, Brain penetration | Small samples (n=4-8) sufficient for occupancy studies | Limited tracer availability, High cost, Radiation exposure |
| EEG/ERP | Functional target engagement, Cognitive processing | Moderate samples (n=12-20) for dose-response | High temporal resolution, Accessibility at sites, Lower cost |
| fMRI | Functional connectivity, Brain activation | Larger samples (n=20-30) for robust effects | High spatial resolution, Motion sensitivity, Cost and availability |
PET imaging excels at demonstrating brain penetration and target occupancy but provides limited information on functional effects and requires specialized tracer development [2]. EEG and fMRI offer complementary advantages for functional target engagement, with EEG providing superior temporal resolution and fMRI offering enhanced spatial localization.
Integrated Pharmacodynamic Assessment Strategy
A comprehensive PD assessment strategy in Phase 1 trials should address four critical questions:
- Does the drug enter the human brain?
- What impact does the drug have on clinically relevant brain systems?
- What is the dose-response relationship for these brain effects?
- How do brain effects inform indication selection?
PD Assessment Strategy
This integrated approach enables de-risking of subsequent development phases by establishing proof of mechanism before proceeding to larger efficacy trials. The selection of specific neuroimaging modalities should be guided by the drug's mechanism of action and the functional circuits most likely to demonstrate engagement.
Modern Clinical Trial Designs for Enhanced Pharmacodynamic Assessment
Comparison of Contemporary Phase 1 Designs
Traditional 3+3 designs prioritize safety assessment but provide limited PD information. Modern adaptive designs offer enhanced capabilities for PD characterization while maintaining safety standards.
Table 5: Modern Phase 1 Trial Designs for Pharmacodynamic Assessment [68]
| Design | Key Features | PD Assessment Advantages | Implementation Challenges |
|---|---|---|---|
| BOIN (Bayesian Optimal Interval) | Higher probability of identifying true MTD, Overdose control | Model-assisted framework supports various endpoints | Limited dose-response modeling capabilities |
| CRM (Continual Reassessment Method) | Efficient MTD identification, Strategic patient allocation | Robust handling of complex dose-response relationships | Requires dedicated statistical expertise |
| BLRM (Bayesian Logistic Regression Model) | Incorporates historical data, Overdose control | Effective with complex dose-response patterns | Resource-intensive computing requirements |
| i3+3 with Backfill | Enhanced safety, Lower dose assessment | Enables rich PD data collection at lower doses | Conservative methodology may miss optimal dosing |
Model-Based Drug Development (MBDD) Framework
The implementation of MBDD has demonstrated potential for drastically reducing required study sizes in Phase II clinical trials, thereby reducing costs, time, and patient exposure [67]. In Phase 1 trials, MBDD principles can be applied to integrate PK-PD modeling, leverage prior information, and optimize dose selection for subsequent studies.
The key advantages of MBDD for Phase 1 PD assessment include:
- More precise dose-response characterization
- Integration of preclinical and early clinical data
- Quantitative support for decision making
- Identification of optimal dosing regimens based on both safety and PD markers
Implementation Framework and Researcher's Toolkit
Essential Research Reagent Solutions
Table 6: Key Reagents and Materials for Phase 1 Neuroimaging Studies
| Item | Function | Application Notes |
|---|---|---|
| Validated PET Tracers | Quantification of target occupancy | Requires specific affinity for molecular target |
| EEG Cap Systems | Recording of electrical brain activity | Multiple electrode configurations (32-256 channels) |
| fMRI Task Paradigms | Activation of specific neural circuits | Must engage target neural systems with sensitivity to drug effects |
| PK Assay Kits | Quantification of drug concentrations | Validation for specific matricies (plasma, CSF) |
| Biomarker Assays | Assessment of peripheral target engagement | Bridge between peripheral and central effects |
Protocol Recommendations for Adequately Powered Studies
Based on systematic review of current limitations and advanced methodologies, the following protocol elements are recommended for adequately powered Phase 1 PD studies:
Sample Sizes: Minimum of 12-16 participants per dose level for functional neuroimaging endpoints to detect moderate effect sizes (Cohen's d = 0.8-1.0) with 80% power.
Dose Selection: Include at least 4-5 active dose levels spanning the anticipated therapeutic range, plus placebo, to adequately characterize dose-response relationships.
Study Design: Implement crossover designs where feasible to increase statistical power and reduce subject-to-subject variability.
Endpoint Selection: Prioritize neuroimaging measures with established test-retest reliability and demonstrated sensitivity to pharmacological manipulation.
Statistical Analysis Plan: Pre-specified analysis strategies including model-based approaches and appropriate correction for multiple comparisons.
Overcoming the limitations of traditional Phase 1 trials through adequately powered pharmacodynamic studies represents a critical opportunity to improve the efficiency and success rate of CNS drug development. By implementing exposure-response powering methodologies, leveraging modern trial designs, and systematically integrating neuroimaging biomarkers, researchers can de-risk subsequent development phases and advance more promising therapeutics. The framework presented in this guide provides a practical roadmap for designing Phase 1 trials that deliver meaningful pharmacodynamic insights while maintaining rigorous safety standards.
The exponential growth of data generated by non-invasive brain imaging technologies presents both unprecedented opportunities and significant challenges for neuroscience research. Inconsistent data collection parameters, heterogeneous processing pipelines, and isolated data management practices undermine scientific reproducibility and impede cross-study validation. The FAIR data principles—ensuring data is Findable, Accessible, Interoperable, and Reusable—provide a critical framework for addressing these challenges [69]. Within the context of non-invasive brain imaging, standardization guided by FAIR principles transforms scattered datasets into collectively intelligible resources that can accelerate discovery in basic neuroscience and drug development.
The NIH BRAIN Initiative has identified informatics infrastructure and data standardization as essential components of modern neuroscience research, establishing dedicated programs to support the development of data archives, computational tools, and community standards [69]. This technical guide examines the implementation of FAIR principles specifically for non-invasive brain imaging methodologies, providing researchers with practical frameworks for enhancing the reproducibility and impact of their work.
Foundational Standards for Brain Imaging Data
The Brain Imaging Data Structure (BIDS)
The Brain Imaging Data Structure (BIDS) is a formal standard for organizing and describing neuroimaging datasets that has become the community norm for ensuring interoperability [70]. BIDS establishes a consistent folder structure and file naming convention that captures essential experimental metadata alongside the primary imaging data. By adopting BIDS, researchers make their datasets immediately comprehensible to collaborators and the broader scientific community without requiring extensive additional documentation.
The standard specifies how to organize structural, functional, and diffusion-weighted MRI data, as well as data from other modalities, in a way that computational tools can reliably parse. The BIDS ecosystem includes validator tools that automatically check dataset compliance, reducing the potential for organizational errors that compromise data reuse. For non-invasive brain imaging particularly, BIDS standardizes how critical parameters—such as acquisition timing, task design, and participant characteristics—are documented in machine-readable format.
BRAIN Initiative Informatics Infrastructure
The BRAIN Initiative informatics program specifically supports the development of domain-specific infrastructure for neuroscience data, with particular emphasis on data archives that adopt and extend community standards [69]. This infrastructure includes:
- Data archives that provide access and software tools for analyzing data in cloud environments
- Adoption and development of data standards to support sharing, rigor, and reproducibility
- Computational tools for data integration, analysis, and visualization
The program promotes secondary analysis and reuse of BRAIN Initiative datasets through dedicated funding opportunities and support for FAIR principles implementation across diverse research domains, including next-generation imaging and integrated approaches to understanding circuit function [69].
Quantitative Frameworks for Data Standardization
Data Harmonization Techniques
Clinical and research brain imaging datasets exhibit inherent technical heterogeneity due to differences in scanner manufacturers, acquisition protocols, and site-specific parameters. Quantitative harmonization approaches are essential for enabling meaningful cross-dataset analysis while preserving biological signals of interest.
Table 1: Data Harmonization Methods for Multi-Site Studies
| Method | Application Context | Key Advantages | Implementation Considerations |
|---|---|---|---|
| ComBat | Batch effect correction for volumetric measures [71] | Preserves biological effects while removing scanner-specific technical variance | Requires sufficient sample size per site; models mean and variance separately |
| Linear Mixed Effects Models | Accounting for site variability in longitudinal studies | Flexible framework for incorporating both fixed and random effects | Computational intensity with large datasets; requires careful model specification |
| Data Simulation | Testing harmonization pipelines under controlled conditions | Enables validation of method performance against ground truth | Dependent on accurate acquisition modeling; may not capture all real-world variability |
The application of these methods is particularly valuable when integrating retrospectively collected clinical data with prospective research studies. For example, one recent study demonstrated that growth charts derived from clinical MRI scans with limited imaging pathology showed high correlation with those from research controls (median r = 0.979) after appropriate harmonization, supporting the value of curated clinical data for supplementing research datasets [71].
Standardization of Acquisition Parameters
Inconsistent data collection parameters represent a significant challenge for reproducibility in functional brain imaging. This issue is particularly evident in resting-state functional near-infrared spectroscopy (NIRS) studies, where systematic review has revealed substantial variability in fundamental acquisition parameters [72].
Table 2: Standardization of Resting-State NIRS Parameters
| Parameter | Documented Variability | Proposed Standard | Rationale |
|---|---|---|---|
| Scan Duration | 60 seconds to 20 minutes; 28% of studies unspecified [72] | Minimum 12 minutes | Aligns with fMRI protocols; captures slow fluctuations in functional connectivity |
| Eye Condition | 6% eyes open, 28% eyes closed, 63% unspecified [72] | Eyes open with fixation | Reduces likelihood of drowsiness/early sleep states that alter network connectivity |
| Fixation Symbol | Variable or unspecified across studies | White cross on black background | Widespread adoption in fMRI; minimizes visual stimulation while maintaining alertness |
| Instruction Set | "Think of nothing," "Let mind wander," etc. | "Let your mind wander freely" | Standardized cognitive set while allowing naturalistic mental activity |
These parameter inconsistencies significantly impact study findings and interpretation. Drawing parallels from functional MRI literature, scan duration directly affects reliability, with longer acquisitions (12+ minutes) demonstrating improved test-retest reliability due to increased sampling of the slowly evolving functional connectivity states [72]. Similarly, eye condition meaningfully influences brain activity patterns, with eyes-closed conditions associated with more active and less stable brain states [72].
Experimental Protocols for Reproducible Research
Data Collection Workflow
The experimental workflow for standardized neuroimaging data collection incorporates quality assurance at multiple stages to ensure data integrity and compliance with FAIR principles. The following Graphviz diagram illustrates this integrated process:
Data Curation and Quality Control Pipeline
Rigorous quality control procedures are essential for ensuring the reliability of neuroimaging data, particularly when working with heterogeneous clinical datasets. The following protocol outlines a standardized approach for curating clinical brain MRI data for research use:
Radiology Report Review: Initial screening of signed radiology reports to exclude scans with clinically significant pathology, using predefined exclusion criteria (e.g., mentions of brain surgery, tumor-related disorders, or large motion artifacts) [71].
Sequence Harmonization: Restriction to specific scanner models and harmonized acquisition sequences (e.g., 3.0-T MRI scanners with magnetization-prepared rapid acquisition gradient-echo (MPRAGE) T1-weighted sequences) to minimize technical variability [71].
Data Organization: Conversion to Brain Imaging Data Structure (BIDS) format using tools like heudiconv to establish standardized directory structures and file naming conventions [71].
Quality Assessment: Implementation of both automated and manual quality review processes, including:
- Automated quality metrics (e.g., Euler number as a robust measure of image quality)
- Visual inspection by trained raters to exclude scans with excessive motion, artifacts, or other quality issues [71]
Batch Effect Correction: Application of harmonization methods like ComBat to control for effects of different MRI scanners while preserving biological signals of interest [71].
This curation pipeline enabled one study to develop high-quality brain growth charts from clinical data that showed remarkable concordance with research-derived charts (median phenotype trajectory correlation of r = 0.979), demonstrating the feasibility of extracting research-grade data from clinical sources through rigorous standardization [71].
Computational Tools for FAIR Implementation
Essential Research Reagents and Software Solutions
The implementation of FAIR principles requires a suite of computational tools and platforms that collectively support the entire data lifecycle. The BRAIN Initiative informatics program specifically supports the development of such infrastructure to serve particular domains of scientific research [69].
Table 3: Research Reagent Solutions for FAIR Neuroimaging
| Tool Category | Specific Solutions | Function in FAIR Workflow |
|---|---|---|
| Data Standards | BIDS Validator [70] | Ensures organizational compliance with community standards for interoperability |
| Data Archives | BRAIN Initiative archives [69] | Provides persistent storage with unique identifiers for findability and accessibility |
| Harmonization Tools | ComBat [71] | Removes technical artifacts while preserving biological signals for reusable data |
| Computational Platforms | Cloud analysis environments [69] | Enables analysis of archived data without download, enhancing accessibility |
| Quality Assessment | Automated QC pipelines [71] | Provides quantitative metrics for data reliability assessment |
Signaling Pathways for Data Management
The following Graphviz diagram illustrates the conceptual workflow and decision points in implementing FAIR data principles for neuroimaging research, showing the logical relationships between different components of the data management process:
The standardization of data collection, processing, and management practices represents a fundamental requirement for advancing reproducible research in non-invasive brain imaging. By implementing the FAIR principles through community standards like BIDS, quantitative harmonization techniques, and dedicated informatics infrastructure, researchers can transform isolated datasets into collectively intelligible resources. The BRAIN Initiative's emphasis on data archives, standards development, and computational tools provides a framework for this transformation [69]. As the field continues to evolve, adherence to these principles will be essential for maximizing the scientific value of brain imaging data, enabling more robust discovery in basic neuroscience and more efficient therapeutic development for neurological and psychiatric disorders.
The one-size-fits-all approach in neuromodulation is becoming obsolete. Advances in brain connectivity mapping and stimulation technologies are driving a paradigm shift toward personalized protocols that account for individual neuroanatomical and functional differences. This technical review synthesizes current methodologies demonstrating how personalized targeting based on connectivity fingerprints can significantly enhance therapeutic outcomes in neuropsychiatric disorders. We present quantitative evidence, detailed experimental protocols, and analytical frameworks that enable researchers to transition from generalized to precision neuromodulation, ultimately improving efficacy and reducing variability in treatment response.
The Foundation: Brain Connectivity Mapping Techniques
Understanding individual brain connectivity is the cornerstone of personalized neuromodulation. Several advanced imaging and analytical methods have emerged to characterize the unique connectomic profiles of individuals.
Resting-State Functional Connectivity (RFC) Analytics
Resting-state fMRI has evolved beyond simple correlation analyses. The Quantitative Data-Driven Analysis (QDA) framework provides threshold-free, voxel-wise connectivity metrics without requiring a priori models [73]. This method derives two primary indices:
- Connectivity Strength Index (CSI): Quantifies the strength of a voxel's connection to the rest of the brain
- Connectivity Density Index (CDI): Measures the density of a voxel's functional connections
Separate assessment of negative and positive components of these metrics enhances sensitivity to aging and pathological effects, with studies demonstrating age-related RFC declines in default mode network (DMN) regions including the posterior cingulate cortex (PCC) and right insula [73].
Graph Theoretical Approaches for Hub Identification
The Multi-criteria Quantitative Graph Analysis (MQGA) method enables quantitative analysis of brain network hubs using multiple graph theoretical indices [74]. This approach utilizes:
- Betweenness centrality: Identifies nodes that facilitate information flow between network modules
- Degree centrality: Measures the number of connections a node has
- Participation coefficient: Quantifies how a node's connections are distributed across different modules
MQGA defines two critical hub types: connector hubs (high betweenness centrality, facilitating inter-modular communication) and provincial hubs (high degree centrality within modules). Research indicates connector hub removal impacts network integrity more severely than provincial hub removal, highlighting their critical role in brain network stability [74].
Benchmarking Functional Connectivity Methods
A comprehensive benchmarking study of 239 pairwise interaction statistics revealed substantial variation in FC network properties depending on the chosen metric [75]. Key findings include:
Table 1: Performance of Select FC Method Families Across Benchmarking Criteria
| Method Family | Structure-Function Coupling (R²) | Distance Correlation | Hub Distribution | Individual Fingerprinting |
|---|---|---|---|---|
| Precision-based | 0.25 (Highest) | Moderate | Transmodal regions | High |
| Covariance-based | 0.20 | Strong inverse | Sensory regions | Moderate |
| Spectral measures | 0.15 | Weak | Distributed | Moderate |
| Distance measures | 0.10 | Strong positive | Distributed | Low |
Precision-based methods (e.g., partial correlation) consistently showed superior structure-function coupling and alignment with multimodal neurophysiological networks, including neurotransmitter receptor similarity and electrophysiological connectivity [75].
Personalized Neuromodulation: From Targeting to Intervention
Non-Invasive Neuromodulation Modalities
Non-invasive techniques continue to dominate therapeutic applications due to their safety and reversibility [14]:
- Transcranial Magnetic Stimulation (TMS): Allows circuit-based targeting through personalized coil positioning informed by individual connectivity maps
- Transcranial Direct Current Stimulation (tDCS): Prefrontal cortex modulation can enhance executive functions (working memory, inhibitory control), though effect variability necessitates precision protocols
- Transcutaneous Auricular Vagus Nerve Stimulation (taVNS): Demonstrates favorable safety profile but requires rigorous dose optimization and longitudinal monitoring
Invasive Mapping for Refractory Disorders
For severe, treatment-refractory cases, invasive brain mapping enables unprecedented personalization. A groundbreaking protocol for Obsessive-Compulsive Disorder (OCD) involves [76]:
- Implantation: Twelve stereoelectroencephalography (sEEG) electrodes with sixteen contacts each are implanted bilaterally across cortico-striato-thalamo-cortical (CSTC) circuits
- Stimulation Mapping: Extensive testing across three phases:
- Phase 1: Safety testing with brief stimulation trains (1-6 mA, 1-30 s)
- Phase 2: 5-minute stimulation trains to identify self-reported symptom improvement
- Phase 3: 20-minute randomized, sham-controlled stimulation of top candidate sites
- Biomarker Identification: Intracranial EEG recordings during symptom assessments identify electrophysiological correlates of OCD severity (high-frequency activity in OFC and ACC)
- Therapeutic Implantation: Chronic DBS leads are implanted at personalized targets identified during mapping
This approach identified two targets within the right ventral capsule that acutely reduced OCD symptoms and suppressed high-frequency activity in connected orbitofrontal and cingulate cortex [76].
Figure 1: Invasive brain mapping workflow for personalized DBS target identification in OCD
Advanced Modulation Technologies
Emerging precision neuromodulation techniques offer enhanced spatiotemporal resolution and cell-type specificity [77]:
- Optogenetics: Provides millisecond precision for controlling specific neural circuits; newly developed protocols enable manipulation of long-range feedback circuits critical for attention and perception [78]
- Temporal Interference Stimulation: Uses intersecting electric fields to stimulate deep brain structures non-invasively
- Sonogenetics: Combines ultrasound with genetic targeting for precise neural control
- Magnetogenetics: Utilizes magnetic-sensitive proteins for remote neural activation
Table 2: Comparative Analysis of Neuromodulation Techniques Across Precision Dimensions
| Technique | Spatial Resolution | Temporal Resolution | Cell-Type Specificity | Depth | Clinical Feasibility |
|---|---|---|---|---|---|
| Optogenetics | Single cell | Milliseconds | High | Limited | Low (invasive) |
| DBS | mm | Milliseconds | Low | Deep | High (invasive) |
| TMS | cm | Milliseconds | Low | Superficial | High |
| tDCS | cm | Minutes | Low | Superficial | High |
| Temporal Interference | mm | Milliseconds | Low | Deep | Moderate |
| Focused Ultrasound | mm | Seconds | Moderate | Deep | Moderate |
Experimental Protocols and Workflows
Connectivity-Guided Neuromodulation Protocol
For researchers implementing personalized neuromodulation, the following workflow integrates connectivity assessment with targeted intervention:
Phase 1: Connectomic Profiling
- Acquire high-resolution structural MRI (T1-weighted, ≤1 mm³)
- Collect resting-state fMRI (8-12 minutes, eyes open, standardized instructions)
- Process data using standardized pipelines (e.g., fMRIPrep, HCP pipelines)
- Calculate functional connectivity matrices using precision-based statistics
- Perform graph theoretical analysis to identify individual hub architecture
Phase 2: Target Identification
- Define target network based on clinical presentation (e.g., DMN for depression, SN for OCD)
- Identify node with maximal connectivity within target network
- Verify spatial accuracy with neuromavigation system
- Determine stimulation parameters based on individual computational models
Phase 3: Intervention and Verification
- Apply neuromodulation with neuronavigation guidance
- Collect immediate post-stimulation fMRI to verify target engagement
- Implement repeated sessions with connectivity monitoring
- Adjust parameters based on connectivity changes and clinical response
Optogenetic Circuit Mapping Protocol
For precise circuit manipulation in animal models, the Houston Methodist protocol provides [78]:
- Viral Vector Delivery: Inject custom AAV vectors carrying channelrhodopsin or archaerhodopsin genes into targeted cortical regions
- Optic Fiber Implantation: Position fibers for precise light delivery to terminal regions
- Transfection Verification: Perform tissue biopsy to confirm successful transfection without postmortem examination
- Behavioral Measurement: Implement cognitive tasks during optical stimulation/inhibition
- Neural Recording: Simultaneously record neural activity to quantify circuit modulation effects
This protocol enables selective control of feedforward and feedback circuits, with particular relevance to attention disorders and stroke recovery [78].
Figure 2: Optogenetic circuit mapping workflow for precise neural control
Table 3: Critical Reagents and Tools for Connectivity-Guided Neuromodulation Research
| Resource Category | Specific Tools/Reagents | Function/Application |
|---|---|---|
| Imaging Analytics | QDA Framework [73] | Derives threshold-free voxel-wise connectivity metrics (CSI, CDI) |
| MQGA Algorithm [74] | Quantifies connector and provincial hubs using multi-graph indices | |
| PySPI Package [75] | Implements 239 pairwise statistics for FC matrix calculation | |
| Stimulation Devices | TMS with Neuromavigation | Enables precise targeting based on individual anatomy |
| tDCS High-Definition electrodes | Provides focused current delivery | |
| Optogenetic hardware | Allows precise circuit control in animal models | |
| Analytical Platforms | Diffusion MRI tractography | Maps structural connectivity for target identification |
| Computational modeling | Predicts current spread/electric field distribution | |
| HCP processing pipelines | Standardizes neuroimaging data analysis |
Future Directions and Implementation Challenges
The field faces several critical challenges that require multidisciplinary collaboration:
- Multimodal Data Integration: Developing methods to unify structural, functional, and metabolic imaging data to build cross-scale models of cognition [14]
- Dynamic Brain Imaging: Capturing neural dynamics during real-world tasks through advances in portable devices and real-time analytics [14]
- Causal Mechanism Validation: Combining neuromodulation with pre-post imaging (TMS-EEG, tDCS-fMRI) to strengthen causal inferences about network function [14]
- Standardization and Sharing: Establishing platforms for sharing data and analytical tools aligned with FAIR principles [14] [79]
Emerging technologies such as wearable TMS devices [14] and advanced optogenetic protocols [78] promise to bridge the gap between laboratory research and clinical application, ultimately enabling truly personalized neuromodulation therapies based on individual brain connectivity fingerprints.
The convergence of closed-loop neuromodulation, real-time analytics, and wearable neuroimaging is forging a new paradigm in neuroscience research and therapeutic development. These technologies enable a shift from static, open-loop interventions to dynamic, adaptive systems that respond to a patient's real-time neural and physiological state. Framed within the advancement of non-invasive brain imaging methods, this progress promises to de-risk drug development, create novel therapeutic pathways for neurological and psychiatric disorders, and provide unprecedented insights into brain function in naturalistic settings. This whitepaper provides an in-depth technical guide to the core technologies, experimental protocols, and essential research tools driving this field forward.
Current Hardware Platforms for Closed-Loop Research
The transition from open-loop to closed-loop systems is facilitated by a new generation of research hardware. These platforms vary in their level of invasiveness, sensing capabilities, and programmability, allowing researchers to select the appropriate tool for specific experimental or clinical questions.
Table 1: Comparison of Available and Emerging Closed-Loop Platforms
| Platform Name | Type | Key Recording Capabilities | Stimulation Capabilities | Notable Features | Primary Research Context |
|---|---|---|---|---|---|
| Neuro-stack [80] | Wearable, Bidirectional | 128-ch iEEG/LFP; 32-ch single-unit @ 38.6 kHz [80] | Up to 32-ch simultaneous; highly customizable pulse shapes & timing [80] | Full-duplex operation; on-body wearability for ambulatory studies; integrated theta-phase detection [80] | Invasive human studies (e.g., epilepsy monitoring) |
| Activa PC+S [81] | Implantable | Local field potential (LFP) sensing [81] | Standard DBS stimulation [81] | Foundational research platform for investigating biomarkers [81] | Invasive human studies (e.g., Parkinson's disease) |
| RNS System [81] | Implantable, Closed-Loop | iEEG sensing [81] | Responsive cortical stimulation [81] | FDA-approved for epilepsy; delivers stimulation in response to detected electrophysiological patterns [81] | Chronic invasive therapy & research (epilepsy) |
| Wearable fNIRS [82] | Non-invasive, Wearable | Hemodynamic response (Oxy-Hb, Deoxy-Hb) from prefrontal cortex [82] | N/A (Monitoring & Neurofeedback) | Wireless; self-administered; augmented reality guidance for placement; cloud-data integration [82] | Non-invasive human studies in naturalistic settings |
| Wearable EEG [83] | Non-invasive, Wearable | Electrical brain activity (e.g., alpha, beta waves) [83] | N/A (Monitoring & Neurofeedback) | Commercial headsets (Muse, Emotiv); high feasibility for remote monitoring [83] | Remote mental health, sleep, and neurological monitoring |
Core Signaling Pathways and System Workflows
A fundamental understanding of the signaling pathways and operational workflows is crucial for designing closed-loop experiments. The following diagrams, generated using Graphviz, illustrate the core logical relationships in these systems.
Generic Closed-Loop Neuromodulation Logic
Closed-Loop Neuromodulation Logic
This diagram depicts the core feedback principle of a closed-loop system. The process begins with Biomarker Sensing of electrophysiological (e.g., LFP, single-unit) or hemodynamic activity. The raw signal is processed to extract relevant features (Signal Processing), which are fed into a Control Algorithm that decides if and what kind of stimulation is needed. This decision triggers Stimulation Delivery, which modulates the Neural Circuit Response. The resulting change in neural activity is again sensed, creating a continuous Feedback Loop to maintain the desired Clinical Outcome [81] [80].
Experimental Workflow for Biomarker Discovery & Validation
Biomarker Discovery and Validation
This workflow outlines the methodology for identifying and validating neural biomarkers for closed-loop control. The process is iterative, beginning with a Hypothesize Biomarker based on prior literature. Researchers then Acquire Dense-Sampled Data over multiple sessions using platforms like wearable fNIRS or EEG to ensure reliability [82]. Data is Preprocess & Clean Signals to remove artifacts. Computational methods are used for Feature Extraction & Analysis (e.g., power in specific frequency bands, functional connectivity). The biomarker is then Validate Biomarker against behavioral or clinical measures before being Implement Closed-Loop Algorithm in the therapeutic system. The outcome of closed-loop testing often leads to Iterative Refinement of the original biomarker hypothesis [81] [82].
Detailed Experimental Protocols
Protocol for Invasive Single-Unit Recording and Closed-Loop Stimulation in Ambulatory Humans
This protocol, enabled by platforms like the Neuro-stack, allows for the investigation of single-neuron correlates of naturalistic behavior and the testing of personalized neuromodulation therapies [80].
- Primary Objective: To record single-neuron and local field potential (LFP) activity during freely moving behavior and to deliver customized closed-loop stimulation based on real-time neural decoding.
- Subject Population: Patients with medically refractory epilepsy already implanted with intracranial macro- and micro-electrodes (e.g., Depth electrodes, Stereo-EEG) for clinical monitoring [80].
- Equipment:
- Neuro-stack wearable neuromodulation system.
- Implanted macro-electrodes (for iEEG/LFP) and micro-electrodes (for single-unit recording).
- Cables and harness for on-body device mounting during ambulation.
- Windows tablet with custom GUI and API for experiment control.
- Procedure:
- Pre-Task Setup: Connect the Neuro-stack to the patient's intracranial lead ports. Secure the device to the patient using a wearable harness.
- Baseline Recording: Record at least 10 minutes of resting-state neural activity (single-unit, LFP, iEEG) while the patient is stationary.
- Behavioral Task: Instruct the patient to perform a naturalistic walking task or other ambulatory behavior (e.g., navigating a room, object interaction). Simultaneously record neural data from all channels.
- Real-Time Decoding (Optional): Use the integrated Edge TPU to run a pre-trained machine learning model for real-time inference on the neural data stream (e.g., to predict memory performance or movement intent) [80].
- Closed-Loop Stimulation: Program the Neuro-stack's API to deliver electrical stimulation based on a predefined trigger. This could be:
- Phase-Locked Stimulation (PLS): Using the built-in hardware to detect theta (3-8 Hz) power and trigger stimulation at a specific phase of the oscillation [80].
- Decoding-Based Stimulation: Using the output of the real-time decoder to initiate or adjust stimulation parameters.
- Data Synchronization: Ensure all neural data is synchronized with behavioral video recordings and task markers.
- Post-Hoc Analysis: Spike-sort single-unit data offline. Relate neural firing patterns and stimulation effects to behavioral measures.
Protocol for Non-Invasive, Dense-Sampled Functional Connectivity Mapping Using Wearable fNIRS
This protocol is designed for precision functional mapping in naturalistic environments, crucial for establishing individual-specific biomarkers for psychiatric disorders [82].
- Primary Objective: To assess the test-retest reliability and within-participant consistency of functional connectivity and activation patterns using a self-administered wearable fNIRS platform.
- Subject Population: Healthy adults or clinical populations (e.g., individuals with major depressive disorder).
- Equipment:
- Wireless, multichannel fNIRS headband focused on the prefrontal cortex.
- Tablet with AR-guided application for device placement and cognitive testing.
- Cloud-based data storage system.
- Procedure:
- Device Placement: Using the tablet's AR guidance, the participant self-positions the fNIRS headband on their prefrontal cortex to ensure reproducible placement across sessions [82].
- Dense-Sampling Schedule: Participants complete multiple sessions (e.g., 10 sessions over 3 weeks), each lasting approximately 45-60 minutes [82].
- Within-Session Protocol: Each session includes:
- Resting-State Recording: 7+ minutes of eyes-open rest.
- Cognitive Task Battery: Performance of standardized tasks on the tablet, such as:
- N-Back Task: To assess working memory.
- Flanker Task: To assess inhibitory control.
- Go/No-Go Task: To assess response inhibition.
- Each task should be practiced before recording to minimize learning effects.
- Data Acquisition: Oxy-Hb and Deoxy-Hb concentrations are recorded wirelessly throughout the session and synced with behavioral performance.
- Data Analysis:
- Preprocess signals to remove motion artifacts and physiological noise.
- Calculate functional connectivity matrices between fNIRS channels during rest and tasks.
- Compute task-evoked activation maps.
- Use Intraclass Correlation Coefficient (ICC) to evaluate within-subject reliability and between-subject specificity of functional maps across sessions [82].
- Outcome Measures: High ICC values (>0.8) would indicate that the platform can reliably capture individual-specific functional brain organization, a prerequisite for using such measures as biomarkers in clinical trials or for treatment selection.
The Scientist's Toolkit: Key Research Reagent Solutions
The following table details essential materials and tools for research in closed-loop stimulation and wearable neuroimaging.
Table 2: Essential Research Reagents and Materials for Closed-Loop and Wearable Neuroimaging Studies
| Item Name | Type | Function in Research | Example Use Case |
|---|---|---|---|
| Neuro-stack Platform [80] | Wearable Bi-directional Interface | Enables full-duplex recording of single-neuron/LFP activity and customizable stimulation in freely moving humans. | Investigating hippocampal theta phase-locked stimulation during spatial navigation [80]. |
| Wearable fNIRS Headband [82] | Non-invasive Hemodynamic Monitor | Measures cortical blood oxygenation changes wirelessly in naturalistic settings for dense-sampling studies. | Mapping individual-specific prefrontal functional connectivity patterns at home to find biomarkers for depression [82]. |
| Commercial EEG Headset [83] | Non-invasive Electrophysiology Monitor | Records electrical brain activity remotely for long-term monitoring and neurofeedback interventions. | Monitoring alpha wave activity in patients with chronic pain or anxiety during daily life [83]. |
| Control Algorithm (e.g., PID, Machine Learning) | Software/Code | The "brain" of the closed-loop system that translates sensed biomarkers into stimulation parameters. | Using a classifier to detect the onset of a pathological brain state (e.g., seizure) to trigger preemptive stimulation [81] [80]. |
| Edge TPU (Tensor Processing Unit) [80] | Hardware Accelerator | Allows for real-time inference of complex machine learning models directly on the wearable device. | Real-time decoding of memory states from MTL activity for closed-loop enhancement [80]. |
The integration of closed-loop stimulation, real-time analytics, and wearable devices represents a frontier in neuroscience and therapeutic development. These technologies provide a pathway from observation to causal intervention, and from laboratory constraints to ecologically valid, naturalistic research. For researchers and drug developers, mastering the platforms, protocols, and tools outlined in this whitepaper is critical for de-risking the development of new treatments and for ushering in a new era of precision neuromodulation. The future of treating brain disorders lies in dynamically personalized therapies that adapt to the individual's changing brain state, and the foundational elements for that future are being established today.
Technique Validation, Comparative Efficacy, and Integration with AI
In neurosurgical planning and neuromodulation research, Direct Cortical Stimulation (DCS) is universally regarded as the clinical gold standard for mapping eloquent brain functions. This in-depth technical guide examines the rigorous validation of two principal non-invasive technologies—functional Magnetic Resonance Imaging (fMRI) and navigated Transcranial Magnetic Stimulation (nTMS)—against this benchmark. The convergence of evidence indicates that while both non-invasive tools exhibit high sensitivity in identifying potential eloquent areas, nTMS generally provides superior spatial specificity for motor mapping. For language mapping, a multimodal integration of fMRI and nTMS yields the highest predictive value for postoperative outcomes. Furthermore, the emergence of artificial intelligence (AI) and closed-loop systems is poised to enhance the precision of these non-invasive methods, solidifying their role in pre-surgical planning and expanding their utility in personalized therapeutic neuromodulation. This guide provides researchers and clinicians with a detailed comparison of performance metrics, standardized experimental protocols, and a forward-looking toolkit for leveraging these technologies in both clinical and research settings.
Direct Cortical Stimulation (DCS), also referred to as intraoperative cortical stimulation mapping, involves the direct application of electrical current to the exposed cerebral cortex during awake craniotomy. It directly and causally demonstrates the criticality of a stimulated region for a given function (e.g., movement, language) by inducing transient functional disruption [84] [85]. This establishes a direct causal link between brain structure and function, providing an unparalleled level of confidence for surgical decision-making.
However, DCS carries significant limitations. It is inherently invasive, requiring a craniotomy, and is subject to constraints such as limited cortical coverage (defined by the craniotomy size), patient fatigue during lengthy awake procedures, and the risk of inducing electrographic seizures [84] [85]. These limitations drive the need for robust, non-invasive mapping techniques that can be performed preoperatively to guide surgical strategy, counsel patients, and, where possible, reduce the burden of intraoperative mapping.
The two most prominent non-invasive technologies benchmarked against DCS are:
- Functional MRI (fMRI): Measures the Blood-Oxygen-Level-Dependent (BOLD) signal, a hemodynamic surrogate of neuronal activity. Its key limitation is that it can identify areas participating in a network but cannot determine the criticality of a specific area for task performance [84] [86].
- Navigated TMS (nTMS): Uses electromagnetic induction to non-invasively stimulate focal cortical areas, creating a transient "virtual lesion." This allows for a causal, DCS-like interrogation of cortical function from outside the skull [87] [85].
The following sections provide a detailed quantitative and methodological breakdown of how these tools are validated against the DCS gold standard.
Quantitative Benchmarking Against DCS
Systematic reviews and comparative studies provide comprehensive data on the performance metrics of nTMS and fMRI when compared to DCS for mapping motor and language cortices.
Motor Cortex Mapping
Motor mapping is often considered the most straightforward validation, as the output—a motor evoked potential (MEP) or visible muscle twitch—is objective and quantifiable.
Table 1: Performance Metrics for Motor Cortex Localization
| Technique | Spatial Accuracy (Mean Distance to DCS focus) | Key Strengths | Key Limitations |
|---|---|---|---|
| nTMS | 2 - 16 mm [84] [85] | High spatial agreement; direct, causal measurement of cortical excitability; less affected by neurovascular uncoupling. | Accuracy can be influenced by stimulation intensity; mapping depth is cortically limited. |
| fMRI | Highly variable; can be postcentral in up to 1/3 of cases [87] | Excellent for network-level activation mapping; whole-brain coverage. | BOLD signal is an indirect metabolic correlate; spatial accuracy can be misleading; performance is suboptimal near tumors [84]. |
A direct comparison study concluded that nTMS produced higher agreement with DCS than fMRI for motor mapping, with fMRI sometimes localizing hand motor areas in the postcentral gyrus rather than the precentral gyrus [87].
Language Cortex Mapping
Language mapping is more complex due to the subjective nature of error detection and the distributed nature of the language network. Performance is typically reported in terms of sensitivity and specificity.
Table 2: Performance Metrics for Language Cortex Localization (vs. DCS)
| Technique | Sensitivity (Range) | Specificity (Range) | PPV (Range) | NPV (Range) |
|---|---|---|---|---|
| nTMS [84] [85] | 10% - 100% | 13.3% - 98% | 17% - 75% | 57% - 100% |
| fMRI [86] | ~100% | ~46% | N/R | N/R |
| Combined fMRI & nTMS [88] | 98% | 83% | 51% | 95% |
Abbreviations: PPV (Positive Predictive Value), NPV (Negative Predictive Value), N/R (Not Reported in the cited source).
The data reveals a critical insight: fMRI is highly sensitive but has low specificity, meaning it reliably identifies all potential language sites but also flags many non-essential regions [86]. Conversely, nTMS's performance varies widely but can be optimized with specific protocols. Most significantly, combining fMRI and nTMS synergistically leverages the high sensitivity of one with the improved specificity of the other, resulting in a much stronger correlation with DCS outcomes [88]. A combined protocol demonstrated an overall specificity of 83%, a positive predictive value (PPV) of 51%, a sensitivity of 98%, and a negative predictive value (NPV) of 95% when validated against DCS [88].
Detailed Experimental Protocols for Validation
To ensure reproducible and valid results, standardized experimental protocols are essential. Below are detailed methodologies for nTMS and fMRI language mapping as validated against DCS.
Protocol for nTMS Language Mapping
The following protocol is derived from the study by Ille et al., which established a high-correlation combined mapping protocol [88].
- Patient Preparation: Patients with left-sided perisylvian lesions are suitable candidates. Obtain informed consent. The procedure is performed preoperatively in a controlled setting.
- nTMS Equipment & Setup:
- Use a navigated TMS system with a figure-of-eight coil.
- Co-register the patient's structural MRI (e.g., T1-weighted) with the nTMS neuronavigation system.
- Ensure the patient is seated comfortably and the coil is stabilized relative to the head.
- Stimulation Parameters:
- Protocol: Repetitive nTMS (rTMS).
- Frequency: Typically 5-10 Hz trains.
- Intensity: Set to 100-110% of the resting motor threshold (RMT).
- Picture-to-Trigger Interval (PTI): 0 msec (stimulation onset synchronized with picture presentation) has been shown to be most reliable [88].
- Language Task:
- Task: Object naming task. Patients are presented with pictures of common objects and instructed to name them aloud.
- Stimulation Paradigm: During a subset of trials, a TMS pulse train is delivered to a predefined cortical target. Other trials are unstimulated controls.
- Error Analysis: Errors (e.g., anomia, paraphasias, neologisms) during stimulation are recorded. The Error Rate (ER) is calculated for each cortical parcel (e.g.,
errors/stimulations). - Thresholding: A region is defined as "language-positive" if its ER exceeds a predefined Error Rate Threshold (ERT). The most reliable ERTs are 15%, 20%, and 25%, or by applying the "2-out-of-3" rule (a site is positive if at least 2 out of 3 stimulations cause an error) [88].
Protocol for fMRI Language Mapping
This protocol is based on studies comparing fMRI with DCS for predicting postoperative language decline [86].
- Patient Preparation: Screen for MRI contraindications. Instruct the patient to remain as still as possible during the scan.
- fMRI Acquisition:
- Scanner: 3.0 Tesla MRI scanner.
- Sequence: Gradient echo-planar imaging (EPI) for BOLD contrast.
- Parameters: TR=2000ms, TE=30ms, flip angle=65°, FOV=22x22 cm, matrix size=64x64. Acquire ~30-40 axial slices with 3-4 mm isotropic voxels.
- Language Task Paradigm:
- Task: Auditory Description Decision Task (ADDT) is a robust option.
- Design: Blocked design, alternating between 30-second active and 30-second control blocks, repeated for 5 cycles.
- Active Condition: Patients listen to sentences defining items (e.g., from the Boston Naming Test) and press a button for "true" definitions.
- Control Condition: Patients listen to reverse speech with intermixed tones and press a button for tones.
- Data Analysis:
- Preprocessing: Includes slice-timing correction, motion correction, and spatial smoothing (e.g., 4mm FWHM Gaussian kernel).
- Statistical Analysis: Use a generalized least-squares time-series fit (e.g., in AFNI or SPM). Model the BOLD response to the active condition vs. control.
- Thresholding: Correct for multiple comparisons using cluster-based thresholding (e.g., Monte Carlo simulation) to achieve a family-wise error (FWE) corrected p-value < 0.05.
Workflow for Combined Non-Invasive Mapping
The most effective preoperative approach integrates both non-invasive methods. The following diagram illustrates the logical workflow for combining nTMS and fMRI to achieve the highest predictive power for DCS.
Diagram: Workflow for Combined Non-Invasive Language Mapping. This integrated protocol synergistically leverages fMRI's high sensitivity and nTMS's causal interrogation to create a high-confidence preoperative map, which is subsequently validated against the DCS gold standard.
The Researcher's Toolkit: Essential Reagents & Materials
Table 3: Key Research Reagents and Solutions for TMS/fMRI-DCS Validation Studies
| Item | Function / Rationale | Example / Specification |
|---|---|---|
| Navigated TMS System | Enables precise, MRI-guided targeting of TMS pulses to specific cortical areas with millimeter accuracy. | Systems from Nexstim (NBS) or MagVenture with Visor2. |
| MRI-Compatible EEG | Allows for concurrent fMRI-EEG-TMS studies to investigate state-dependent and network effects of stimulation. | TMS-compatible, carbon-fiber electrodes to reduce artifacts. |
| Figure-of-Eight TMS Coil | Provides focal stimulation, essential for mapping fine functional representations in motor and language cortices. | Cooled coils for sustained, high-frequency protocols. |
| Neuronavigation Software | Coregisters patient anatomy with stimulation site and functional data; critical for accuracy and reproducibility. | Integrated with nTMS system or standalone (e.g., BrainSight). |
| Standardized Naming Paradigms | Ensures consistency and comparability across language mapping studies (nTMS & fMRI). | Object naming tasks; Auditory Description Decision Task (ADDT). |
| Clinical rTMS Protocols | Provides validated stimulation parameters for therapeutic applications, such as treatment-resistant depression. | Theta-burst stimulation (TBS); 10 Hz rTMS to left DLPFC. |
| High-Definition Fiber Tracking | Visualizes subcortical white matter pathways, complementing cortical maps to plan surgical corridors. | Based on Diffusion Tensor Imaging (DTI) data. |
Emerging Technologies and Future Directions
The field of non-invasive brain mapping is rapidly evolving beyond static, one-size-fits-all protocols. Key future trends include:
- AI-Driven Precision Targeting: Machine learning algorithms are being applied to multimodal neuroimaging data (fMRI, DTI) to predict optimal TMS targets and treatment outcomes on an individual basis. This helps overcome the variability in brain anatomy and functional organization [89].
- State-Dependent Neuromodulation: Evidence shows that the effects of TMS are profoundly influenced by the current state of the targeted neural circuit. Closed-loop TMS-EEG systems that deliver pulses at a specific phase of the prefrontal alpha oscillation are being developed to enhance efficacy and reproducibility [90] [91].
- Concurrent fMRI-EEG-TMS: This multi-modal approach allows researchers to observe the immediate, brain-wide network effects of a TMS pulse with high spatial (fMRI) and temporal (EEG) resolution, providing unprecedented insight into its mechanisms of action [90] [92].
- Advanced Stimulation Protocols: Protocols like Stanford Neuromodulation Therapy (SNT), which uses fMRI-guided targeting and accelerated, high-dose iTBS, have demonstrated remarkable remission rates (~80%) in treatment-resistant depression, establishing a new paradigm for effective TMS therapy [89].
Rigorous validation against the gold standard of Direct Cortical Stimulation has firmly established the roles of both nTMS and fMRI in the modern neuroscientific and clinical toolkit. For motor mapping, nTMS demonstrates superior spatial accuracy and a more direct correlation with DCS. For the more complex language network, a combined multimodal approach that leverages the high sensitivity of fMRI and the causal, disruptive power of nTMS provides the most accurate preoperative prediction of eloquent cortex, maximizing patient safety and surgical confidence. The future of this field lies in personalizing these tools through AI and dynamic, state-dependent neuromodulation protocols, further bridging the gap between non-invasive mapping and the definitive gold standard.
Non-invasive neuroimaging has revolutionized our understanding of brain function, yet each modality inherently balances competing demands of spatial and temporal resolution. This trade-off represents a fundamental constraint in neuroscience research and drug development, where the ability to precisely localize neural events in space and time is paramount. Spatial resolution refers to the ability to distinguish between separate points in space, while temporal resolution indicates the ability to track changes over time. The inverse relationship between these dimensions dictates that techniques capturing rapid neural dynamics typically sacrifice precise localization, whereas methods providing detailed anatomical information often miss fast-evolving neural processes.
Understanding these trade-offs is crucial for selecting appropriate methodologies for specific research questions and for interpreting resulting data within the constraints of each technique. This analysis provides a comprehensive technical comparison of current non-invasive brain imaging modalities, with particular emphasis on emerging approaches that mitigate traditional limitations through multimodal integration and technological innovation.
Quantitative Comparison of Neuroimaging Modalities
The inherent trade-offs between spatial and temporal resolution across major neuroimaging modalities can be visualized through both qualitative rankings and specific technical capabilities. The table below summarizes these key characteristics:
Table 1: Spatial and Temporal Resolution Characteristics of Non-Invasive Brain Imaging Modalities
| Modality | Spatial Resolution | Temporal Resolution | Primary Signal Source | Key Applications in Research |
|---|---|---|---|---|
| fMRI (Ultra-high field) | Sub-millimeter (0.1-1 mm) [93] | Seconds (0.1-3 s) [93] | Hemodynamic (BOLD response) | Cortical layers/columns, small subcortical structures [93] [94] |
| fMRI (Conventional 3T) | 1-3 mm | 1-3 s | Hemodynamic (BOLD response) | Whole-brain functional connectivity, cognitive tasks |
| MEG | 5-10 mm | Millisecond (<0.1 s) | Magnetic fields from neural currents | Neural dynamics, oscillatory activity |
| EEG | 10-20 mm | Millisecond (<0.1 s) [95] | Electrical potentials from neural currents | Neural dynamics, clinical monitoring, brain-computer interfaces [95] |
| fNIRS | 10-30 mm [95] | ~1 second [95] | Hemodynamic (HbO/HbR concentration) | Portable functional imaging, clinical settings [95] |
| TUS (New Helmet) | ~1 mm precision [96] | Minutes (lasting effects) [96] | Mechanical modulation of neural activity | Targeted neuromodulation, therapeutic applications [96] |
When considering a qualitative scale of resolution capabilities (where 1+ represents lowest and 4+ represents highest), MRI generally offers the superior spatial resolution among non-invasive modalities, while EEG and MEG lead in temporal resolution [97]. However, it is important to note that these rankings represent general capabilities, and specific implementations—such as ultra-high field fMRI or advanced MEG systems—can significantly enhance these baseline characteristics.
Advanced Methodologies for Resolution Enhancement
Multimodal Integration Approaches
MEG-fMRI Fusion Using Transformer-Based Encoding Recent advances in multimodal integration demonstrate promising pathways for overcoming inherent resolution trade-offs. Jin et al. (2025) developed a transformer-based encoding model that combines MEG and fMRI data collected during narrative story comprehension tasks [98]. The methodology involves:
- Data Collection: Whole-head MEG recordings from participants listening to over seven hours of narrative stories, aligned with fMRI data from the same stimuli [98]
- Model Architecture: A shared latent layer representing estimated cortical source activity, trained to predict both MEG and fMRI responses simultaneously [98]
- Validation: Model performance was tested against single-modality encoding models and classic minimum-norm solutions, demonstrating superior prediction accuracy and generalizability across unseen subjects and modalities [98]
This approach achieved unprecedented spatiotemporal resolution by leveraging the temporal precision of MEG (millisecond) with the spatial specificity of fMRI (millimeter), effectively creating a unified picture of brain activity that preserves the advantages of both modalities [98].
Concurrent fNIRS-EEG Integration Another multimodal approach leverages the complementary strengths of fNIRS and EEG. The methodology typically follows three analytical frameworks [95]:
- EEG-informed fNIRS analysis: Using temporal features from EEG to inform the analysis of hemodynamic responses
- fNIRS-informed EEG analysis: Utilizing spatial information from fNIRS to constrain EEG source localization
- Parallel fNIRS-EEG analysis: Analyzing both datasets simultaneously to identify correlated neural and hemodynamic events
The theoretical basis for this integration relies on neurovascular coupling—the physiological relationship between neural electrical activity and subsequent hemodynamic responses [95]. This coupling ensures that the two modalities capture complementary aspects of the same underlying neural processes.
Technological Innovations in Single Modalities
High Spatiotemporal Resolution fMRI (gSLIDER-SWAT) Beckett et al. (2025) developed the gSLIDER-SWAT (generalized Slice Dithered Enhanced Resolution with Sliding Window Accelerated Temporal resolution) protocol to address limitations of conventional fMRI [94]. The technical implementation includes:
- Pulse Sequence: Spin-echo based gSLIDER acquisition with factor 5, acquiring 26 thin-slabs (5 mm thick), each acquired 5× with different slice phases [94]
- Reconstruction: SWAT reconstruction providing up to five-fold increase in effective temporal resolution (TR ~3.5 s compared to ~18 s for standard gSLIDER) [94]
- Parameters: FOV = 220×220×130 mm³; resolution = 1×1×1 mm³; TE = 69 ms; GRAPPA acceleration factor 3 [94]
This approach more than doubles the tSNR of traditional spin-echo EPI while reducing large vein bias and susceptibility artifacts, particularly beneficial for imaging regions prone to signal dropout such as the amygdala and orbitofrontal cortex [94].
Non-Invasive Deep Brain Stimulation via Ultrasound Helmet Treeby et al. (2025) developed a revolutionary ultrasound helmet for transcranial ultrasound stimulation (TUS) with unprecedented precision [96]. The experimental protocol involves:
- Device Configuration: 256-element ultrasound transducer array configured within a helmet design with a soft plastic face mask for precise head stabilization [96]
- Targeting: Focusing on deep brain structures (e.g., lateral geniculate nucleus of the thalamus) with precision approximately 1,000 times greater than conventional ultrasound systems [96]
- Validation: Simultaneous fMRI monitoring confirmed precise targeting and revealed sustained neuromodulatory effects lasting at least 40 minutes post-stimulation [96]
This technology enables non-invasive investigation of deep brain circuits previously accessible only through surgical methods, opening new possibilities for both basic neuroscience and clinical applications [96].
Visualization of Resolution Trade-offs and Methodologies
Core Trade-offs in Neuroimaging Modalities
The following diagram illustrates the fundamental inverse relationship between spatial and temporal resolution across major neuroimaging modalities:
Figure 1: Resolution trade-offs across neuroimaging modalities. EEG/MEG offer high temporal but lower spatial resolution, while fMRI provides high spatial but lower temporal resolution. Emerging techniques like fused MEG-fMRI aim to overcome this trade-off.
Multimodal Data Fusion Workflow
The integration of multiple imaging modalities follows a systematic workflow to maximize combined strengths:
Figure 2: Multimodal data fusion workflow. Simultaneous acquisition and computational integration create a unified representation surpassing single-modality limitations.
Table 2: Key Research Reagent Solutions for Advanced Neuroimaging Studies
| Resource | Type | Primary Function | Example Implementation |
|---|---|---|---|
| Transformer-Based Encoding Models | Computational Algorithm | Fuses multimodal data into unified spatiotemporal representation | Integrates MEG and fMRI data through shared latent layer estimating cortical source activity [98] |
| gSLIDER-SWAT MRI | Pulse Sequence & Reconstruction | Enables high spatiotemporal resolution fMRI at 3T | Combines slice-dithered acquisition with sliding window reconstruction for 1mm³ resolution at TR~3.5s [94] |
| 256-Element TUS Helmet | Hardware Device | Non-invasive deep brain stimulation with millimeter precision | Targets specific thalamic nuclei for neuromodulation studies, validated with simultaneous fMRI [96] |
| Tri-variate Color Mapping | Visualization Software | Enhances interpretation of multiparametric MRI data | Encodes three parameter maps simultaneously using CIELAB color space for improved diagnostic accuracy [99] |
| Concurrent fNIRS-EEG Systems | Integrated Hardware Platform | Simultaneously captures electrical and hemodynamic brain activity | Provides built-in validation through neurovascular coupling principle [95] |
Discussion and Future Directions
The continuing evolution of neuroimaging technologies demonstrates a consistent trend toward overcoming traditional resolution trade-offs. The methodologies detailed in this analysis—from multimodal data fusion to hardware innovations—represent significant advances in this pursuit. Each approach offers distinct advantages for specific research contexts, though practical considerations including cost, accessibility, and computational requirements remain important factors in methodology selection.
For neuroscientists and drug development professionals, these technological advances create new opportunities to investigate brain function with unprecedented precision. The ability to non-invasively track neural dynamics at millimeter and millisecond scales enables more nuanced investigation of neural circuits, potentially accelerating the development of targeted neuromodulation therapies. Furthermore, the validation of these techniques against invasive measures like electrocorticography [98] strengthens their utility as reliable tools for both basic research and clinical application.
Future developments will likely focus on further integration of complementary modalities, enhanced computational methods for data fusion, and continued hardware improvements to push the boundaries of both spatial and temporal resolution. Additionally, the development of more accessible high-resolution technologies, such as 3T fMRI methods that approach the resolution previously only achievable at ultra-high fields [94], promises to democratize these advanced capabilities across the research community.
Multimodal data integration represents a transformative approach in neuroscience, systematically combining complementary biological and clinical data sources to provide a multidimensional perspective of brain health and function [100]. In the context of non-invasive brain imaging, this involves the fusion of diverse neuroimaging modalities such as magnetic resonance imaging (MRI), electroencephalography (EEG), and positron emission tomography (PET). Each of these data types provides unique and valuable insights into brain structure, function, and metabolism, but when considered in isolation, they may offer an incomplete or fragmented view [100]. The integration of these diverse data sources enables a more nuanced and comprehensive understanding of neural mechanisms, enhancing the diagnosis, treatment, and management of various neurological and psychiatric conditions.
The fundamental objective of multimodal data integration is to leverage the complementary strengths of different data types to gain a more comprehensive understanding of a given problem or phenomenon [100]. By combining diverse data sources, multimodal approaches can enhance the accuracy, robustness, and depth of analysis. In neuroscience research, this is particularly critical due to the complexity of the human brain, with its 100 billion neurons and more than 100 trillion connections, much of which remains enigmatic to neuroscientists [101]. The application of artificial intelligence (AI) and machine learning has become instrumental in analyzing these complex multimodal datasets, already showing promise in various areas of health care and neuroscience [100].
Core Neuroimaging Modalities and Their Quantitative Profiles
Technical Specifications of Major Imaging Modalities
Non-invasive brain imaging modalities provide complementary information across spatial and temporal scales. The quantitative characteristics of major modalities used in multimodal integration are summarized in Table 1.
Table 1: Quantitative Comparison of Non-Invasive Neuroimaging Modalities
| Modality | Spatial Resolution | Temporal Resolution | Primary Measures | Key Applications in Drug Development |
|---|---|---|---|---|
| PET | 1-4 mm | Minutes to hours | Target occupancy, metabolism, receptor distribution | Brain penetration, molecular target engagement [2] |
| MRI/fMRI | 0.5-3 mm | Seconds | Blood oxygenation, cerebral blood flow, structural connectivity | Functional target engagement, dose-response relationships [2] |
| EEG/ERP | 10-20 mm | Milliseconds | Electrical potentials, neural oscillations | Functional target engagement, cognitive processing [2] |
| DiSpect MRI | 1-3 mm | Seconds | Venous blood flow sources, perfusion territories | Neurovascular coupling, arterial blood stealing [102] |
Emerging Modalities and Innovations
Recent technological advancements continue to expand the multimodal toolkit. Novel techniques such as Displacement Spectrum (DiSpect) MRI map blood flows "in reverse" to reveal the source of blood in the brain's veins, offering new insights into brain physiology [102]. This method tags information onto spins in the blood, tracking their "memory" as they travel from brain capillaries and smaller veins into larger veins, enabling researchers to decode information to determine where the blood originated [102]. Similarly, focused ultrasound approaches are being investigated for their potential to directly alter neural activity or target drug delivery when combined with nanotechnology [101].
Other innovations include transcranial magnetic stimulation (TMS), which sends magnetic pulses into the brain causing synchronized bursts of neural activity, and when paired with EEG, provides a direct window into how TMS treatment alters brain activity [101]. These advanced modalities increasingly contribute to multimodal frameworks, offering novel biomarkers and intervention approaches.
Experimental Protocols for Multimodal Integration
Protocol 1: Pharmacodynamic Target Engagement Studies
Objective: Determine the impact of an investigational drug on clinically relevant brain systems and functions across multiple modalities.
Design Considerations:
- Participant Allocation: Utilize within-participant designs where feasible to control for inter-individual variability. For traditional Phase 1 studies, avoid underpowered designs with only 4-6 patients per drug dose [2].
- Dose Selection: Include multiple dose levels to establish dose-response relationships for both functional outcomes and adverse events.
- Control Conditions: Incorporate appropriate control conditions (e.g., placebo, active comparator) to isolate drug-specific effects.
Multimodal Data Acquisition:
- PET Imaging Protocol (when applicable molecular target exists):
- Administer radioactive tracer specific to drug target
- Conduct baseline scan followed by post-drug administration scans
- Quantify target occupancy across brain regions
- Duration: 60-90 minutes per scanning session
Functional MRI Protocol:
- Acquire resting-state fMRI (5-10 minutes)
- Conduct task-based fMRI paradigms relevant to drug mechanism (15-30 minutes)
- Parameters: TR/TE = 2000/30 ms, voxel size = 2-3 mm isotropic
- Preprocessing: motion correction, normalization, spatial smoothing
EEG/ERP Protocol:
- Record resting EEG (5-10 minutes eyes closed)
- Implement cognitive ERP tasks (e.g., oddball, working memory)
- Parameters: 64-128 channels, sampling rate ≥ 500 Hz
- Preprocessing: filtering, artifact removal, baseline correction
Data Integration Analysis:
- Perform cross-modal correlation analyses between PET occupancy levels and fMRI/EEG effect sizes
- Establish dose-response curves for each modality separately then compare trajectories
- Use multivariate methods to identify multimodal signatures of target engagement
Protocol 2: Multimodal Cell Mapping for Structural-Functional Integration
Objective: Construct comprehensive maps of subcellular architecture through joint measurement of biophysical interactions and imaging data.
Experimental Workflow:
- Systematic Protein Tagging:
- Tag proteins in cellular systems (e.g., U2OS osteosarcoma cells) via lentiviral expression of C-terminal Flag–HA-tagged baits
- Isolate tagged proteins from whole-proteome extracts using affinity purification
- Identify interacting partners by tandem mass spectrometry (AP–MS)
Parallel Confocal Imaging:
- Stain cells with immunofluorescence antibodies against each protein target
- Co-stain with reference markers for nucleus, endoplasmic reticulum, and microtubules
- Acquire high-resolution confocal images (20,000+ images total)
Multimodal Data Fusion:
- Process two data streams separately to generate protein features for each modality
- Create unified multimodal embedding using self-supervised machine learning
- Position proteins such that original imaging and AP–MS features can be reconstructed with minimal loss of information while capturing relative similarities
- Compute all pairwise protein-protein distances and analyze using multiscale community detection
- Resolve protein assemblies as modular communities of proteins in close proximity [103]
Validation:
- Generate proteome-wide size-exclusion chromatography–mass spectrometry (SEC–MS) in the same cellular context
- Systematically validate identified assemblies against known complexes
- Annotate assemblies using large language models and expert curation
Computational Frameworks and Data Integration Workflows
The integration of multimodal data requires sophisticated computational frameworks capable of handling large, complex datasets. The following workflow diagrams illustrate representative pipelines for fusing structural, functional, and metabolic data.
Workflow 1: Multimodal Neuroimaging Integration for Drug Development
Multimodal Neuroimaging Pharmacodynamics Workflow
Workflow 2: Self-Supervised Multimodal Embedding for Cellular Architecture
Cellular Architecture Mapping Pipeline
The Scientist's Toolkit: Essential Research Reagents and Materials
Successful implementation of multimodal integration requires specific research tools and reagents. Table 2 catalogs essential resources for the described experimental protocols.
Table 2: Research Reagent Solutions for Multimodal Integration Studies
| Category | Specific Reagent/Resource | Function in Multimodal Research |
|---|---|---|
| Molecular Tags | C-terminal Flag–HA-tagged ORFeome library | Enables systematic protein tagging for interaction studies [103] |
| Imaging Reagents | Immunofluorescence antibodies with nuclear, ER, and microtubule reference markers | Provides subcellular localization data and reference landmarks [103] |
| PET Tracers | Target-specific radioactive ligands (e.g., for dopamine, serotonin receptors) | Quantifies molecular target engagement and occupancy [2] |
| Cell Models | U2OS osteosarcoma cell line | Standardized cellular context for multimodal mapping [103] |
| Data Fusion Tools | Self-supervised embedding algorithms | Integrates multimodal features while preserving information [103] |
| Validation Reagents | Whole-cell size-exclusion chromatography materials | Systematically validates identified assemblies [103] |
| Computational Resources | Urban Institute R package (urbnthemes) | Standardizes data visualization across modalities [104] |
Applications in Drug Development and Clinical Translation
De-risking Drug Development through Multimodal Biomarkers
The integration of multimodal data offers powerful approaches to de-risk drug development in neuroscience and psychiatry. As a pharmacodynamic measure, neuroimaging can determine brain penetration, assess whether relevant brain functions are affected by a drug, establish dose-response relationships for these targets, and guide indication selection [2]. Different neuroimaging modalities provide complementary perspectives on these questions. PET imaging readily answers questions about brain penetration through target occupancy measurements, while functional modalities like EEG and fMRI can address all pharmacodynamic questions by capturing drug effects at the functional level rather than just the molecular level [2].
A key application involves using multimodal biomarkers for patient stratification and selection in clinical trials. This enrichment approach, when applied to larger-scale Phase 2 and 3 trials, can identify patient subgroups most likely to respond to treatment, potentially leading to drug labels that incorporate neuroimaging biomarkers in defining the on-label population [2]. The anticipated result is improved clinical trial efficiency and more targeted therapeutic interventions.
Clinical Translation and Personalized Medicine
Multimodal integration shows particular promise for advancing personalized medicine in neurology and psychiatry. For example, in cognitive impairment associated with schizophrenia (CIAS), multimodal approaches have revealed that functional pro-cognitive effects of phosphodiesterase 4 inhibitors can be seen at sub-emetic doses, occurring at approximately 30% brain target occupancy [2]. This finding, confirmed through cognition-related EEG/ERP signals, demonstrates how thorough functional pharmacodynamic assessments can identify optimal dosing windows that might be missed by molecular imaging alone.
Advanced techniques like DiSpect MRI may further enhance clinical translation by providing safer, more efficient diagnostic methods for vascular conditions. This approach could potentially assess the health risk of arteriovenous malformations through a no-contrast, non-invasive method that identifies which artery is feeding a malformation, thereby guiding treatment decisions without risky invasive procedures [102].
Future Directions and Implementation Challenges
Despite the considerable promise of multimodal data integration, several challenges must be addressed to realize its full potential. Data standardization remains a significant hurdle, as different modalities often utilize distinct data formats, spatial resolutions, and temporal scales [100]. Computational bottlenecks present another challenge, particularly when processing large-scale multimodal datasets with current infrastructure [100]. Furthermore, model interpretability must be enhanced to provide clinically meaningful explanations that gain physician trust and facilitate translation to clinical practice [100].
Future developments will likely focus on the creation of large-scale multimodal models that enhance analytical accuracy across broader applications [100]. The expanded application of multimodal approaches to neurological and otolaryngological diseases represents another promising direction [100]. Additionally, the integration of emerging data sources such as wearable device outputs with traditional neuroimaging modalities may provide more comprehensive monitoring of brain health in real-world settings [100].
Successful implementation of multimodal integration in both drug development and clinical care will require a cultural shift to align biopharma and clinical practice toward a precision orientation already routine in other areas of medicine [2]. This transition necessitates commitment to collecting and analyzing multimodal data systematically throughout the drug development pipeline and developing standardized frameworks for their interpretation in clinical contexts.
Leveraging AI and Machine Learning for Predictive Analytics and Pattern Recognition
The field of non-invasive brain imaging is undergoing a revolutionary transformation, driven by the integration of sophisticated artificial intelligence (AI) and machine learning (ML) methodologies. For researchers, scientists, and drug development professionals, these technologies are unlocking new frontiers in the early detection, prediction, and treatment of neurological and psychiatric disorders. By moving beyond traditional descriptive analyses, AI-powered predictive analytics can identify subtle, multivariate patterns in complex neuroimaging data that are often invisible to the human eye. This capability is critical for developing objective biomarkers of brain health, personalizing therapeutic interventions, and accelerating drug development pipelines. This technical guide provides an in-depth examination of the core AI and ML techniques powering this progress, detailing specific experimental protocols, data handling practices, and analytical workflows essential for advancing research in non-invasive brain imaging.
Fundamental AI/ML Approaches in Neuroimaging
The application of AI in neuroimaging spans a spectrum of methodologies, from models that incorporate rich domain knowledge to end-to-end deep learning systems.
Pattern Recognition and Classification
Machine learning and pattern recognition techniques are foundational to classifying individuals based on their neuroimaging data with high sensitivity and specificity. These methods automatically extract robust and discriminative features from multimodal neuroimaging data to build classifiers that can distinguish subjects with brain disorders from healthy controls. Applications include the classification of morphological patterns using adaptive regional elements and multivariate examinations of brain abnormality using both structural and functional MRI [105].
Deep Learning for Prognostic Modeling
Deep learning models, particularly those utilizing recurrent neural networks and intrinsic functional networks, enable highly accurate brain decoding of subtly distinct brain states from functional MRI data. For example, deep learning prognostic models have been developed for the early prediction of Alzheimer's disease based on hippocampal MRI data, demonstrating the power of these techniques for long-term health forecasting [105].
Domain-Knowledge Integrated vs. End-to-End Models
ML models vary in how they incorporate domain knowledge:
- Physics-Based Models: Explicitly enforce consistency with the physics of the imaging process (e.g., MRI's Fourier transform or PET/CT's Radon transform).
- Feature-Based Methods: Utilize hand-crafted features known to be clinically relevant, reducing person-to-person variation.
- End-to-End Approaches: Abstract explicit feature definition, going from raw data directly to interpretable quantitative metrics of brain health via a single, unified pipeline [106].
Table 1: Categories of Machine Learning Models in Neuroimaging
| Model Category | Domain Knowledge Integration | Key Advantages | Common Applications |
|---|---|---|---|
| Physics-Based Models | Explicitly encodes imaging physics | Prevents nonsensical results; guided learning | Image reconstruction, motion correction |
| Feature-Based Methods | Uses clinically relevant features | Reduces manual labor and variation | Established clinical use cases |
| End-to-End Deep Learning | Minimal explicit feature definition | Discovers complex patterns automatically | Early disease prediction, biomarker discovery |
Predictive Analytics for Brain Disorders: Methodologies and Protocols
Experimental Workflow for Pattern Classification Studies
The following diagram outlines a generalized protocol for ML-based neuroimaging classification studies, applicable to conditions like schizophrenia and Alzheimer's disease:
Detailed Experimental Protocol
Data Acquisition and Preprocessing:
- Imaging Parameters: Acquire high-resolution T1-weighted structural MRI (e.g., MP-RAGE sequence, 1mm³ isotropic voxels) and resting-state fMRI (TR=2s, TE=30ms, 4mm³ voxels).
- Preprocessing Pipeline:
- Structural Processing: Skull-stripping using ROBEX or HD-BET, tissue segmentation into GM, WM, and CSF using SPM or FSL.
- Functional Processing: Slice-time correction, motion realignment, co-registration to structural images, normalization to standard space.
- Quality Control: Implement automated QC with manual inspection for motion artifacts, signal dropout, and registration accuracy.
Feature Extraction and Selection:
- Extract morphological features (cortical thickness, surface area, volume) using FreeSurfer.
- Compute functional connectivity matrices from preprocessed fMRI data.
- Apply feature selection algorithms (e.g., Lower Bound of Conditional Mutual Information) to identify the most discriminative features [105].
Model Training and Validation:
- Utilize cross-validation (nested 10-fold) to optimize hyperparameters and prevent overfitting.
- Train multiple classifier types (SVM, Random Forest, Neural Networks) for performance comparison.
- Validate on held-out test sets and external datasets when available to assess generalizability.
Protocol for Deep Learning Prognostic Modeling
For early prediction of Alzheimer's disease using hippocampal MRI [105]:
Network Architecture:
- Implement a 3D convolutional neural network with residual connections.
- Input: Hippocampal segmentations from T1-weighted MRI.
- Architecture: Encoder-decoder structure with skip connections for precise localization.
Training Protocol:
- Loss Function: Combined Dice loss and cross-entropy for segmentation tasks.
- Optimization: Adam optimizer with learning rate scheduling.
- Regularization: Dropout (0.3), L2 weight decay, and extensive data augmentation.
Validation Strategy:
- Longitudinal validation across multiple time points (baseline, 6, 12, 24 months).
- External validation on independent cohorts (e.g., ADNI, AIBL).
Data Management and Large-Scale Analysis
Working with large-scale neuroimaging datasets presents unique challenges that require specialized approaches.
Data Lifecycle Management
Table 2: Comparison of Data Types in Large-Scale Neuroimaging Studies
| Data Characteristic | Raw Data (NIfTI) | Processed Data |
|---|---|---|
| Storage Requirements | ~1.35 GB per individual (ABCD dataset) | ~25.6 MB for connectivity matrices |
| Processing Time | 6-9 months for download, processing, and QC | Ready for immediate analysis |
| Flexibility | Full control over preprocessing pipelines | Limited to original processing decisions |
| Example Use Cases | Methodological development, custom parcellations | Rapid hypothesis testing, replication studies |
Practical Recommendations:
- Data Organization: Adopt Brain Imaging Data Structure (BIDS) standard for all raw data [107].
- Storage Strategy: Implement a tiered storage system with raw data on secure servers and processed data on high-performance computing clusters.
- Documentation: Maintain detailed records of all processing steps, software versions, and quality control metrics.
Quality Control at Scale
For large datasets (e.g., UK Biobank, ABCD study), traditional GUI-based quality control becomes impractical. Implement programmatic QC pipelines that:
- Generate visualization composites for each participant.
- Automate detection of common artifacts (motion, field inhomogeneities).
- Compile results into interactive HTML reports for efficient manual review [7].
Advanced Applications and Emerging Methodologies
AI-Enhanced Image Acquisition and Reconstruction
Machine learning approaches are revolutionizing the earliest stages of the neuroimaging pipeline:
Accelerated Reconstruction:
- Model-Based Optimization: Iteratively refine solutions to under-determined inverse problems in MRI, CT, and PET imaging.
- Deep Learning Methods: Quickly estimate solutions to inverse imaging problems using architectures that explicitly incorporate imaging physics.
- Sampling Optimization: Use ML to identify optimal k-space acquisition patterns in MRI, tailored to specific anatomies or clinical questions [106].
Artifact Correction:
- Implement neural network layers that operate in both frequency and image space to correct acquisition artifacts while performing accelerated reconstruction.
- Apply deep learning for metal artifact reduction in CT imaging of patients with deep brain stimulation devices.
Non-Invasive Neuromodulation and Treatment Monitoring
The following diagram illustrates the integration of AI with emerging non-invasive neuromodulation technologies like Transcranial Ultrasound Stimulation (TUS):
Experimental Protocol for TUS with AI Monitoring:
- Device Configuration: 256-element ultrasound helmet with soft plastic face mask for precise targeting.
- Target Selection: Focus on deep brain structures (e.g., thalamus, LGN) with 30x better precision than previous systems.
- AI Integration:
- Use real-time fMRI to monitor neural effects of stimulation.
- Apply ML algorithms to detect stimulation-induced activity changes.
- Implement closed-loop systems that adjust stimulation parameters based on neural response patterns [96].
Research Reagent Solutions
Table 3: Essential Resources for AI-Enabled Neuroimaging Research
| Resource Category | Specific Tools/Platforms | Function/Purpose |
|---|---|---|
| Public Datasets | UK Biobank, ABCD Study, Human Connectome Project | Provide large-scale data for training and validation |
| Processing Frameworks | FSL, FreeSurfer, SPM, AFNI | Standardized preprocessing and analysis |
| ML Libraries | Scikit-learn, TensorFlow, PyTorch | Implementation of classification and prediction models |
| Visualization Tools | Nilearn, BrainSpace, Surf-ice | Programmatic generation of neuroimaging figures |
| Computing Infrastructure | XSEDE, Cloud computing platforms | Handle computational demands of large datasets |
Reproducible Visualization and Analysis
Adopt code-based visualization tools (R: ggseg, brainplot; Python: Nilearn, PySurfer; MATLAB: PlotBrains) to ensure replicability of findings [7]. Key benefits include:
- Exact Replication: Code establishes a direct link between data and scientific figures.
- Flexibility: Easy adjustment of statistical thresholds, color schemes, and viewing angles.
- Integration: Embed visualizations directly in reproducible reports using R Markdown, Quarto, or Jupyter Notebooks.
Validation and Interpretation Frameworks
Robust Validation Strategies
- Cross-Validation: Implement nested cross-validation to avoid optimistic performance estimates.
- External Validation: Test models on completely independent datasets from different institutions.
- Clinical Validation: Assess real-world clinical utility through prospective studies and correlation with clinical outcomes.
Model Interpretation Techniques
- Feature Importance: Calculate permutation importance or SHAP values to identify influential brain regions.
- Saliency Maps: Generate class activation maps to visualize regions driving deep learning decisions.
- Uncertainty Quantification: Implement Bayesian approaches to estimate prediction confidence.
The integration of AI and machine learning with non-invasive brain imaging represents a paradigm shift in neuroscience research and drug development. The methodologies outlined in this guide—from pattern classification and deep learning prognostic models to AI-enhanced image acquisition and closed-loop neuromodulation systems—provide researchers with powerful tools to extract clinically meaningful information from complex neuroimaging data. As these technologies continue to evolve, they promise to transform our understanding of brain health and disease, enabling earlier intervention, personalized treatment strategies, and more efficient therapeutic development. Success in this field requires not only technical expertise in AI methodologies but also careful attention to data management, validation practices, and reproducible research principles.
Evaluating Safety andfficacy Profiles Across Neuromodulation Techniques (TMS, tDCS, tACS, TUS)
Non-invasive neuromodulation techniques have emerged as powerful tools for both basic neuroscience research and clinical therapeutic development. These technologies allow researchers and clinicians to selectively modulate neural activity to investigate brain function and develop new treatments for neurological and psychiatric disorders. The four primary techniques—Transcranial Magnetic Stimulation (TMS), transcranial Direct Current Stimulation (tDCS), transcranial Alternating Current Stimulation (tACS), and Transcranial Ultrasound Stimulation (TUS)—each offer distinct mechanisms of action, efficacy profiles, and safety considerations. This technical guide provides an in-depth analysis of these modalities, focusing on their applications in depression research and cognitive enhancement, with detailed experimental protocols and safety parameters to inform research design and implementation within the broader context of non-invasive brain imaging methodologies.
Comparative Efficacy and Safety Profiles
Table 1: Comparative Efficacy of Neuromodulation Techniques for Depression
| Technique | Protocol | Population | Efficacy Measures | Effect Size/Outcome |
|---|---|---|---|---|
| TMS/rTMS | High-frequency (HF-rTMS) | Chinese MDD patients [108] | HAMD reduction vs. sham | SMD: -1.35 (CI: -1.92 to -0.78) [108] |
| Response rate | OR: 2.45 (CI: 1.58-3.78) [108] | |||
| Remission rate | OR: 2.68 (CI: 1.61-4.48) [108] | |||
| iTBS | Intermittent Theta Burst | MDD patients [109] | Remission vs. rTMS | OR: 1.01 (CI: 0.72-1.42) [109] |
| Response vs. rTMS | OR: 1.02 (CI: 0.76-1.35) [109] | |||
| HD-tDCS | 2 mA, left DLPFC, 12 days | Moderate-severe depression [110] | HAMD change vs. sham | Group difference: -2.2; Cohen's d: -0.50 [110] |
Table 2: Safety Profiles and Adverse Event Incidence
| Technique | Common Adverse Effects | Serious Adverse Effects | Risk Factors & Safety Thresholds |
|---|---|---|---|
| TMS/rTMS | Headache, dizziness, nausea [108] | Treatment-emergent mania (rare, equivalent to sham) [111] | Low risk in bipolar depression (OR=1.3 for mania) [111] |
| iTBS | Similar to rTMS [109] | No significant difference from rTMS [109] | Comparable safety profile to conventional rTMS [109] |
| tDCS/HD-tDCS | Mild scalp tingling, skin irritation [110] | No serious adverse events reported [110] | Well-tolerated at 2 mA with mild or no adverse effects [110] |
| TUS | Neck pain, sleepiness, scalp tingling (transient) [112] | No serious adverse effects reported [112] | Mechanical Index (MI) ≤1.9; temperature ≤39°C; thermal dose ≤2 CEM43 in brain [113] |
Table 3: Technical Parameters and Treatment Protocols
| Technique | Stimulation Parameters | Target | Session Duration & Frequency | Treatment Course |
|---|---|---|---|---|
| rTMS | High-frequency (10-20 Hz) [108] | Left DLPFC [108] | Varies by protocol | 10-20 sessions over 2-8 weeks [108] |
| iTBS | Intermittent theta burst pattern [109] | Left DLPFC [109] | Shorter session duration than rTMS | 10-21 sessions over 2-4 weeks [109] |
| HD-tDCS | 2 mA, personalized configuration [110] | Left DLPFC (x=-46, y=44, z=38 mm MNI) [110] | 20 minutes daily | 12 consecutive working days [110] |
| tACS | 40 Hz, 1 mA (conventional); 200 Hz carrier (AM-tACS) [114] | Prefrontal cortex [114] | 18 minutes during task | Single session [114] |
Detailed Experimental Protocols
TMS and iTBS Protocols for Depression
Repetitive TMS (rTMS) and its patterned variant, intermittent theta burst stimulation (iTBS), represent the most extensively validated neuromodulation approaches for major depressive disorder (MDD). The standard rTMS protocol for depression involves high-frequency stimulation (typically 10-20 Hz) applied to the left dorsolateral prefrontal cortex (DLPFC) using a figure-of-eight coil. A comprehensive meta-analysis of Chinese MDD populations demonstrated that active rTMS significantly reduced Hamilton Depression Rating Scale (HAMD) scores compared to sham (standardized mean difference = -1.35, 95% CI: -1.92 to -0.78, P < .00001) [108]. The same analysis found significantly improved response rates (OR = 2.45, 95% CI: 1.58-3.78) and remission rates (OR = 2.68, 95% CI: 1.61-4.48) with active stimulation [108].
iTBS offers a potentially more efficient treatment approach by delivering patterned stimulation in shorter session times. A recent meta-analysis directly comparing iTBS with conventional rTMS found no significant differences in remission (OR = 1.01, 95% CI: 0.72-1.42) or response rates (OR = 1.02, 95% CI: 0.76-1.35) [109]. The safety profile between the two approaches was also comparable (OR = 1.17, 95% CI: 0.83-1.66 for adverse effects) [109]. This suggests iTBS provides similar efficacy with potentially improved treatment efficiency.
For bipolar depression, recent evidence indicates TMS has comparable safety and efficacy to unipolar depression protocols. A systematic review of 56 articles representing 1,709 patients with bipolar depression found active TMS superior to sham (Cohen's d = 0.40) with low and equivalent rates of treatment-emergent mania compared to sham (OR = 1.3; 95% CI, 0.7-2.4) [111].
High-Definition tDCS Protocol for Depression
High-definition transcranial direct current stimulation (HD-tDCS) represents an advanced approach with improved targeting precision compared to conventional tDCS. A recent randomized clinical trial demonstrated the efficacy of personalized HD-tDCS for moderate to severe depression [110]. The protocol involves several key components:
Participant Selection: Patients meeting criteria for current major depressive episode with HAMD scores between 14-24, either treatment-naive or on stable antidepressant regimen [110].
Personalized Targeting: Structural MRI and frameless stereotaxic neuronavigation personalize the HD-tDCS configuration to target a specific left DLPFC location (MNI coordinates: x = -46, y = 44, z = 38 mm) [110].
Stimulation Parameters: The HD-tDCS configuration uses five 2×2-cm electrodes, with a central anodal electrode over the target and four return cathodal electrodes placed 5 cm away symmetrically. Active treatment delivers 2 mA for 20 minutes with 30-second ramp periods [110].
Treatment Course: Participants receive 12 consecutive daily sessions on working days [110].
This approach resulted in significantly greater decreases in HAMD scores in the active group (-7.8 ± 4.2) compared to sham (-5.6 ± 4.4), with a group difference of -2.2 and Cohen's d of -0.50 [110]. The therapy was well-tolerated with only mild to no adverse effects reported.
tACS Protocol for Cognitive Enhancement
Transcranial alternating current stimulation (tACS) has emerged as a promising tool for enhancing cognitive functions, particularly working memory. A recent study investigated both conventional tACS and novel amplitude-modulated tACS (AM-tACS) protocols [114]:
Stimulation Parameters: Conventional tACS applied 40 Hz, 1 mA peak-to-peak stimulation bilaterally to the prefrontal cortex. AM-tACS used a 200 Hz carrier frequency with individualized baseband modulation frequency determined by pre-task phase-locking value from occipitofrontal EEG [114].
Experimental Design: Thirty-three healthy university students were randomized to Sham, tACS, or AM-tACS groups in a single-blind, sham-controlled, parallel-group study. Working memory was assessed via a delayed-match-to-sample task measuring accuracy and sensitivity index d' [114].
Results: The tACS group showed significant working memory accuracy improvement compared to Sham (p < 0.05). AM-tACS exhibited a smaller but statistically significant enhancement in d' (p < 0.05) [114]. EEG analysis revealed a trend toward heightened frontal-occipital functional connectivity, suggesting potential mechanisms for the cognitive enhancement effects.
Transcranial Ultrasound Safety Protocol
Transcranial ultrasound stimulation (TUS) represents an emerging neuromodulation technology with high spatial resolution and the ability to reach deep brain structures. The International Transcranial Ultrasonic Stimulation Safety and Standards consortium (ITRUSST) has established consensus safety guidelines [113] [115]:
Mechanical Safety: Mechanical Index (MI) or Mechanical Index for transcranial application (MItc) should not exceed 1.9 to minimize risks of cavitation-related bioeffects [113].
Thermal Safety: One of three conditions must be met: (1) peak temperature rise does not exceed 2°C or peak absolute temperature does not exceed 39°C; (2) thermal dose does not exceed 2 CEM43 in brain tissue; or (3) specific Thermal Index values for given exposure times are maintained [113].
Safety Evidence: A retrospective analysis of 120 participants across seven human TUS studies found no serious adverse effects [112]. Only 7 of 64 respondents reported mild to moderate symptoms possibly or probably related to TUS, including neck pain, attention problems, muscle twitches, and anxiety. Most symptoms were transient and resolved upon follow-up [112].
The Scientist's Toolkit: Essential Research Reagents and Materials
Table 4: Essential Research Materials for Neuromodulation Studies
| Item/Category | Specific Examples & Models | Research Function |
|---|---|---|
| TMS Equipment | Figure-of-eight coils, MagPro systems | Delivery of magnetic pulses for cortical stimulation |
| tDCS/HD-tDCS Systems | Soterix Medical HD-tDCS (Model 5100D) [110] | Precise current delivery with multi-electrode configurations |
| tACS Devices | NeuroConn stimulators, custom research devices | Delivery of alternating current at specific frequencies |
| TUS Transducers | Single-element focused transducers (250-600 kHz) [112] | Precise ultrasonic neuromodulation of cortical and subcortical regions |
| Neuronavigation | Frameless stereotaxic systems with MRI integration [110] | Precise targeting of brain regions using individual anatomy |
| EEG Systems | NeuroScan SynAmps RT Amplifier, EEGLAB toolbox [114] | Monitoring neural oscillations and connectivity changes |
| Safety Monitoring | Participant Report of Symptoms questionnaires [112] | Standardized assessment of adverse effects and tolerability |
| Computational Modeling | SIMNIBS, ROAST, custom finite-element models | Electric field prediction and dose individualization |
The expanding landscape of non-invasive neuromodulation techniques offers researchers and clinicians a diverse toolkit for investigating brain function and developing novel therapeutic interventions. TMS protocols, including conventional rTMS and efficient iTBS, demonstrate robust efficacy for depression with established safety profiles. HD-tDCS provides targeted stimulation with moderate effect sizes and excellent tolerability. tACS shows promise for cognitive enhancement through frequency-specific entrainment of neural oscillations. TUS offers unprecedented spatial precision for deep brain targets with emerging safety guidelines. Each technique presents distinct advantages and limitations, suggesting complementary rather than competitive roles in the neuromodulation ecosystem. Future directions should focus on optimizing personalized dosing, elucidating mechanisms of action through multimodal imaging, and developing closed-loop systems that dynamically adjust stimulation parameters based on real-time neural feedback.
Conclusion
Non-invasive brain imaging has evolved from a purely research-oriented tool to an indispensable component of modern neuroscience and drug development. The integration of multimodal data, the advancement of personalized neuromodulation protocols based on individual brain connectivity, and the powerful synergy with artificial intelligence are paving the way for a new era of precision psychiatry and neurology. Future progress hinges on a cultural shift within biopharma to fully embrace a precision medicine approach, a commitment to standardizing methodologies, and a focus on ethical frameworks for responsible innovation. By addressing current challenges in data integration, dynamic imaging in naturalistic contexts, and the validation of causal mechanisms, these technologies hold the transformative potential to decode cognition, enable individualized therapies for neuropsychiatric disorders, and significantly accelerate the development of effective neurological treatments.
References
- 1. Brain Imaging: Choosing the Right Tool in 2025 [https://myneuropathway.com/blog/understanding-brain-imaging-and-diagnostic-testing-choosing-the-right-tool-for-the-job/]
- 2. Opportunities for use of neuroimaging in de-risking drug ... [https://www.nature.com/articles/s41386-024-01970-8]
- 3. Optimization of TMS target engagement: current state and ... [https://www.frontiersin.org/journals/neuroscience/articles/10.3389/fnins.2025.1517228/full]
- 4. The value of multimodal neuroimaging in the diagnosis and ... [https://pmc.ncbi.nlm.nih.gov/articles/PMC12181266/]
- 5. Neuroimaging toolkit [https://www.bnacredibility.org.uk/neuroimaging]
- 6. A Guide to Neuroimaging Neuroinformatics Resources - PMC [https://pmc.ncbi.nlm.nih.gov/articles/PMC4470758/]
- 7. A Practical Guide for Generating Reproducible and ... [https://apertureneuro.org/article/85104-a-practical-guide-for-generating-reproducible-and-programmatic-neuroimaging-visualizations]
- 8. Estimating Brain Activity with High Spatial and Temporal ... [https://arxiv.org/html/2510.09415v1]
- 9. Multimodal fNIRS–EEG sensor fusion: Review of data-driven ... [https://pmc.ncbi.nlm.nih.gov/articles/PMC12592382/]
- 10. Multimodal precision MRI of the individual human brain at ... [https://www.nature.com/articles/s41597-025-04863-7]
- 11. Mapping Blood Flow and Brain Development without Radiation [https://med.stanford.edu/cvi/mission/news_center/articles_announcements/2025/advanced-imaging-technologies-for-young-brains.html]
- 12. Sensitivity of quantitative diffusion MRI tractography and ... [https://pubmed.ncbi.nlm.nih.gov/41057117/]
- 13. Sensitivity of quantitative diffusion MRI tractography and ... [https://www.sciencedirect.com/science/article/abs/pii/S0730725X25002231]
- 14. Advances in brain imaging and stimulation methods for ... [https://pmc.ncbi.nlm.nih.gov/articles/PMC12079656/]
- 15. AI-powered integration of multimodal imaging in precision ... [https://www.sciencedirect.com/science/article/pii/S2666379125002058]
- 16. Accelerating Therapeutic Development for Brain Illnesses [https://irp.nih.gov/blog/post/2025/09/accelerating-therapeutic-development-for-brain-illnesses]
- 17. The history and future of resting state functional magnetic ... [https://pmc.ncbi.nlm.nih.gov/articles/PMC12628496/]
- 18. Spatio-temporal dynamic functional brain network for mild ... [https://www.frontiersin.org/journals/neuroscience/articles/10.3389/fnins.2025.1597777/full]
- 19. Potential locations for non-invasive brain stimulation in ... [https://www.nature.com/articles/s41398-025-03303-9]
- 20. Use of functional imaging across clinical phases in CNS drug ... [https://pmc.ncbi.nlm.nih.gov/articles/PMC3731782/]
- 21. Review Neuroimaging Biomarkers for Drug Discovery and ... [https://www.sciencedirect.com/science/article/pii/S0006322324000362]
- 22. Emerging non-invasive MRI techniques for glymphatic ... [https://www.sciencedirect.com/science/article/abs/pii/S015098612500080X]
- 23. Evaluation and interpretation of DTI-ALPS, a proposed ... [https://pmc.ncbi.nlm.nih.gov/articles/PMC12362905/]
- 24. Emerging non-invasive MRI techniques for glymphatic ... [https://pubmed.ncbi.nlm.nih.gov/39894249/]
- 25. Diffusion Tensor Imaging Along the Perivascular Space ... [https://pmc.ncbi.nlm.nih.gov/articles/PMC12651649/]
- 26. Enlarged perivascular spaces in the basal ganglia across ... [https://pubmed.ncbi.nlm.nih.gov/41159639]
- 27. Perivascular space fluid diffusivity predicts clinical ... [https://www.nature.com/articles/s41531-025-01036-6]
- 28. Changes in DTI-ALPS index and its associations with ... [https://www.sciencedirect.com/science/article/pii/S1353802025007552]
- 29. Glymphatic dysfunction as an imaging biomarker for ... [https://www.sciencedirect.com/science/article/pii/S2352047725000590]
- 30. DTI-ALPS mapping: A Novel Method for Analyzing ... [https://archive.ismrm.org/2025/4796.html]
- 31. The future of CNS drug development: signs of real progress [https://www.drugtargetreview.com/article/168079/the-future-of-cns-drug-development-signs-of-real-progress/]
- 32. Alzheimer's disease drug development pipeline: 2025 - PMC [https://pmc.ncbi.nlm.nih.gov/articles/PMC12131090/]
- 33. Statistical Learning Methods for Neuroimaging Data Analysis ... [https://pmc.ncbi.nlm.nih.gov/articles/PMC11962820/]
- 34. A brief review of non-invasive brain imaging technologies ... [https://pmc.ncbi.nlm.nih.gov/articles/PMC8227874/]
- 35. Neuroimaging in psychedelic drug development [https://www.nature.com/articles/s41380-023-02271-0]
- 36. Using non-invasive neuroimaging to enhance the care ... [https://www.sciencedirect.com/science/article/pii/S1053811920311526]
- 37. An overview of statistical methods for biomarkers relevant ... [https://pmc.ncbi.nlm.nih.gov/articles/PMC11371698/]
- 38. The “five-star matrix” for patient-centric drug discovery and ... [https://www.sciencedirect.com/science/article/abs/pii/S0896627325005896]
- 39. New Frontiers: Visualizing the Effects of Diseases on the Brain [https://med.emory.edu/departments/radiology/research/research-news/visualizing-brain-ligand-research.html]
- 40. Arvinas Presents Late Breaking, Positive Phase 1 Clinical ... [https://ir.arvinas.com/news-releases/news-release-details/arvinas-presents-late-breaking-positive-phase-1-clinical-data]
- 41. Biomarkers and therapeutic strategies targeting microglia in ... [https://molecularneurodegeneration.biomedcentral.com/articles/10.1186/s13024-025-00867-4]
- 42. Opportunities for use of neuroimaging in de-risking drug ... [https://pmc.ncbi.nlm.nih.gov/articles/PMC11526012/]
- 43. Functional magnetic resonance imaging [https://en.wikipedia.org/wiki/Functional_magnetic_resonance_imaging]
- 44. 2.4: Non-Invasive Techniques- Indirect Functional Imaging ... [https://socialsci.libretexts.org/Courses/Sacramento_City_College/Psyc_310%3A_Biological_Psychology_(Keys)/02%3A_Research_Methods_and_Ethical_Considerations_of_Biological_Psychology_and_Neuroscience/2.04%3A_Non-Invasive_Techniques-_Indirect_Functional_Imaging_Techniques]
- 45. Functional MRI (fMRI) of the brain [https://www.radiologyinfo.org/en/info/fmribrain]
- 46. Dose-response effects of exogenous oxytocin on social ... [https://www.sciencedirect.com/science/article/pii/S0149763425003513]
- 47. Visualizing Quantitative Data: Best Practices [https://ajelix.com/data/visualizing-quantitative-data-best-practices/]
- 48. Quantifying VMAT2 target occupancy at effective ... [https://www.nature.com/articles/s41386-024-02046-3]
- 49. Tracers in Development, Newly Installed PET Camera ... [https://www.michaeljfox.org/news/tracers-development-newly-installed-pet-camera-signal-advancement-parkinsons-imaging]
- 50. Advance and Prospect of Positron Emission Tomography ... [https://pubmed.ncbi.nlm.nih.gov/40544200/]
- 51. Development of Novel PET Tracers for Imaging Non-AD ... [https://pubmed.ncbi.nlm.nih.gov/41089482/]
- 52. Novel Non-Invasive PET Imaging of Reactive Oxygen ... [https://pubmed.ncbi.nlm.nih.gov/40816922/]
- 53. Quantitative PET imaging and modeling of molecular blood ... [https://www.nature.com/articles/s41467-025-58356-7]
- 54. EXPLORER shrinks the time it takes for imaging to spot ... [https://health.ucdavis.edu/news/headlines/explorer-shrinks-the-time-it-takes-for-imaging-to-spot-cancer/2025/05]
- 55. Functional diffusion map: A noninvasive MRI biomarker for ... [https://pmc.ncbi.nlm.nih.gov/articles/PMC555936/]
- 56. Neuroimaging Biomarkers: Current Initiatives and Opportunities [https://www.ncbi.nlm.nih.gov/books/NBK482003/]
- 57. Neuroimaging and CSF Biomarker Program [https://www.alzdiscovery.org/research-and-grants/funding-opportunities/biomarkers]
- 58. Stratifying vascular disease patients into homogeneous ... [https://www.nature.com/articles/s44303-024-00063-x]
- 59. Neuromodulation Interventions for Language Deficits in ... [https://pmc.ncbi.nlm.nih.gov/articles/PMC12293641/]
- 60. Data-guided neuroimaging and visualization [https://apertureneuro.org/article/140427-data-guided-neuroimaging-and-visualization-from-functional-decomposition-to-dynamic-fusion]
- 61. Quantitative MRI in Neuroimaging: A Review of Techniques ... [https://pmc.ncbi.nlm.nih.gov/articles/PMC12562573/]
- 62. Editorial: Methods in brain stimulation [https://www.frontiersin.org/journals/human-neuroscience/articles/10.3389/fnhum.2025.1619784/full]
- 63. Harnessing neural variability: Implications for brain ... [https://www.sciencedirect.com/science/article/pii/S0149763425003136]
- 64. Longer scans boost prediction and cut costs in brain-wide ... [https://www.nature.com/articles/s41586-025-09250-1]
- 65. Phase I Clinical Trials Explained: Objectives, Risks & Process [https://ccrps.org/clinical-research-blog/phase-i-clinical-trials-explained-objectives-risks-amp-process]
- 66. Risks of phase I research with healthy participants [https://pmc.ncbi.nlm.nih.gov/articles/PMC4783291/]
- 67. Power Determination During Drug Development [https://pmc.ncbi.nlm.nih.gov/articles/PMC6430154/]
- 68. Phase 1 Clinical Trial Designs Explained: BOIN, CRM ... [https://www.precisionformedicine.com/blog/phase-1-clinical-trial-designs-explained-boin-crm-blrm-modern-adaptive-strategies]
- 69. Informatics Program | BRAIN Initiative [https://braininitiative.nih.gov/research/data-science-and-informatics/informatics-program]
- 70. BIDS Standards - The Brain Imaging Data Structure [https://bids.neuroimaging.io/standards/index.html]
- 71. Brain Growth Charts for Quantitative Analysis of Pediatric ... [https://pmc.ncbi.nlm.nih.gov/articles/PMC10623207/]
- 72. Shedding light on the brain: guidelines to address ... [https://www.frontiersin.org/journals/neuroscience/articles/10.3389/fnins.2025.1557471/full]
- 73. A Quantitative Data-Driven Analysis Framework for Resting ... [https://pmc.ncbi.nlm.nih.gov/articles/PMC8565286/]
- 74. MQGA: A quantitative analysis of brain network hubs using ... [https://www.sciencedirect.com/science/article/pii/S1053811924004105]
- 75. Benchmarking methods for mapping functional connectivity ... [https://www.nature.com/articles/s41592-025-02704-4]
- 76. Invasive brain mapping identifies personalized therapeutic ... [https://www.nature.com/articles/s41398-025-03690-z]
- 77. Emerging techniques for precision neuromodulation [https://www.the-innovation.org/article/doi/10.59717/j.xinn-life.2025.100150]
- 78. Houston Methodist Researchers Pioneer Optogenetic ... [https://www.houstonmethodist.org/leading-medicine-blog/articles/2025/jul/houston-methodist-researchers-pioneer-optogenetic-modulation-protocol-to-map-brain-connectivity/]
- 79. BRAIN 2025: A Scientific Vision - BRAIN Initiative - NIH [http://braininitiative.nih.gov/vision/nih-brain-initiative-reports/brain-2025-scientific-vision]
- 80. A wearable platform for closed-loop stimulation and ... [https://www.nature.com/articles/s41593-023-01260-4]
- 81. Closed-Loop Neuromodulation Systems - PubMed Central - NIH [https://pmc.ncbi.nlm.nih.gov/articles/PMC5461950/]
- 82. Wearable fNIRS platform for dense sampling and precision ... [https://www.nature.com/articles/s41746-025-01690-3]
- 83. Remote Wearable Neuroimaging Devices for Health ... [https://pmc.ncbi.nlm.nih.gov/articles/PMC11048695/]
- 84. Comparing navigated transcranial magnetic stimulation ... [https://pmc.ncbi.nlm.nih.gov/articles/PMC8338816/]
- 85. Comparing navigated transcranial magnetic stimulation ... [https://link.springer.com/article/10.1007/s10143-020-01397-x]
- 86. Functional MRI and Direct Cortical Stimulation: Prediction ... [https://pmc.ncbi.nlm.nih.gov/articles/PMC6467056/]
- 87. Comparison of navigated transcranial magnetic stimulation ... [https://www.sciencedirect.com/science/article/abs/pii/S1935861X15007913]
- 88. Combined noninvasive language mapping by navigated transcranial ... [https://pubmed.ncbi.nlm.nih.gov/25748306/]
- 89. Precision TMS through the integration of neuroimaging and ... [https://www.frontiersin.org/journals/human-neuroscience/articles/10.3389/fnhum.2025.1682852/full]
- 90. TMS-induced modulation of brain networks and its ... [https://www.sciencedirect.com/science/article/pii/S1935861X25003596]
- 91. State-Dependent Transcranial Magnetic Stimulation ... [https://pmc.ncbi.nlm.nih.gov/articles/PMC12293497/]
- 92. The potential of interleaved TMS-fMRI for linking ... [https://www.sciencedirect.com/science/article/pii/S1935861X24013895]
- 93. How pushing the spatiotemporal resolution of fMRI can ... [https://www.sciencedirect.com/science/article/abs/pii/S0301008221001982]
- 94. 3T high spatial–temporal resolution fMRI [https://www.frontiersin.org/journals/neuroimaging/articles/10.3389/fnimg.2025.1537440/full]
- 95. Concurrent fNIRS and EEG for Brain Function Investigation [https://pmc.ncbi.nlm.nih.gov/articles/PMC9371171/]
- 96. New ultrasound helmet enables deep brain stimulation in ... [https://www.ox.ac.uk/news/2025-09-09-new-ultrasound-helmet-enables-deep-brain-stimulation-people-without-surgery]
- 97. 1+ to 4+ (from least to best spatial resolution/cell detection ... [https://www.ncbi.nlm.nih.gov/books/NBK27079/table/molecularimagingofstemcells.T1/]
- 98. Estimating Brain Activity with High Spatial and Temporal ... [https://arxiv.org/abs/2510.09415]
- 99. Color-coded visualization of magnetic resonance imaging ... [https://www.nature.com/articles/srep41107]
- 100. Multimodal Integration in Health Care - PubMed Central - NIH [https://pmc.ncbi.nlm.nih.gov/articles/PMC12370271/]
- 101. Researchers explore innovative new ways to treat the brain [https://news.stanford.edu/stories/2025/01/breaking-the-box-non-invasive-brain-stimulation-opens-new-ways-to-study-and-treat-the-brain]
- 102. New MRI method offers deeper insight into brain physiology [https://engineering.berkeley.edu/news/2025/05/new-mri-method-offers-deeper-insight-into-brain-physiology/]
- 103. Multimodal cell maps as a foundation for structural and ... [https://www.nature.com/articles/s41586-025-08878-3]
- 104. Urban Institute Data Visualization style guide - GitHub Pages [http://urbaninstitute.github.io/graphics-styleguide/]
- 105. Machine Learning of Neuroimaging Data [https://www.med.upenn.edu/machine-learning-biomed-data/machine/deep-learning-for-neuroimage-analysis.html]
- 106. How Machine Learning is Powering Neuroimaging to ... [https://pmc.ncbi.nlm.nih.gov/articles/PMC9515245/]
- 107. A hitchhiker′s guide to working with large, open-source ... [https://pmc.ncbi.nlm.nih.gov/articles/PMC7992920/]
- 108. Efficacy and safety of repetitive transcranial magnetic ... [https://pmc.ncbi.nlm.nih.gov/articles/PMC12459487/]
- 109. Efficacy and Safety of Neuromodulation Techniques in ... [https://pmc.ncbi.nlm.nih.gov/articles/PMC12633478/]
- 110. Personalized High-Definition Transcranial Direct Current ... [https://pmc.ncbi.nlm.nih.gov/articles/PMC12426800/]
- 111. Efficacy, effectiveness and safety of transcranial magnetic ... [https://www.sciencedirect.com/science/article/pii/S2667174325001727]
- 112. A retrospective qualitative report of symptoms and safety ... [https://www.nature.com/articles/s41598-020-62265-8]
- 113. ITRUSST consensus on biophysical safety for transcranial ... [https://www.sciencedirect.com/science/article/pii/S1935861X25003535]
- 114. The effects of amplitude modulated transcranial alternating ... [https://pmc.ncbi.nlm.nih.gov/articles/PMC12580318/]
- 115. ITRUSST consensus on biophysical safety for transcranial ... [https://pubmed.ncbi.nlm.nih.gov/41072763/]