AI-Powered Motion Tracking for Behavioral Analysis: Advanced Algorithms and Applications in Drug Development
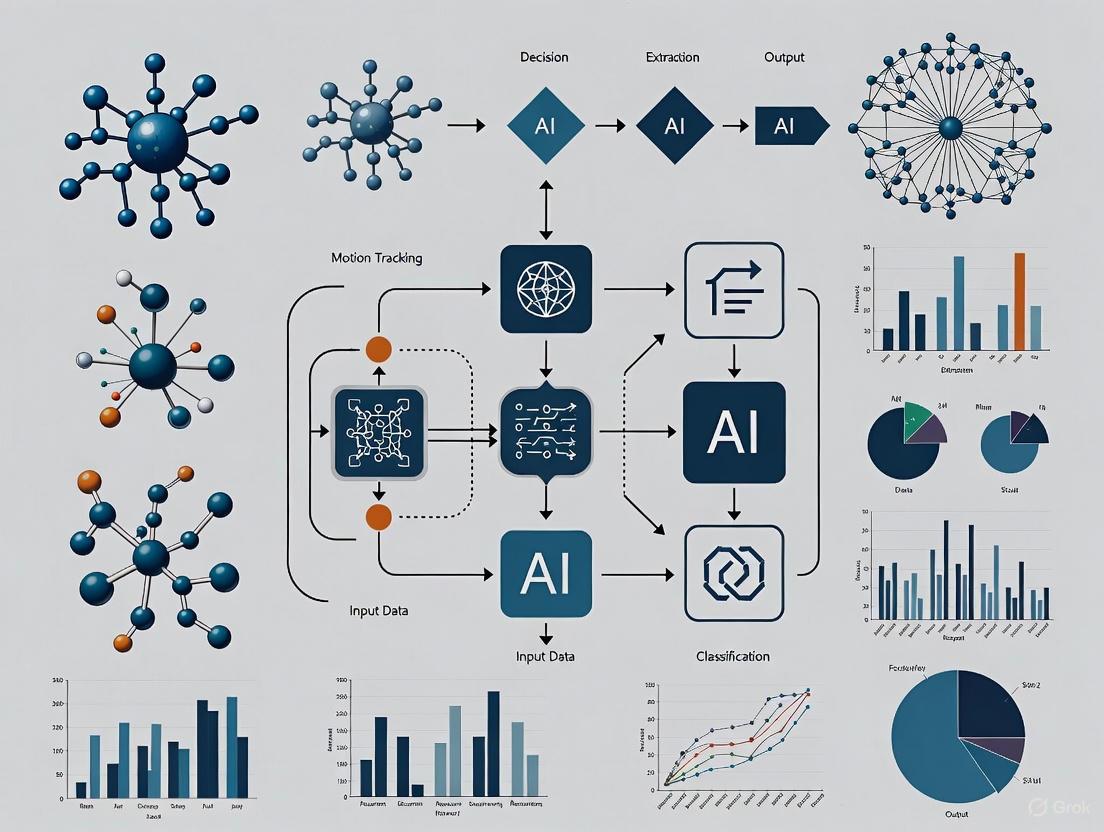
This article provides researchers, scientists, and drug development professionals with a comprehensive analysis of how artificial intelligence is revolutionizing behavioral analysis through motion tracking.
AI-Powered Motion Tracking for Behavioral Analysis: Advanced Algorithms and Applications in Drug Development
Abstract
This article provides researchers, scientists, and drug development professionals with a comprehensive analysis of how artificial intelligence is revolutionizing behavioral analysis through motion tracking. It explores the foundational principles of AI algorithms, details cutting-edge methodological applications in preclinical and clinical research, addresses critical troubleshooting and optimization challenges, and offers a rigorous validation framework for comparing algorithmic performance. By synthesizing the latest advancements, this guide serves as an essential resource for leveraging motion tracking to enhance the efficiency, predictive power, and success rates of pharmaceutical R&D.
From Manual Tracking to Deep Learning: Core Principles of AI-Driven Behavioral Analysis
Motion tracking technology has undergone a profound transformation, evolving from labor-intensive manual methods to sophisticated artificial intelligence (AI)-driven systems. This evolution has been particularly impactful in behavioral analysis research, where precise quantification of movement is crucial for studying behavioral phenotypes, assessing therapeutic efficacy, and understanding neurological function. The transition from manual tracking to markerless AI represents not merely a technical improvement but a fundamental shift in research capabilities, enabling the capture of complex, naturalistic behaviors in real-world environments with minimal intrusion [1]. For researchers and drug development professionals, this progress unlocks new possibilities for high-throughput, objective behavioral assessment, providing richer datasets and more sensitive biomarkers for preclinical and clinical studies.
This article details the key technological stages of this evolution, provides structured protocols for implementing modern tracking solutions, and furnishes a practical toolkit to guide research design in behavioral studies.
Historical Progression and Quantitative Comparison
The development of motion tracking can be segmented into four distinct technological phases, each characterized by significant shifts in accuracy, usability, and application scope [1].
Table 1: Evolutionary Stages of Motion Tracking Technology
| Era | Key Technologies | Primary Applications | Data Output | Key Limitations |
|---|---|---|---|---|
| Manual Tracking | Manual frame-by-frame annotation. | Early animation, fundamental biomechanics. | 2D coordinate points. | Extremely time-consuming; subjective; low temporal resolution. |
| Non-Visual & Marker-Based | Electromagnetic sensors; Inertial Measurement Units (IMUs); Passive/active optical markers. | Detailed biomechanics; Gait analysis; Film and video game animation. | 3D positional data; joint angles. | Invasive markers alter natural behavior; constrained to lab environments; high cost. |
| Markerless (Pre-DL) | Optical flow (Lucas-Kanade, Horn-Schunck); Feature-based tracking (SIFT, SURF); Background subtraction [1]. | Robotics; Early video surveillance; Basic activity recognition. | 2D motion vectors; feature trajectories. | Struggles with occlusions; requires high contrast; limited robustness in dynamic environments. |
| AI & Deep Learning (DL) | Convolutional Neural Networks (CNNs); OpenPose; YOLO; DeepSORT; RNNs/LSTMs [1] [2]. | Real-time behavioral phenotyping; AI-assisted diagnosis; Drug efficacy assessment in neurobiology. | 2D/3D pose estimation keypoints; semantic segmentation maps. | High computational demand; requires large, annotated datasets for training. |
The quantitative leap afforded by AI is demonstrated by the performance of modern multiple object tracking (MOT) algorithms. Tracking accuracy is commonly measured by metrics such as IDF1, which assesses identity preservation across frames.
Table 2: Quantitative Performance Comparison of Modern Multi-Object Tracking Algorithms (on MOT Challenge Benchmarks)
| Tracker | Paradigm | MOT16 IDF1 (%) | MOT17 IDF1 (%) | Key Innovation |
|---|---|---|---|---|
| FairMOT | Joint Detection and Embedding | 71.7 | 71.3 | Balances detection and Re-ID feature learning. |
| CenterTrack | Joint Detection and Tracking | 68.3 | 66.5 | Tracks by detecting object displacements. |
| MPMOT (2025) | Motion-Perception JDT | 72.8 | 72.6 | Gain Kalman Filter (GKF) and Adaptive Cost Matrix (ACM) [2]. |
The MPMOT framework exemplifies the modern focus on motion-aware tracking, which enhances robustness in challenging conditions like occlusions—a common scenario in behavioral studies of social groups [2].
Experimental Protocols for Behavioral Research
The following protocols provide a framework for implementing markerless AI motion tracking in behavioral and pharmacological research settings.
Protocol 1: Setup for Top-Down Multi-Animal Tracking
Application Note: This protocol is designed for high-throughput screening of group-housed animals, relevant for studying social behaviors, anxiety, and the effects of neuroactive compounds.
Methodology:
- Hardware Setup:
- Cameras: Position two or more synchronized high-speed cameras (≥100 fps) at different angles to resolve 3D pose and minimize occlusions.
- Housing: Use a standardized, well-lit arena. Ensure uniform, diffuse lighting to minimize shadows and glare.
- Data Acquisition: Record videos at a resolution of at least 1920x1080 pixels.
Software and Model Configuration:
- Detection Model: Employ a pre-trained object detector like YOLOv8 or Faster R-CNN, fine-tuned on a dataset of the target animal species.
- Tracking Algorithm: Implement a tracker such as DeepSORT or the MPMOT framework. For MPMOT, configure the Gain Kalman Filter (GKF) to adaptively adjust detection noise based on confidence scores, stabilizing predictions during brief occlusions [2].
- Identity Management: Rely on the tracker's appearance and motion models. The Adaptive Cost Matrix (ACM) in MPMOT is particularly useful, as it dynamically fuses motion and appearance cues to maintain identities in crowded scenes [2].
Data Output:
- A time-series dataset of bounding boxes and unique identity tags for each animal across all video frames.
Workflow Diagram:
Protocol 2: Markerless Pose Estimation for Kinematic Analysis
Application Note: This protocol is used for detailed kinematic analysis of specific body parts, applicable in studies of motor coordination, gait analysis, and neurodegenerative disease models.
Methodography:
- Data Acquisition:
- Follow the camera and lighting setup from Protocol 1.
Pose Estimation:
- Model Selection: Use a bottom-up pose estimation framework like OpenPose or a similar CNN-based architecture capable of detecting multiple keypoints (e.g., limbs, snout, tail base) for each animal [1].
- Processing: Run the model on the video data to generate 2D or 3D coordinates (x, y, z) for each defined keypoint in every frame.
Post-Processing and Analysis:
- Data Smoothing: Apply a low-pass filter (e.g., a Butterworth filter) to the raw keypoint coordinates to reduce high-frequency noise.
- Kinematic Feature Extraction: Calculate derived metrics from the smoothed trajectories. These can include:
- Velocity: The first derivative of the snout or body centroid position.
- Acceleration: The second derivative of position.
- Joint Angles: Calculated from three adjacent keypoints (e.g., hip-knee-ankle).
- Behavioral Classifiers: Use the keypoint data to train machine learning models (e.g., Random Forest, SVM) to classify specific behaviors like rearing, grooming, or freezing.
Workflow Diagram:
The Scientist's Toolkit: Research Reagent Solutions
This section outlines the essential "research reagents"—the computational tools and datasets—required for modern motion tracking research in behavioral science.
Table 3: Essential Research Reagents for AI-Powered Motion Tracking
| Tool/Resource | Type | Function in Research | Example/Reference |
|---|---|---|---|
| Pre-trained Models | Software | Provides a foundation for transfer learning, reducing data and computational needs. | OpenPose (2D pose); DeepLabCut (pose estimation); YOLO (object detection) [1]. |
| Public Benchmark Datasets | Data | Standardized datasets for training, validating, and benchmarking algorithm performance. | MOT Challenge (human tracking); Animal pose datasets from academic labs [2]. |
| Frameworks for Multi-Object Tracking (MOT) | Software/Algorithm | Manages data association and identity preservation over time for multiple subjects. | MPMOT framework (GKF, ACM, GCM) [2]; FairMOT; DeepSORT. |
| Visualization & Analysis Suites | Software | Enables visualization of trajectories and extraction of quantitative behavioral metrics. | Computational tools for deriving velocity, acceleration, and interaction metrics from keypoints. |
| Community Model Hubs | Platform | Allows researchers to share, fine-tune, and monetize specialized behavioral models. | Reelmind's Model Hub for motion models [3]. |
The evolution from manual to markerless AI-driven motion tracking has fundamentally expanded the toolbox for behavioral researchers and drug development scientists. The advent of robust, multi-animal tracking and precise pose estimation enables the quantification of subtle behavioral phenotypes and motor patterns with unprecedented scale and objectivity. As these technologies continue to advance—particularly through motion-aware models and community-driven platforms—they promise to deliver even more powerful, accessible, and standardized biomarkers. This will accelerate the discovery of novel therapeutics and deepen our understanding of the brain and behavior.
Spatiotemporal data, which contains both spatial and temporal information, is fundamental to motion tracking and behavioral analysis research. This data is ubiquitous in video sequences, where the motion of objects or animals must be tracked across space and over time. The analysis of such data presents unique challenges, including occlusions, appearance changes, and complex non-linear motion patterns. Artificial Intelligence (AI), particularly deep learning architectures, has revolutionized the processing of spatiotemporal data. This document provides detailed application notes and experimental protocols for four core AI architectures—Convolutional Neural Networks (CNNs), Recurrent Neural Networks (RNNs), Long Short-Term Memory networks (LSTMs), and Transformers—within the context of behavioral analysis and motion tracking for drug development research. It is intended to guide researchers and scientists in selecting, implementing, and validating appropriate models for their studies.
Core Architectures for Spatiotemporal Data
Convolutional Neural Networks (CNNs): CNNs are specialized for processing grid-like spatial data, such as images. They use convolutional layers to detect hierarchical patterns (e.g., edges, shapes) and pooling layers to achieve spatial invariance [4] [5]. In motion tracking, CNNs serve as powerful backbone networks for feature extraction from individual video frames [6] [7].
Recurrent Neural Networks (RNNs): RNNs are designed for sequential data. They process inputs step-by-step while maintaining a hidden state that acts as a memory of previous information [4] [8]. This makes them suitable for modeling temporal dependencies in data streams.
Long Short-Term Memory Networks (LSTMs): LSTMs are a specialized variant of RNNs that address the vanishing gradient problem. They incorporate a gating mechanism (input, forget, and output gates) to regulate the flow of information, enabling them to capture long-range dependencies in temporal data more effectively than vanilla RNNs [4] [5].
Transformers: Originally developed for natural language processing, Transformers have gained prominence in computer vision. They utilize a self-attention mechanism to weigh the importance of all elements in a sequence when processing each element. This allows for global context modeling and parallel processing of sequences, overcoming the limitations of sequential processing in RNNs and LSTMs [4] [6].
Quantitative Architecture Comparison
The following table summarizes the key characteristics, strengths, and limitations of each architecture in the context of spatiotemporal data.
Table 1: Comparative Analysis of Core AI Architectures for Spatiotemporal Data
| Architecture | Primary Data Strength | Key Mechanism | Advantages | Limitations |
|---|---|---|---|---|
| CNN [4] [5] | Spatial (Images, frames) | Convolutional Filters, Pooling | Excellent at extracting spatial features and hierarchies; Highly efficient for image-based tasks. | Lacks inherent temporal modeling capability. |
| RNN [4] [8] | Temporal (Sequences) | Recurrent Hidden State | Can model sequentiality and short-term temporal dependencies. | Prone to vanishing/exploding gradients; Struggles with long-term dependencies. |
| LSTM [4] [5] | Temporal (Long Sequences) | Gated Memory Cell | Solves vanishing gradient problem; Effective at capturing long-term dependencies. | Computationally intensive; Complex to train. |
| Transformer [4] [6] | Spatiotemporal | Self-Attention Mechanism | Models global context and long-range dependencies; Enables parallel processing for faster training. | High computational and memory requirements; Requires large datasets. |
Application in Motion Tracking & Behavioral Analysis
CNNs for Spatial Feature Extraction
In the "tracking-by-detection" paradigm, the CNN is the workhorse for the detection stage. A CNN-based object detector (e.g., YOLOv8) processes individual video frames to identify and localize targets of interest [7]. The performance of the entire tracking pipeline heavily depends on the richness and discriminative power of the features extracted by the CNN backbone. Enhancements like the Coordinate Attention (CA) mechanism can be integrated into CNNs to help the model focus on more informative spatial regions, improving detection accuracy under challenging conditions like occlusion [7].
RNNs/LSTMs for Temporal Dynamics and Trajectory Prediction
RNNs and LSTMs are used to model the temporal consistency of object trajectories. By processing the sequence of a target's past positions (e.g., centroid coordinates from the detector), these networks can predict its future location, smooth its trajectory, and aid in data association across frames [9]. This is crucial for maintaining target identity during occlusions or complex motion.
Transformers for Global Spatiotemporal Context
Transformers have recently been applied to overcome the limitations of local modeling in CNNs and sequential processing in RNNs/LSTMs. Their self-attention mechanism can aggregate global contextual and spatio-temporal information [6]. For example:
- Feature Integration: The TFITrack model uses a transformer encoder-decoder architecture to integrate spatio-temporal information and global context, deepening the similarity between template and search region features for more robust tracking [6].
- Global Association: The Preformer MOT model leverages transformers for global trajectory prediction, which is particularly effective for handling non-linear motion and long-range associations that challenge traditional Kalman filter-based methods [9].
Table 2: Model Performance on Standard Multi-Object Tracking (MOT) Benchmarks
| Tracking Model | Core Architectural Innovations | MOT17 MOTA (%) | MOT17 IDF1 (%) | Key Application in Behavioral Analysis |
|---|---|---|---|---|
| TFITrack [6] | Transformer Feature Integration Encoder-Decoder | >80.5 (SOTA) | 79.3 | Robust tracking of tiny targets in aerial photography; resistant to fast motion and external interference. |
| Improved YOLOv8 + ByteTrack [7] | CNN (with CA & EfficientViT) + Two-stage association | 80.5 | 79.3 | High-precision pedestrian tracking; reduces ID switches in engineering safety scenarios. |
Experimental Protocols
Protocol 1: Implementing a Transformer-CNN Hybrid Tracker
Objective: To implement and evaluate a hybrid tracking model (e.g., inspired by TFITrack [6]) that combines a CNN for spatial feature extraction and a Transformer for spatiotemporal context integration.
Workflow:
- Input Preparation: Extract template (initial target) and search region patches from video sequences.
- Spatial Feature Extraction: Use a CNN backbone (e.g., ResNet, enhanced YOLOv8) to extract deep feature maps from both template and search regions [7].
- Spatiotemporal Encoding: Flatten and project the feature maps into sequences of tokens. Pass them through a Transformer encoder with a similarity calculation layer to model global dependencies and enhance feature discriminability [6].
- Context-Aware Decoding: A Transformer decoder integrates information from the template and search region tokens, using cross-attention to focus on relevant features.
- Target Localization: The refined search region tokens are used to predict the target's bounding box in the current frame.
- Temporal Filtering: A temporal context filtering layer adaptively ignores unimportant features to balance performance and model complexity [6].
Protocol 2: Behavioral Feature Extraction for Pharmacological Studies
Objective: To quantify behavioral phenotypes (e.g., locomotion, social interaction, anxiety-like behaviors) from tracked trajectory data for assessing drug efficacy or toxicity.
Workflow:
- Multi-Object Tracking: Implement a tracker from Protocol 1 to obtain trajectories (X, Y coordinates, frame) for each subject (e.g., mouse, zebrafish) in the assay.
- Trajectory Preprocessing: Smooth trajectories and calculate derived kinematics: velocity, acceleration, and heading angle.
- Spatiotemporal Feature Engineering: Extract the following features from the trajectories over defined time windows:
- Locomotion: Total distance traveled, average velocity, movement bout duration.
- Zone Preference: Time spent in, and entries into, predefined zones (e.g., center vs. periphery in an open field test).
- Social Behavior: Inter-individual distance, duration of proximity, and approach/avoidance dynamics.
- Temporal Modeling: Use an LSTM network to model the sequential nature of the behavioral data, capturing patterns and dependencies that simple summary statistics might miss [10].
- Analysis and Validation: Compare extracted features between treatment and control groups using statistical tests. Validate the model's ability to detect known drug effects against established manual scoring methods.
The Scientist's Toolkit: Research Reagents & Materials
Table 3: Essential Computational Reagents for AI-based Motion Tracking
| Research Reagent / Tool | Function / Purpose | Exemplars / Notes |
|---|---|---|
| Object Detection Models | Identifies and localizes targets in individual video frames. | YOLOv8 [7], Faster R-CNN. Critical for the "detection" step in tracking-by-detection. |
| Backbone CNN Architectures | Extracts rich, hierarchical spatial features from raw pixels. | ResNet, EfficientViT [7], VGG. A powerful backbone is foundational to tracking accuracy. |
| Attention Mechanisms | Allows the model to dynamically focus on more informative spatial regions or features. | Coordinate Attention (CA) [7], Self-Attention in Transformers [6]. Improves robustness to occlusion. |
| Re-Identification (Re-ID) Models | Extracts appearance features to distinguish between different targets. | OSNet-CA [7]. Used for data association to maintain consistent identity across frames. |
| Public Benchmark Datasets | Standardized datasets for training and, most importantly, fair benchmarking of tracking algorithms. | MOT17, MOT20 [7], UAV123 [6]. Essential for validating model performance. |
| Deep Learning Frameworks | Provides the programming environment to build, train, and deploy deep learning models. | PyTorch, TensorFlow, JAX. |
Multi-Object Tracking (MOT) is a fundamental computer vision task with critical applications in behavioral analysis research, from quantifying social interactions in animal models to monitoring human movement patterns in clinical trials. The core challenge in MOT lies in accurately detecting objects in each video frame and maintaining their unique identities across time, despite complications such as occlusions, changing appearances, and detection errors [11]. The field has evolved into two dominant computational paradigms with distinct philosophical and methodological approaches: Tracking-by-Detection (TbD) and Detection-by-Tracking (DbT) [12].
For researchers investigating behavior—whether in zebrafish social interactions or human disease progression—the choice between these paradigms directly impacts the reliability, accuracy, and interpretability of the resulting quantitative data. This application note provides a structured comparison of these paradigms, detailed experimental protocols for implementation, and specific applications in behavioral research contexts to inform algorithm selection for scientific studies.
Core Conceptual Differences
The fundamental distinction between the two paradigms lies in their treatment of the detection and association processes:
- Tracking-by-Detection (TbD) employs a sequential, modular approach where objects are first detected in each frame independently, and these detections are then linked across frames to form continuous tracks [12]. This compartmentalized strategy separates object detection from temporal association.
- Detection-by-Tracking (DbT) utilizes an integrated, end-to-end approach that jointly learns both detection and tracking objectives [12]. This paradigm reuses features extracted from individual frames specifically to maximize tracking performance rather than merely detecting objects in isolated frames.
Technical Implementation Comparison
Table 1: Technical Comparison of Tracking Paradigms
| Characteristic | Tracking-by-Detection (TbD) | Detection-by-Tracking (DbT) |
|---|---|---|
| System Architecture | Modular; detection and association are separate steps [12] | Integrated; joint learning of detection and tracking [12] |
| Implementation Flexibility | High flexibility; easy to swap detectors or association algorithms [12] | Low flexibility; components cannot be easily swapped [12] |
| Learning Approach | Modules designed and potentially trained separately [12] | Learned cohesion with potential for improved performance [12] |
| Representative Algorithms | SORT, DeepSORT, ByteTrack, BoT-SORT [13] | SAMBA-MOTR, MOTR [12] |
| Typical Frame Rate | High (e.g., ByteTrack: 30 FPS) [12] | Moderate (e.g., SAMBA-MOTR: 16 FPS) [12] |
| Training Complexity | Lower; modules can be trained independently | Higher; requires end-to-end training on tracking datasets |
| Performance Strengths | Excellent with high-quality detectors, computational efficiency | Superior in complex motion patterns, occlusions [12] |
Performance Metrics for Behavioral Research
When applying these paradigms to behavioral analysis, researchers should select evaluation metrics aligned with their scientific objectives:
- HOTA (Higher Order Tracking Accuracy): Provides a balanced assessment of both detection and association performance using the formula:
HOTA = √(DetA × AssA), where DetA measures detection accuracy and AssA measures association accuracy [12]. This metric is particularly valuable as it evaluates performance across multiple Intersection over Union (IoU) thresholds. - IDF1 (Identification F1 Score): Quantifies identity preservation accuracy using the formula:
IDF1 = 2 × IDTP / (2 × IDTP + IDFP + IDFN), where IDTP represents correctly identified objects, IDFP false identifications, and IDFN missed identifications [12]. This metric is crucial for long-term behavioral studies where maintaining individual identity is essential. - MOTA (Multiple Object Tracking Accuracy): Incorporates false positives, false negatives, and identity switches into a single metric [11]. While intuitive, MOTA can be dominated by detection performance in crowded scenes [12].
- AssA (Association Accuracy): Specifically evaluates how accurately a tracker maintains object identities across frames, focusing on temporal consistency [12]. This is particularly important in behavioral research where trajectory analysis is critical.
Tracking-by-Detection: Methods and Protocols
Core Architecture and Workflow
The Tracking-by-Detection paradigm follows a sequential pipeline where the output of an object detection model serves as input to a data association algorithm. The fundamental workflow consists of object detection, motion prediction, and data association stages [13].
Key Algorithmic Implementations
SORT (Simple Online and Realtime Tracking)
SORT establishes the fundamental TbD framework with minimalistic design. It employs a Kalman filter for motion prediction to estimate the next position of each track, and the Hungarian algorithm for data association based on Intersection over Union (IoU) between predicted and detected bounding boxes [13]. The state vector in SORT is represented as [u, v, s, r, u˙, v˙, s˙] where u,v are center coordinates, s is scale, r is aspect ratio, and u˙,v˙,s˙ are their respective velocities [13].
DeepSORT
DeepSORT enhances SORT by incorporating appearance information through a deep association metric. This extension uses a CNN to extract appearance features from bounding boxes, enabling more robust tracking through occlusions [13]. Each track maintains a gallery of the last appearance descriptors, allowing cosine distance calculations between new detections and stored descriptors to improve association accuracy.
ByteTrack
ByteTrack introduces a novel approach to handling low-confidence detections by associating every detection box, not just high-confidence ones [12] [13]. The algorithm employs a two-stage association: first matching high-score detections to existing tracks, then matching low-score detections to remaining unmatched tracks. This simple but effective optimization significantly reduces identity switches and fragmentation in challenging tracking scenarios.
Experimental Protocol: Implementing ByteTrack for Behavioral Analysis
Purpose: To implement and evaluate the ByteTrack algorithm for multi-object tracking in behavioral research applications.
Materials and Equipment:
- Video recording system appropriate for experimental subjects (e.g., overhead cameras for animal studies)
- Computing hardware with GPU acceleration (minimum 8GB GPU memory)
- Python 3.8+ programming environment
- PyTorch and torchvision libraries
- ByteTrack implementation (official GitHub repository)
Procedure:
- Data Acquisition and Preparation:
- Record video footage of subjects under standardized conditions
- Convert videos to sequential frame images at consistent resolution
- Annotate a subset of frames for validation purposes
Detection Model Configuration:
- Initialize YOLOX object detector with pre-trained weights
- Fine-tune detection model on domain-specific data if necessary
- Set confidence thresholds: high threshold (0.6), low threshold (0.1)
Tracking Implementation:
- Implement Kalman filter with state vector
[x, y, w, h, x˙, y˙, w˙, h˙] - Configure two-stage association process:
- Stage 1: Associate high-confidence detections using IoU similarity
- Stage 2: Associate low-confidence detections with remaining tracks using IoU
- Set track management parameters: track activation (2 consecutive matches), track deletion (30 frames without match)
- Implement Kalman filter with state vector
Validation and Analysis:
- Calculate HOTA, MOTA, and IDF1 metrics on validation sequences
- Export trajectory data for behavioral analysis
- Visualize tracks for qualitative assessment
Troubleshooting:
- For excessive identity switches: Adjust IoU threshold and appearance feature weight
- For fragmented tracks: Modify track activation and deletion parameters
- For computational bottlenecks: Optimize detection model or reduce input resolution
Detection-by-Tracking: Methods and Protocols
Core Architecture and Workflow
Detection-by-Tracking represents a paradigm shift toward end-to-end learnable approaches that jointly model detection and tracking objectives. These methods typically employ sequence modeling techniques to directly output tracked objects across frames.
Key Algorithmic Implementations
SAMBA-MOTR
SAMBA-MOTR utilizes synchronized state space models (SSM) to track multiple objects with complex, interdependent motion patterns [12]. The approach synchronizes multiple SSMs to model coordinated movements commonly found in group behaviors, making it particularly suitable for social behavior analysis in animal studies or team sports analytics.
The method combines a transformer-based object detector with the Samba sequence processing model, leveraging the object detector's encoder to extract image features from individual frames. These features are concatenated with detection and track queries from previous frames to maintain object identities [12]. A key innovation is the MaskObs technique for handling uncertain observations during occlusions or challenging scenarios by masking uncertain queries while maintaining state updates through historical information.
Performance Characteristics
SAMBA-MOTR demonstrates significantly improved performance on complex motion datasets such as DanceTrack, achieving 3.8 HOTA and 5.2 AssA improvement over competing methods [12]. The approach effectively models interdependencies between objects, enabling prediction of motion patterns based on group behavior with linear-time complexity suitable for extended tracking scenarios.
Experimental Protocol: Implementing SAMBA-MOTR for Complex Behavioral Phenotyping
Purpose: To implement SAMBA-MOTR for analyzing complex group behaviors and social interactions in research models.
Materials and Equipment:
- Multi-camera recording system for comprehensive coverage
- High-performance computing cluster with multiple GPUs
- PyTorch with custom Mamba/SSM extensions
- Behavioral annotation software for validation
Procedure:
- Data Preparation:
- Acquire multi-view video sequences of group interactions
- Pre-process videos to consistent frame rate and resolution
- Prepare training/validation splits with temporal continuity
Model Configuration:
- Initialize transformer-based feature extraction backbone
- Configure state space models for trajectory modeling
- Set track query initialization and propagation parameters
- Implement MaskObs mechanism for occlusion handling
Training Protocol:
- Pre-training on large-scale tracking datasets (MOT17, DanceTrack)
- Domain adaptation on target behavioral data
- Joint optimization of detection and association losses
- Validate using HOTA and AssA metrics
Behavioral Analysis:
- Extract trajectory data with maintained identities
- Compute interaction metrics (proximity, orientation, velocity correlation)
- Analyze group movement patterns and social dynamics
Troubleshooting:
- For training instability: Adjust learning rate schedules and gradient clipping
- For overfitting: Implement stronger data augmentation (temporal jittering, viewpoint simulation)
- For memory constraints: Reduce sequence length or model dimensionality
Application in Behavioral Analysis Research
Case Study: Wearable Motion Tracking for Disease Progression
A landmark study demonstrated the power of advanced tracking methodologies in clinical research, using wearable full-body motion tracking to predict disease trajectory in Duchenne muscular dystrophy (DMD) [14]. Researchers employed 17 wearable sensors to capture whole-body movement behavior during activities of daily living, establishing "ethomic fingerprints" that distinguished DMD patients from controls with high accuracy.
This approach combined elements of both tracking paradigms: precise detection of body segments (TbD) with holistic movement pattern analysis (DbT). The resulting behavioral biomarkers outperformed traditional clinical assessments in predicting disease progression, demonstrating the transformative potential of sophisticated tracking methodologies in biomedical research [14].
Implementation in Animal Behavior Research
In zebrafish behavioral research, deep learning-based object detection and tracking algorithms have enabled quantitative analysis of social behavior [15]. These implementations typically leverage YOLOv8-based object detection with region-based tracking metrics to quantify social preferences in controlled laboratory conditions.
The integration of tools like Ultralytics, OpenCV, and Roboflow enables reproducible workflows for detecting, tracking, and analyzing movement patterns in model organisms. This facilitates the computation of metrics such as zone preference, interaction frequency, and movement dynamics that are crucial for behavioral phenotyping.
The Scientist's Toolkit: Essential Research Reagents
Table 2: Essential Tools and Algorithms for Behavioral Tracking Research
| Tool Category | Specific Solutions | Research Application | Key Features |
|---|---|---|---|
| Tracking Algorithms | ByteTrack [12] [13] | General-purpose object tracking | High efficiency (30 FPS), simple but effective |
| SAMBA-MOTR [12] | Complex group behavior analysis | Models interdependent motion patterns | |
| Detection Models | YOLOX [13] | Real-time object detection | High accuracy and speed balance |
| Transformer Detectors [12] | Complex scene understanding | Superior feature extraction capabilities | |
| Evaluation Metrics | HOTA [12] | Comprehensive performance assessment | Balances detection and association accuracy |
| IDF1 [12] | Identity preservation evaluation | Measures long-term tracking consistency | |
| Motion Sensors | Wearable Sensor Suits [14] | Clinical movement analysis | Full-body kinematic capture (60 Hz) |
| Software Frameworks | Ultralytics YOLO [15] | Rapid model development | User-friendly API, extensive documentation |
| OpenCV [15] | Computer vision operations | Comprehensive image/video processing | |
| Annotation Tools | Roboflow [15] | Dataset preparation | Streamlined labeling and augmentation |
The choice between Tracking-by-Detection and Detection-by-Tracking paradigms depends critically on research objectives, computational resources, and behavioral context.
Tracking-by-Detection is recommended when:
- Research requires flexible, modular algorithm design
- Computational efficiency is prioritized for real-time analysis
- High-quality detection models are available for the target domain
- Research objectives focus on standardized behavioral assays
Detection-by-Tracking is preferable when:
- Research involves complex, interdependent motion patterns
- Maximum tracking accuracy is required despite computational costs
- Long-term identity preservation is critical for longitudinal studies
- Behavioral analysis involves group dynamics and social interactions
For behavioral researchers implementing these technologies, we recommend beginning with well-established TbD methods like ByteTrack for initial experiments, then progressing to more sophisticated DbT approaches like SAMBA-MOTR for complex behavioral phenotyping. Validation against manual annotations and correlation with biological outcomes should remain paramount when applying these computational paradigms to scientific research.
In preclinical research, particularly for evaluating drug efficacy and safety, the quantitative analysis of animal behavior is paramount. Traditional methods of behavioral scoring are often subjective, time-consuming, and prone to human error and variability [16]. Computer vision technologies offer a transformative solution by enabling automated, high-precision, and unbiased motion tracking and behavioral analysis [16]. This document details application notes and experimental protocols for three foundational computer vision techniques—Optical Flow, Feature Extraction, and Background Subtraction—within the context of AI-driven behavioral analysis for drug development. These methods allow researchers to extract robust quantitative metrics from video data, facilitating more reliable and reproducible pharmacological studies [17] [16].
Core Techniques & Comparative Analysis
Optical Flow: This technique estimates the motion of objects between consecutive video frames by calculating the displacement vector for each pixel. It is particularly useful for analyzing subtle and complex movement patterns, such as rodent gait or tremor responses to pharmaceutical compounds [17]. It models the apparent motion in the image plane caused by the relative movement between the animal and the camera.
Feature Extraction: This process involves identifying and describing distinctive keypoints (e.g., corners, edges) or regions within a video frame [18]. Techniques like edge detection are used to identify object boundaries, which can be crucial for segmenting different parts of an animal's body. The extracted features serve as anchors for tracking posture and articulation over time [18].
Background Subtraction: This is a fundamental method for segmenting moving objects, such as a rodent in an open field, from a static background. It works by creating a model of the background and then identifying foreground pixels that significantly deviate from this model [17]. This provides a binary mask of the animal's location and shape, which is often the first step in many behavioral analysis pipelines.
Quantitative Performance Comparison
The selection of an appropriate algorithm depends on the specific requirements of the experiment, including the need for accuracy, processing speed, and robustness to environmental factors. The following table summarizes a performance comparison of these methods based on a recent benchmark study [17].
Table 1: Performance Comparison of Computer Vision Techniques for Moving Object Detection
| Method | Response Time (seconds) | Accuracy (%) | Selectivity (%) | Specificity (%) |
|---|---|---|---|---|
| Discrete Wavelet Transform (DWT) | 0.27 | 95.34 | 95.96 | 94.68 |
| Optical Flow | Information Missing | Information Missing | Information Missing | Information Missing |
| Background Subtraction | Information Missing | Information Missing | Information Missing | Information Missing |
Note: The study [17] identified DWT as the optimal method among those tested. Specific quantitative data for Optical Flow and Background Subtraction in this particular benchmark were not fully detailed in the available search results. Further empirical validation is recommended for a direct comparison in a specific experimental setup.
Experimental Protocols
Protocol: Background Subtraction for Open Field Locomotion Analysis
This protocol is designed to quantify general locomotor activity and zone occupancy in rodent models, commonly used to assess drug-induced sedation or stimulation.
1. Equipment and Software Setup
- Camera: Fixed-mount CCD or CMOS camera with resolution ≥ 1080p.
- Enclosure: Standard open field arena (e.g., 40cm x 40cm x 40cm) with consistent, non-reflective interior.
- Lighting: Diffuse, constant illumination to minimize shadows and flicker.
- Computer: System with adequate processing power for real-time video analysis.
- Software: Python (with OpenCV library) or MATLAB.
2. Video Acquisition
- Acclimate the animal to the testing room for at least 60 minutes prior to recording.
- Place the rodent in the center of the open field arena.
- Record a video of the experimental session (e.g., 10-30 minutes). Ensure the camera is static and its settings (focus, white balance) are fixed throughout all experiments.
- Critical Step: Record an initial segment (e.g., 1-2 minutes) of the empty arena under identical lighting conditions to serve as the background model.
3. Algorithm Implementation (Using OpenCV/Python)
- Preprocessing: Convert video frames to grayscale to reduce computational load.
- Background Model Initialization: Use the
createBackgroundSubtractorMOG2()function, which is robust to gradual lighting changes and shadows. - Foreground Mask Generation: For each frame of the experimental video, apply the background subtractor to obtain a binary mask where the white pixels represent the foreground (the animal).
- Noise Reduction: Apply morphological operations (e.g.,
cv2.morphologyExwith an elliptical kernel) to remove small noise points and fill gaps in the foreground mask. - Object Tracking: Calculate the centroid of the largest contour found in the foreground mask (
cv2.findContours). Track the (x, y) coordinates of this centroid across all frames.
4. Data Extraction and Analysis
- Total Distance Travelled: Calculate the cumulative pixel distance moved by the centroid between frames. Convert pixels to centimeters using a known reference object in the arena.
- Velocity: Compute the instantaneous speed (distance per frame) and average speed over the session.
- Zone Occupancy: Define virtual zones (e.g., center, corners) in the arena. Calculate the percentage of time the centroid spends in each zone, a common metric for anxiety-like behavior.
Protocol: Optical Flow for Detailed Kinematic/Gait Analysis
This protocol is used for fine-grained analysis of movement dynamics, such as quantifying gait irregularities, tremor frequency, or specific drug-induced behavioral signatures [16].
1. Equipment and Software Setup
- Camera: High-speed camera (≥ 100 fps) to capture rapid movements.
- Setup: A clear, flat walking surface (e.g., a narrow runway or open field).
- Lighting: High-contrast, shadow-free lighting. For high accuracy, place markers on key anatomical points (e.g., joints) if manual feature detection is unreliable.
- Software: Python with OpenCV and SciPy, or specialized commercial tracking software.
2. Video Acquisition
- Record the animal from a lateral or top-down view, ensuring the entire body remains in the frame.
- For gait analysis, ensure the animal traverses a defined path. For generalized movement analysis (e.g., tremor), record in an open field.
- Maintain a fixed camera position and consistent, high-contrast lighting.
3. Algorithm Implementation (Dense Optical Flow using Farneback method in OpenCV)
- Preprocessing: Convert consecutive frames to grayscale.
- Flow Calculation: Use
cv2.calcOpticalFlowFarneback()to compute a dense flow field. This function returns a vector for each pixel representing its movement from the previous frame. - Vector Processing: The output is a two-channel array (flow in x and y directions). Calculate the magnitude and angle of each vector.
magnitude, angle = cv2.cartToPolar(flow_x, flow_y) - Thresholding: Apply a magnitude threshold to filter out noise and focus on significant movement.
4. Data Extraction and Analysis
- Overall Activity: Sum the magnitudes of all vectors above threshold to get a global "movement energy" metric for each frame.
- Tremor/Periodic Motion: Perform a Fourier Transform (FFT) on the movement energy time-series to identify dominant frequencies associated with tremors.
- Limb Movement Kinematics: By defining a Region of Interest (ROI) around a specific limb, the average flow vectors within that ROI can be used to calculate limb velocity and movement patterns.
The Scientist's Toolkit: Research Reagent Solutions
Table 2: Essential Computational Tools for Vision-Based Behavioral Analysis
| Tool / Solution | Function / Application | Example Uses in Behavioral Research |
|---|---|---|
| Convolutional Neural Networks (CNNs) [18] | Deep learning models for image analysis and classification. | Automated scoring of complex behaviors (e.g., rearing, grooming, social interaction) from raw video pixels [16]. |
| You Only Look Once (YOLO) [18] | Real-time object detection algorithm. | Fast and accurate multi-animal tracking and identification in a home cage or social interaction test. |
| OpenCV | Open-source library for computer vision and machine learning. | Provides the foundational functions for implementing all protocols described in this document (background subtraction, optical flow, feature extraction). |
| DeepEthogram [16] | Machine learning pipeline for supervised behavior classification. | Training a model to classify behavioral states (e.g., sleeping, eating, walking) based on user-labeled video data. |
| Discrete Wavelet Transform (DWT) [17] | Mathematical tool for multi-resolution analysis of signals and images. | Effective for moving object detection and analysis, showing high accuracy and fast response times in cluttered environments [17]. |
Implementing AI Algorithms: From Preclinical Models to Clinical Trial Analytics
Motion tracking algorithms have become indispensable tools in behavioral analysis research, enabling researchers to quantitatively analyze complex biological phenomena. Within the framework of artificial intelligence (AI)-driven research, selecting the appropriate tracking algorithm is crucial for generating reliable, reproducible data. This document provides detailed application notes and experimental protocols for three advanced tracking algorithms—SambaMOTR, ByteTrack, and DeepSORT—each representing distinct architectural paradigms for solving the multi-object tracking (MOT) problem. These algorithms differ fundamentally in their approach to data association, motion modeling, and handling of complex scenarios such as occlusions and erratic motion patterns commonly encountered in behavioral studies. The performance characteristics, implementation requirements, and optimal application domains for each algorithm are systematically evaluated to guide researchers in selecting the most appropriate tool for specific experimental conditions in pharmaceutical development and basic research.
Algorithm Comparative Analysis
Core Architectural Paradigms
Tracking-by-Detection (ByteTrack, DeepSORT): These methods separate the detection and association steps, using independent models for object detection in each frame followed by association across frames. This modular approach allows component swapping but may lack integrated optimization [12]. ByteTrack exemplifies this with its simple yet effective association strategy, while DeepSORT incorporates appearance features for improved identity preservation [19] [20].
Tracking-by-Propagation (SambaMOTR): This end-to-end approach jointly models detection and tracking through sequence propagation, reusing features across frames to maximize tracking performance. While potentially offering superior performance, these integrated architectures are less flexible and more complex to train [12] [21].
Quantitative Performance Comparison
Table 1: Performance Metrics Across Benchmark Datasets
| Algorithm | MOT17 (MOTA↑) | DanceTrack (HOTA↑) | MOT17 (IDF1↑) | Inference Speed (FPS) | Primary Strength |
|---|---|---|---|---|---|
| SambaMOTR | - | 69.2 [12] | - | 16 [12] | Complex motion patterns |
| ByteTrack | 80.3 [22] | 61.3 [12] | 77.3 [22] | 30-120 [12] [22] | High-speed tracking |
| DeepSORT | ~50.7* [20] | - | - | ~20* [20] | Occlusion handling |
Note: DeepSORT performance varies significantly with detector choice; values shown are from improved YOLOv5s-DeepSORT implementation [20].
Table 2: Scenario-Based Algorithm Selection Guide
| Experimental Condition | Recommended Algorithm | Rationale |
|---|---|---|
| High-throughput screening | ByteTrack | Superior speed with maintained accuracy [22] |
| Complex social interactions | SambaMOTR | Superior group behavior modeling [12] [21] |
| Occlusion-prone environments | DeepSORT | Robust re-identification capabilities [20] |
| Small object tracking | ByteTrack with MR2 adaptation | Multi-resolution rescoring for small objects [22] |
| Long-term identity preservation | DeepSORT | Appearance feature integration reduces ID switches [20] |
| Nonlinear motion patterns | SambaMOTR | State space models capture complex trajectories [21] |
| Resource-constrained environments | ByteTrack | Efficient cascaded association strategy [22] |
Technical Specifications and Implementation Requirements
Table 3: Computational Requirements and Implementation Dependencies
| Algorithm | Base Detector | Feature Extractor | Motion Model | Association Method | Primary Dependencies |
|---|---|---|---|---|---|
| SambaMOTR | DAB-D-DETR [21] | Integrated encoder | State space models | Set-of-sequences modeling | PyTorch, Deformable Attention CUDA ops [21] |
| ByteTrack | YOLOX/YOLOv8 [22] [23] | Not applicable | Kalman filter (linear) | Two-stage Hungarian + IoU | Python, lap library [23] |
| DeepSORT | YOLOv5/v7/v8 [20] [24] | ShuffleNetV2/CNN | Kalman filter (linear/UKF) | Cascade matching + appearance | PyTorch, TensorFlow |
Experimental Protocols
General Workflow for Behavioral Tracking Experiments
Experimental Workflow for Behavioral Tracking
Protocol 1: SambaMOTR Implementation for Complex Group Behaviors
Purpose: To track multiple interacting subjects with complex, interdependent motion patterns (e.g., social interaction assays, maternal behavior studies).
Materials:
- High-resolution camera system (≥30 FPS)
- GPU workstation (NVIDIA GPU with ≥8GB VRAM recommended)
- SambaMOTR codebase [21]
- Behavioral recording environment
Procedure:
- Data Preparation:
- Acquire video recordings at 30 FPS minimum
- Format datasets according to DanceTrack folder structure
- Generate sequence map files using provided scripts [21]
Model Configuration:
- Initialize with pre-trained DAB-D-DETR weights
- Configure Samba state space models with synchronized parameters
- Set MaskObs parameters for occlusion handling: uncertainty threshold = 0.5
Training Protocol (if fine-tuning):
- Use distributed training on 8 GPUs:
python -m torch.distributed.run --nproc_per_node=8 main.py - Apply gradient checkpointing with
--use-checkpointflag for memory optimization - Set batch size = 1 with longer training schedule as per configuration files [21]
- Use distributed training on 8 GPUs:
Inference Execution:
- Run evaluation on validation set:
python main.py --mode eval --eval-data-split val - For test set submission:
python -m torch.distributed.run --nproc_per_node=8 main.py --mode submit --submit-data-split test
- Run evaluation on validation set:
Validation:
- Assess HOTA metrics on validation sequences
- Manually verify complex interaction tracking accuracy
- Calculate identity preservation rate in occlusion scenarios
Protocol 2: ByteTrack Implementation for High-Throughput Screening
Purpose: To achieve real-time tracking of multiple subjects in high-throughput applications (e.g., locomotor activity, multi-well plate assessments).
Materials:
- High-speed camera system (≥60 FPS capable)
- GPU-enabled processing system
- ByteTrack implementation [22]
- YOLOX or YOLOv8 detector
Procedure:
- Detection Configuration:
- Select appropriate detector (YOLOX for accuracy, YOLOv8 for speed)
- Configure detection threshold: τ = 0.5 (initial value)
- Calibrate detection resolution based on object size
Association Parameterization:
- Initialize Kalman filter with linear motion model
- Set two-stage matching thresholds:
- First stage (high confidence): detection scores ≥ τ
- Second stage (low confidence): detection scores < τ [22]
- Configure IoU similarity metric for motion prediction
Optimization:
- Implement adaptive thresholding if detection quality varies
- For resource-constrained environments, apply MR2-ByteTrack multi-resolution rescoring [22]
- Validate tracking continuity using MOTA and IDF1 metrics
Execution:
- Process video sequences with
bytetrack.pyimplementation - For real-time applications, use
-m yolox_sfor lighter model [23] - Monitor identity switches particularly during occlusion events
- Process video sequences with
Protocol 3: DeepSORT Implementation for Occlusion-Prone Environments
Purpose: To maintain consistent identity tracking through partial and complete occlusions (e.g., burrowing behaviors, complex maze navigation).
Materials:
- Standard definition camera (≥720p)
- GPU or CPU-only system (CPU implementation possible with reduced performance)
- DeepSORT implementation with improved YOLOv5s [20]
- Appearance feature dataset (if available)
Procedure:
- Detector Enhancement:
- Implement improved YOLOv5s with:
- Focal-EIoU loss function replacement for CIoU
- Additional 160×160 pixel small object detection layer
- Multi-Head Self-Attention mechanism in backbone [20]
- Train on domain-specific data if available
- Implement improved YOLOv5s with:
Feature Extractor Optimization:
- Replace standard feature extractor with ShuffleNetV2 for efficiency
- Retrain appearance feature extraction model on target domain
- Balance re-identification frequency with computational load
Motion Model Refinement:
- Implement Unscented Kalman Filter (UKF) for nonlinear motion prediction [24]
- Incorporate adaptive factor for observation noise adjustment
- Configure covariance matrices for domain-specific motion patterns
Validation:
- Quantify identity switches per minute of video
- Measure tracking accuracy during occlusion events
- Compute MOTA and MOTP metrics against manual annotations [20]
The Scientist's Toolkit
Research Reagent Solutions
Table 4: Essential Software and Hardware Components for Tracking Experiments
| Component | Specification | Function | Example Implementation |
|---|---|---|---|
| Base Detector | YOLOX, YOLOv5/v8, DAB-D-DETR | Object identification in individual frames | YOLOX-L for ByteTrack [22] |
| Feature Extractor | ShuffleNetV2, CNN networks | Appearance feature representation for re-identification | ShuffleNetV2 in DeepSORT [20] |
| Motion Predictor | Kalman Filter, State Space Models | Future position estimation based on motion history | State space models in SambaMOTR [21] |
| Association Module | Hungarian algorithm, Sequence modeling | Data association across frames | Two-stage matching in ByteTrack [22] |
| Evaluation Framework | PyTorch, TensorFlow | Model training and validation | PyTorch for SambaMOTR [21] |
Algorithm Selection Framework
Algorithm Selection Decision Tree
The selection of an appropriate tracking algorithm represents a critical methodological decision in behavioral analysis research, directly impacting data quality and experimental conclusions. SambaMOTR, ByteTrack, and DeepSORT offer complementary strengths for different experimental scenarios: SambaMOTR excels in modeling complex, interdependent motions found in social behaviors; ByteTrack provides unparalleled efficiency for high-throughput applications; while DeepSORT offers robust performance in occlusion-prone environments. Researchers should carefully consider their specific experimental conditions—including subject density, motion complexity, occlusion frequency, and computational resources—when selecting and implementing these algorithms. The protocols provided herein establish standardized methodologies for implementing these advanced tracking systems, promoting reproducibility and rigorous comparison across behavioral studies in pharmaceutical development and basic research.
The objective quantification of behavior is a cornerstone of modern neuroscience, pharmacology, and genetics research. Behavioral phenotypes—the observable and measurable manifestations of an organism's underlying genetic, neural, and pharmacological state—provide critical endpoints for diagnosing disease, evaluating therapeutic efficacy, and understanding fundamental biological processes. Historically, behavioral analysis relied on subjective clinical scores or low-throughput manual observation, limiting its scalability and objectivity. The convergence of motion tracking technologies and sophisticated artificial intelligence (AI) algorithms has ushered in a new era of computational phenotyping. This paradigm shift enables the precise, high-dimensional, and high-throughput quantification of behavior in both human and animal models, transforming it into a robust and data-rich scientific discipline. This article presents a series of detailed application notes and protocols focused on three core behavioral domains: gait analysis, activity bursts, and social interactions, framed within the context of a broader thesis on AI-driven behavioral analysis.
Application Note 1: Automated Human Gait Analysis Using 2D Video and Pose Estimation
Gait is a complex motor behavior that is a sensitive biomarker for a wide range of neurological and musculoskeletal conditions, from Parkinson's disease and stroke to osteoarthritis. Traditional 3D motion capture (e.g., Vicon systems), while considered a gold standard, is expensive, requires a laboratory setting, and often involves placing markers on the subject, which is cumbersome and can alter natural movement [25] [26].
Protocol: 2D Video-Based Gait Analysis with OpenPose
- Objective: To provide a validated, accessible, and markerless method for quantifying spatiotemporal and kinematic gait parameters from simple 2D video recordings.
- Experimental Setup:
- Participants: Recruit participants based on study criteria. For validation studies, a sample size of at least 20 participants is recommended [25].
- Equipment: A standard digital video camera (e.g., a smartphone camera) with a known frame rate (≥25 Hz is suitable). For sagittal plane analysis, a tripod is essential.
- Environment: A well-lit, flat walking area (e.g., a hallway). A known distance (e.g., 6.30 m) must be marked on the floor for spatial calibration [26].
- Procedure:
- Position the camera laterally (sagittal plane) to the walking path, ensuring the entire gait cycle is within the field of view.
- Record participants walking at a self-selected comfortable pace over the marked distance. Multiple trials (e.g., at least 10) are recommended.
- For validation against 3D motion capture, systems like Vicon with reflective markers are used simultaneously [25] [26].
- Data Processing Workflow:
- Pose Estimation: Process video frames using an open-source pose estimation algorithm such as OpenPose [25] [26]. This software automatically detects and tracks key body landmarks (keypoints) like ankles, knees, hips, and heels.
- Data Extraction: Export the 2D coordinates of the keypoints across all video frames.
- Gait Event Detection: Use algorithms to identify heel-strike (initial contact) and toe-off (foot lift) events from the keypoint trajectories.
- Parameter Calculation: Calculate spatiotemporal and kinematic parameters for each gait cycle (see Table 1).
Quantitative Validation Data
The following table summarizes the performance of the OpenPose-based 2D video analysis method compared to the gold-standard 3D motion capture system [25] [26].
Table 1: Comparison of Gait Parameters from 3D Motion Capture (MC) and 2D OpenPose Analysis
| Gait Parameter Category | Specific Parameter | Mean Absolute Error (OpenPose vs. MC) | Inter-Method Correlation (ICC or other) | Notes |
|---|---|---|---|---|
| Temporal Parameters | Step Time | 0.02 s | High (ICC > 0.769) [25] | Accuracy improves when using mean participant values [26]. |
| Stance Time | 0.02 s | High [25] | - | |
| Swing Time | 0.02 s | High [25] | - | |
| Spatial Parameters | Step Length | 0.049 m (stride-by-stride); 0.018 m (participant mean) | High [25] | Sensitive to camera angle and participant position [26]. |
| Gait Speed | < 0.10 m/s difference | High [25] | - | |
| Joint Kinematics (Sagittal Plane) | Hip Angle | 4.0° | Moderate to Excellent [25] | - |
| Knee Angle | 5.6° | Lower than temporal parameters [25] | - | |
| Ankle Angle | 7.4° | Lower, especially for hip angles [25] | - |
Workflow Diagram
Application Note 2: Quantifying Social Interaction Patterns with Sociometers
Understanding social behavior is critical in neuroscience, psychology, and drug development for conditions like autism and social anxiety. Self-reported or observer-coded data can be subjective and difficult to scale. Electronic sensors known as "sociometers" provide an objective, high-resolution method for quantifying social dynamics in naturalistic settings [27].
Protocol: Quantifying Group Social Interactions Using Wearable Sociometers
- Objective: To objectively measure patterns of social proximity and speech (talkativeness) in a group of co-located individuals.
- Experimental Setup:
- Participants: A group of intermediate size (e.g., 50-80 participants) that allows for the formation of multiple small groups [27].
- Equipment: Sociometers—wearable badges containing a radio transmitter to gauge physical proximity (~3m range) and a microphone to detect speech. The devices do not store raw audio but compute audio features to infer speaking time.
- Context: Studies can be designed in collaborative (e.g., a group project) or non-collaborative (e.g., a lunch break) settings to investigate context-dependent behavior [27].
- Procedure:
- Provide each participant with a pre-configured sociometer to wear throughout the observation period (e.g., 12 hours).
- Participants engage in their normal activities within the defined context.
- Data is continuously collected on proximity and speech.
- Data Analysis:
- Data Segmentation: Divide the data into time windows (e.g., 5-minute segments).
- Network Construction: For each time window, construct a proximity network where individuals are linked if they were proximate for the entire window.
- Tie Strength: Calculate the duration of interactions to distinguish between brief encounters and sustained social interaction.
- Statistical Analysis: Analyze data for patterns such as gender homophily (preference for same-gender interaction) and context-dependent talkativeness. In one study, women were significantly more talkative and more likely to be proximate to other women in a collaborative context, but not in a non-collaborative setting [27].
Research Reagent Solutions: Behavioral Quantification Tools
Table 2: Key Tools and Technologies for Behavioral Phenotyping
| Tool / Reagent | Type | Primary Function | Key Features |
|---|---|---|---|
| OpenPose [25] [26] | Software Algorithm | 2D Human Pose Estimation | Markerless, open-source, processes standard video, outputs body keypoints. |
| Gaitmap [28] | Software Ecosystem | IMU-based Gait Analysis | Open-source Python toolbox for algorithm benchmarking and pipeline building using wearable sensor data. |
| Sociometer [27] | Hardware Sensor | Proximity & Speech Detection | Wearable, objective, preserves privacy by not storing raw audio, suitable for group studies. |
| PhenoScore [29] | AI Framework | Phenotypic Similarity Analysis | Combines facial recognition (from 2D photos) with Human Phenotype Ontology (HPO) data to quantify similarity for rare disease diagnosis. |
| MIAS [30] | Software Application | Synchronized Multi-Camera Video Acquisition | Unified control for multiple cameras from different vendors, records timestamps for frame synchronization. |
Workflow Diagram
Application Note 3: Integrated AI-Driven Phenotyping for Rare Disease
A significant challenge in genetics and drug development, particularly for rare neurodevelopmental disorders, is interpreting the clinical significance of genetic variants and recognizing distinct phenotypic subgroups. PhenoScore is an open-source, AI-based framework that addresses this by integrating two distinct data modalities: facial features from 2D photographs and deep phenotypic data from the Human Phenotype Ontology (HPO) [29].
Protocol: Phenotypic Similarity Analysis with PhenoScore
- Objective: To quantify the phenotypic similarity of an individual to a defined genetic syndrome cohort, aiding in the interpretation of Variants of Unknown Significance (VUS) and the identification of phenotypic subgroups.
- Experimental Setup:
- Cohorts: A cohort of individuals with a confirmed molecular diagnosis of a specific syndrome (e.g., Koolen-de Vries syndrome) and a control cohort of individuals with other neurodevelopmental disorders, matched for age, sex, and ethnicity [29].
- Data Inputs:
- Facial Data: A single 2D frontal facial photograph.
- Phenotypic Data: A list of HPO terms describing the individual's clinical features.
- Data Processing Workflow:
- Feature Extraction: Facial features are automatically extracted from the photograph. Phenotypic HPO similarity is calculated, excluding facial terms to avoid redundancy.
- Model Training: A support vector machine (SVM) classifier is trained on the combined facial and HPO features from the syndrome and control cohorts.
- Similarity Scoring: The trained model generates a Brier score and p-value for a new individual, defining their clinical similarity to the syndrome.
- Explainable AI: The framework uses LIME (Local Interpretable Model-agnostic Explanations) to generate facial heatmaps and lists the most important clinical (non-facial) HPO terms driving the classification [29].
Key Validation Result: In a proof-of-concept study on Koolen-de Vries syndrome, PhenoScore (Brier score: 0.09, AUC: 0.94) outperformed models using only facial data (Brier: 0.13) or only HPO data (Brier: 0.10), demonstrating the power of integrated multimodal analysis [29].
Workflow Diagram
The protocols and application notes detailed herein demonstrate a powerful paradigm shift in behavioral research. The integration of motion tracking—from 2D video and wearable sensors—with sophisticated AI algorithms enables the transformation of complex, qualitative behaviors into robust, quantitative phenotypes. These methodologies are not only validating and refining existing clinical measures but are also uncovering novel, context-dependent patterns in human behavior, from gait kinematics to social dynamics. For researchers and drug development professionals, these tools provide a scalable, objective, and multidimensional framework for biomarker discovery, target validation, and therapeutic evaluation. As these technologies continue to evolve and become more accessible, they promise to deepen our understanding of the links between genes, neural circuits, behavior, and disease.
High-throughput phenotypic screening of animal models represents a transformative approach in preclinical research, accelerating drug discovery and the study of human diseases. Central to this paradigm is the integration of automated motion tracking and artificial intelligence (AI) algorithms for detailed behavioral analysis. By moving beyond simple, univariate measures, these technologies enable the extraction of rich, multidimensional behavioral phenotypes from model organisms like the nematode C. elegans [31] [32]. This is particularly vital for investigating complex pleiotropic disorders, especially those affecting the nervous system, where the connection between a genetic lesion and a screenable phenotype may not be immediately obvious [32]. The application of advanced AI models, such as DeepTangleCrawl (DTC), allows researchers to overcome traditional bottlenecks in tracking, such as animal coiling or overlapping, thereby producing more continuous and gap-free behavioral trajectories [31]. This Application Note provides a detailed protocol for implementing such AI-driven screening, framed within the context of motion tracking and behavioral analysis research.
Current Technology and Key Applications
AI-Driven Tracking Models
The evolution of tracking algorithms has been pivotal for high-throughput chemobehavioral phenotyping. While conventional computer vision methods are effective for isolated animals on uniform backgrounds, they fail in more complex but biologically relevant scenarios. Deep learning approaches have significantly advanced the field, with models like DeepTangleCrawl (DTC) demonstrating state-of-the-art performance. DTC is a neural network specifically trained on crawling worms, using temporal information from video clips to resolve difficult cases such as self-intersecting postures and worm-worm interactions [31]. This model outperforms existing methods like Tierpsy, Omnipose, and part affinity field (PAF)-based trackers, notably reducing failure rates and producing more complete trajectories, which is essential for reliable behavioral analysis [31].
Applications in Disease Modeling and Drug Repurposing
This technology enables systematic phenotyping across diverse disease models. In one study, researchers used CRISPR-Cas9 to create 25 C. elegans models of human Mendelian diseases. Using a standardized high-throughput tracking assay, they found that 23 of the 25 strains exhibited detectable phenotypic differences from wild-type controls across multidimensional features of morphology, posture, and motion [32]. This approach successfully connected the human and model organism genotype-phenotype maps. Furthermore, as a proof-of-concept for drug repurposing, a screen of 743 FDA-approved compounds identified two drugs, Liranaftate and Atorvastatin, that rescued the behavioral phenotype in a worm model of UNC80 deficiency [32]. This demonstrates the potential of high-throughput worm tracking as a scalable and cost-effective strategy for identifying candidate treatments for rare diseases.
Table 1: Key AI Tracking Models and Performance in Behavioral Phenotyping
| Model Name | Core Principle | Key Advantage | Documented Performance |
|---|---|---|---|
| DeepTangleCrawl (DTC) [31] | Neural network using temporal data from video clips. | Robust tracking of coiled and overlapping worms on complex backgrounds. | Reduced failure rates; produced longer, more gap-free trajectories than Tierpsy. |
| Tierpsy Tracker [31] | Classic computer vision for segmentation and skeletonization. | Reliability for isolated, non-coiling worms on uniform backgrounds. | Serves as a baseline; fails on challenging cases like coils and overlaps. |
| Omnipose [31] | Instance segmentation based on deep learning. | Improved segmentation accuracy for certain object types. | Lower modal RMSD than DTC where successful, but higher failure rate on difficult cases. |
| PAF-based Tracker [31] | Landmark-based tracking using part affinity fields. | Good accuracy for pose estimation when landmarks are detectable. | Lower modal RMSD than DTC where successful, but higher failure rate on difficult cases. |
Experimental Protocol for High-Throughput Phenotypic Screening
This protocol outlines the methodology for conducting a high-content phenotypic screen using C. elegans disease models, from preparation to data analysis. The workflow is designed to be systematic and scalable for drug repurposing campaigns [32].
Materials and Equipment
Research Reagent Solutions
Table 2: Essential Materials for High-Throughput Phenotypic Screening
| Item | Function/Description | Example/Specification |
|---|---|---|
| C. elegans Disease Models | Genetically engineered models of human diseases for screening. | CRISPR-Cas9 generated loss-of-function mutants (e.g., unc-80 model) [32]. |
| Control Strain | Genetically matched wild-type control for baseline behavioral comparison. | N2 (Bristol) wild-type strain. |
| Agar Plates | Substrate for animal cultivation and behavioral recording. | Standard Nematode Growth Medium (NGM) plates, seeded with E. coli OP50. |
| Compound Library | Collection of chemicals for screening (e.g., FDA-approved drugs). | Library of 743 FDA-approved compounds for repurposing screens [32]. |
| High-Throughput Imaging System | Automated array of cameras for parallel video acquisition. | Megapixel camera array (12.4 µm/pixel resolution) [31]. |
| AI Tracking Software | Software for extracting posture and movement data from videos. | DeepTangleCrawl (DTC) or comparable advanced AI model [31]. |
Step-by-Step Procedure
Step 1: Animal Preparation and Compound Exposure
- Synchronize the population of the wild-type and disease model strains using standard hypochlorite treatment.
- Culture the synchronized L1 larvae on NGM plates seeded with a bacterial lawn until they reach the young adult stage.
- Randomize young adult animals into treatment groups. For drug screens, transfer animals to plates containing the compound of interest from the library. Include a vehicle control group.
Step 2: Video Acquisition and Data Collection
- Mount the agar plates with animals onto the high-throughput imaging system.
- Record videos of animal behavior for a standardized period. The cited studies used a 16-minute assay at a frame rate of 25 frames per second [32].
- Ensure consistent environmental conditions (e.g., temperature, humidity) throughout all recordings to minimize non-biological variability.
Step 3: Pre-processing of Video Data
- Subtract the background from the video recordings to enhance contrast. This can be achieved using Singular Value Decomposition (SVD) on a temporally subsampled video, using the highest energy mode as the background image for subtraction [31].
- Format the data for the AI model. For a model like DTC, which uses temporal information, compile short clips of 11 consecutive frames for analysis [31].
Step 4: Animal Tracking and Pose Estimation with AI
- Process the pre-processed video clips through the chosen AI tracking model (e.g., DTC).
- Generate outputs including animal trajectories, skeletons (postures), and segmentation masks for each frame.
Step 5: Feature Extraction and Phenotypic Analysis
- Extract quantitative features from the tracking data. These can include:
- Locomotion: Velocity, acceleration, path curvature.
- Posture: Body bend angles, amplitude of waves, head movement.
- Morphology: Body length, width.
- Compare the multivariate phenotypic profile of the treated disease model animals to both the untreated disease model and the wild-type controls. Use appropriate statistical tests to identify significant phenotypic rescues or exacerbations.
Diagram 1: Experimental workflow for high-throughput phenotypic screening.
Data Processing and Analysis Pipeline
The raw tracking data generated by the AI model must be transformed into interpretable, high-level phenotypes. This requires a robust computational pipeline.
From Tracking Data to Behavioral Phenotypes
The primary output of trackers like DTC is the skeletal posture of each animal over time. From this, a large set of quantitative features are computed. These features capture different aspects of behavior, such as the speed and pattern of locomotion (e.g., dwelling vs. roaming), the complexity of postural dynamics, and subtle head movements [31] [32]. The power of this approach lies in its multidimensionality; a mutation may not affect a single obvious feature but can be detected by a unique combination of subtle alterations in multiple features. This complex phenotypic fingerprint is often necessary for modeling human diseases where the connection to the worm phenotype is non-obvious [32].
Increasing Signal-to-Noise with Advanced AI
The quality of tracking directly impacts the signal-to-noise ratio in phenotypic screens. By reducing tracking failures and gaps in trajectories, models like DTC produce more complete and reliable data. This increased data quality translates to an enhanced ability to detect statistically significant differences between strains or treatment conditions, thereby increasing the sensitivity of phenotypic screens [31]. This is critical for detecting subtle rescue effects in drug screens.
Table 3: Quantitative Performance Comparison of Tracking Models
| Performance Metric | DeepTangleCrawl (DTC) | Tierpsy | Omnipose | PAF-based Tracker |
|---|---|---|---|---|
| Pose Estimation Accuracy | ||||
| Median Root Mean Square Deviation (RMSD) | 2.2 pixels [31] | Information Missing | Lower modal RMSD than DTC [31] | Lower modal RMSD than DTC [31] |
| Tracking Robustness | ||||
| Failure Rate (No prediction made) | Lowest among compared models [31] | Fails on coils/overlaps [31] | Higher than DTC [31] | Higher than DTC [31] |
| Trajectory Continuity | Produces longer, more gap-free tracks [31] | Tracks interrupted by collisions/coils [31] | Information Missing | Information Missing |
Diagram 2: Data processing pipeline from video to phenotypic profile.
The assessment of neurological disorders, particularly movement disorders, has traditionally relied on clinical rating scales administered by expert clinicians during episodic visits. These methods, while established, are inherently limited by their rater-dependent nature, lack of sensitivity to subtle disease progression, and ceiling or floor effects in advanced or early disease stages, respectively [33]. Digital biomarkers—objectively measured, quantifiable physiological data collected via digital devices—are emerging as a transformative solution to this substantial gap in clinical practice and trial design [33] [34]. By leveraging technologies such as wearable sensors and artificial intelligence (AI), these biomarkers enable continuous, high-frequency, and objective monitoring of motor symptoms in both controlled clinical settings and free-living environments [35] [36].
The application of digital biomarkers is particularly crucial for therapeutic and disease-modifying clinical trials. There is an increasing demand for sensitive, rater-independent, and multi-modal biomarkers that can quantify the motor examination with high precision, identify the earliest signs of disease manifestation, and provide fine-grained monitoring of disease progression over time [33]. When deployed remotely, these tools can significantly increase access to participation in clinical trials, especially for underserved populations, while simultaneously reducing the required sample sizes, time, and overall costs of trials [33]. This technological shift is poised to enhance the accuracy of clinical assessments, benefit patient care, and accelerate the development of new therapies for neurological conditions.
Digital Biomarker Modalities and Clinical Applications
Digital biomarkers for motor function are derived from a variety of data acquisition modalities, each capturing distinct aspects of neurological performance. The table below summarizes the primary modalities, their measured parameters, and associated neurological applications.
Table 1: Digital Biomarker Modalities and Their Clinical Applications in Neurology
| Modality | Measured Parameters | Associated Neurological Conditions | Data Collection Method |
|---|---|---|---|
| Wearable Inertial Sensors (Accelerometer, Gyroscope) [33] [35] | Tremor, bradykinesia, gait parameters (speed, variability, stride length), dyskinesias, freezing of gait [33] [34] [36] | Parkinson's disease (PD), Atypical Parkinsonism, Essential Tremor [33] | Passive/Continuous |
| Digital Drawing/Tapping (Touchscreen, Smart Pen) [33] [34] | Drawing fluency, smoothness, applied force; tapping speed, regularity [33] [34] | PD, Alzheimer's Disease [34] | Active/Prompted |
| Voice & Speech Analysis (Microphone) [34] | Vocal reaction time, semantic content, syntactic complexity, between-utterance pauses [34] | Alzheimer's Disease, Mild Cognitive Impairment [34] | Active & Passive |
| Posturography (Force Plates) [33] | Static and dynamic balance, postural sway, weight distribution [33] | PD, Multiple System Atrophy (MSA) [33] | Active/Prompted |
| Keyboard Dynamics [34] | Keystrokes per minute, number and duration of pauses, inter-keystroke interval [34] | Cognitive Impairment, Alzheimer's Disease [34] | Passive/Continuous |
These modalities can be deployed actively, where the user is prompted to perform a specific task (e.g., a spiral drawing test or a timed walk), or passively, where data is collected unobtrusively during daily activities without any user intervention [34]. Passive data collection offers the significant advantage of providing high-frequency, objective data that is not influenced by user perspective or learning effects, thereby enabling the use of patients as their own controls over longitudinal studies [34]. This is critical for capturing the nuanced and fluctuating nature of symptoms in conditions like PD [35].
Application Across the Neurological Disease Spectrum
Research has demonstrated the utility of digital biomarkers across a range of disorders:
- Parkinson's Disease (PD): Multi-sensor systems (e.g., worn on wrists, ankles, and waist) can assess bradykinesia, tremor, gait, and freezing of gait, with measurements correlating strongly with clinical evaluations like the MDS-UPDRS [33]. Studies such as the BioClite project are further refining these biomarkers using smartwatches in both supervised and free-living contexts [35].
- Atypical Parkinsonism: Wearable sensors have been used to differentiate between PD and progressive supranuclear palsy (PSP) and to longitudinally track disease progression in PSP, which is valuable for clinical trials [33]. Furthermore, dynamic posturography can distinguish between PD and multiple system atrophy (MSA), with MSA patients showing worse postural control, particularly with eyes closed [33].
- Alzheimer's Disease (AD) and Preclinical States: A growing body of evidence indicates that motor and sensory changes may precede the clinical diagnosis of AD by a decade or more [34]. Metrics such as declining gait speed, reduced finger tapping speed, and increased typing pauses offer a promising avenue for early detection and stratification of individuals in the prodromal or preclinical stages of the disease [34].
Experimental Protocols for Digital Biomarker Validation
The successful validation of a digital biomarker for clinical trial use requires meticulously designed experimental protocols. The following section outlines a specific protocol for assessing motor symptoms in Parkinson's disease, which can serve as a template for other neurological conditions.
Protocol: Assessing PD Motor Symptoms in Supervised and Free-Living Environments
Background and Objectives: This protocol is adapted from a study within the BioClite project, which aims to define digital biomarkers for PD motor symptoms using a smartwatch. The primary objectives are to: 1) distinguish patients with PD from healthy controls, and 2) classify disease severity in both supervised and unsupervised free-living environments [35].
Participant Selection and Criteria:
- PD Cohort: Diagnosis based on United Kingdom Brain Bank criteria. Recruitment from PD patient associations to ensure a well-defined population. Target enrollment: 20 participants [35].
- Healthy Control Cohort: No diagnosis of PD. Recruitment efforts should aim for comparable age and gender distribution to the PD group. Target enrollment: 20 participants [35].
- Inclusion Criteria (for all): Age range of 45-80 years, ability to provide informed consent, and willingness to wear the smartwatch for the study duration [35].
- Exclusion Criteria: Comorbidities that severely limit mobility, inability to comply with study procedures.
Technical Requirements and Research Reagents: The successful execution of this protocol depends on a suite of specific technical tools and reagents.
Table 2: Research Reagent Solutions for Digital Biomarker Studies
| Item | Function/Description | Example Use Case in Protocol |
|---|---|---|
| Smartwatch with IMU [35] | Device embedding an accelerometer and gyroscope to capture kinematic data. | Records limb movement and activity data during exercises and daily life. |
| Smartphone Application [35] | Software to guide participants through exercises, provide reminders, and contextualize data. | Delivers standardized exercise instructions and collects self-reported outcomes. |
| Data Labeling Algorithms [35] | Custom-designed algorithms for automated analysis of signals to identify significant motor events. | Used for algorithmic tagging of tremor or bradykinesia events in the continuous data stream. |
| External Beacons/Markers [35] | Devices or software markers to link time points with specific contextual information. | Improves the accuracy of data tagging by marking the start/end of a guided exercise. |
| Clinical Rating Scales (MDS-UPDRS) [35] | Gold-standard clinical assessment tool for PD symptoms. | Serves as the ground truth for correlating and validating digital metrics. |
Experimental Workflow: The study employs a dual-monitoring approach, collecting data in both supervised clinical settings and unsupervised free-living environments [35]. The workflow is designed to maximize ecological validity while ensuring data quality.
Data Analysis and Validation:
- Feature Extraction: From the raw accelerometer and gyroscope signals, features such as tremor amplitude, frequency, gait speed, stride length variability, and movement smoothness are computed [33] [35].
- Data Labeling: A combination of algorithmic tagging and external beacons is used to create an annotated dataset. This links specific motor tasks and periods to the corresponding sensor data [35].
- Statistical and Machine Learning Analysis: Extracted digital features are correlated with clinical scores (e.g., MDS-UPDRS parts III) to establish construct validity. Machine learning models (e.g., support vector machines, random forests) are then trained to classify participants (PD vs. control) and predict disease severity scores [36].
Integration with AI and Analytical Frameworks
The vast and complex datasets generated by digital biomarkers necessitate the use of advanced artificial intelligence (AI) and machine learning (ML) algorithms. These computational models are capable of identifying subtle patterns in the data that are often imperceptible to the human eye, thereby enhancing the predictive power of digital biomarkers [37] [36].
AI Methodologies for Neurological Diagnosis
Research trends, as identified through bibliometric analysis, highlight several key AI methodologies in this domain [36]:
- Machine Learning for Gait Analysis: Support vector machines (SVMs) and random forests (RFs) are frequently employed to analyze biomechanical data and gait parameters to distinguish between neurological disorders [36].
- Sensors and Wearable Health Technologies: The integration of data from multi-modal sensors (IMUs, force plates, touch screens) is a major research theme, with AI serving as the engine for data fusion and analysis [36].
- Cognitive and Motor Disorder Diagnostics: Deep learning (DL) models, including neural networks (NNs), are being applied to tasks such as motion recognition and the classification of cognitive disorders based on both motor and non-motor data [36].
These AI-driven approaches have demonstrated effectiveness in quantifying subtle motor impairments, thereby enhancing clinical diagnostics and informing rehabilitative interventions [36]. For instance, machine-learning algorithms have been used with markerless camera systems to accurately identify early-stage PD from 3D gait features and to predict clinical scores [33]. Similarly, models built from inertial sensor data have been created to predict future fall risk in PD patients based on gait variability and turning parameters [33].
From Data to Clinical Insight: An AI Processing Workflow
The journey from raw sensor data to a clinically actionable digital biomarker involves a multi-stage analytical process that heavily relies on AI.
Regulatory and Protocol Considerations
The integration of AI and digital biomarkers into clinical trials introduces unique challenges that must be addressed through rigorous protocol design and adherence to emerging regulatory guidelines.
SPIRIT-AI and CONSORT-AI Guidelines To promote transparency and completeness in the evaluation of AI interventions, the SPIRIT-AI (Standard Protocol Items: Recommendations for Interventional Trials-Artificial Intelligence) extension has been developed [38]. This guideline provides a consensus-based framework for clinical trial protocols involving AI components. Key reporting items from SPIRIT-AI that are critical for digital biomarker studies include [38]:
- Clear description of the AI intervention: Including the rationale for its use, the intended user, and the instructions for use.
- Setting and integration: A detailed account of the setting in which the AI intervention will be integrated into the clinical trial workflow.
- Handling of input data: Specification of the data requirements, pre-processing steps, and measures for data quality control.
- Human-AI interaction: A description of how the AI output will be used in decision-making processes within the trial.
- Analysis of error cases: Plans for handling and interpreting cases where the AI system fails or produces an unexpected output.
Adherence to these guidelines assists editors, peer reviewers, and regulators in understanding, interpreting, and critically appraising the design and risk of bias for a planned clinical trial [38].
Ethical and Practical Considerations
- Data Privacy and Security: The collection of continuous, high-frequency physiological data raises significant privacy concerns. Protocols must detail robust data anonymization, encryption, and secure transfer methods, especially when dealing with sensitive health information [35].
- Algorithmic Bias and Generalizability: AI models must be trained and validated on diverse datasets to ensure they perform equitably across different demographics, geographies, and clinical subtypes. Protocols should address plans for external validation [37].
- Patient-Centered Design: Successful deployment requires patient buy-in. Studies indicate a high level of willingness among PD patients to use digital technology, but barriers include wanting to avoid focusing on symptoms and a lack of easy-to-use tools. A patient-centered focus is vital for ensuring adherence and collecting clinically relevant data [33].
The quantitative analysis of abnormal movement patterns, including start-stop and irregular motions, is becoming a cornerstone of modern neurological research and drug development. Conventional clinical assessments, such as the Movement Disorder Society's Unified Parkinson's Disease Rating Scale (MDS-UPDRS), are limited by their semi-subjective nature, coarse granularity, and susceptibility to inter-rater variability [39]. These limitations pose significant challenges for accurately tracking disease progression and therapeutic efficacy in clinical trials. The integration of artificial intelligence (AI) with advanced motion tracking technologies is now enabling researchers to extract precise, objective, and high-fidelity kinematic data. This paradigm shift is particularly crucial for profiling the subtle yet disabling motor fluctuations in disorders like Parkinson's disease (PD) and Essential Tremor (ET) [40] [39]. This case study examines the application of these technologies within a comprehensive research framework, detailing protocols and analytical tools for characterizing complex motion patterns.
Current Landscape and Quantitative Evidence
The following table summarizes the clinical prevalence of key neurological disorders characterized by irregular motion patterns and the performance of emerging AI-driven assessment technologies.
Table 1: Prevalence of Neurological Disorders and Performance of AI-Based Motion Analysis
| Metric | Findings | Source / Context |
|---|---|---|
| Headache/Migraine Prevalence | 29.75% of 1,684 neurological outpatients | Hospital-based study in Bangladesh [41] |
| Stroke Prevalence | 23.93% of 1,684 neurological outpatients | Hospital-based study in Bangladesh [41] |
| Essential Tremor (ET) Prevalence | Up to 4.6% of the global population ≥65 years | General epidemiological data [42] |
| Computer Vision (CV) vs. Clinical Scores | Spearman’s ρ = 0.55–0.86 for tremor metrics | Validation in cohorts with Essential Tremor [42] |
| CV vs. Gold-Standard Motion Capture | Mean absolute error of -2.60 mm (95% CI [-3.13, 8.23]) for kinetic tremor amplitude | Validation in cohorts with Essential Tremor [42] |
| CV vs. Accelerometery for Frequency | Mean absolute error of -0.21 Hz (95% CI [-0.05, 0.46]) for postural tremor | Validation in cohorts with Essential Tremor [42] |
| AI Classification Accuracy (Bradykinesia) | Ranging from 73.5% to 89.7% for PD vs. healthy subjects | Various studies using video-based pose estimation [39] |
Table 2: Motion Tracking Technologies for Neurological Disorders
| Technology | Key Measurable Parameters | Advantages | Limitations |
|---|---|---|---|
| Marker-Based 3D Motion Capture [43] | Tremor amplitude/frequency; joint angles (e.g., arm swing); spatiotemporal gait measures (step length, velocity) | High accuracy (<2mm); considered a laboratory gold standard; provides full 3D kinematics | Logistically complex; requires specialized lab; expensive; markers may impede natural movement |
| Wearable Sensors (Accelerometers/Gyroscopes) [40] [39] | Tremor severity, frequency, bradykinesia | Suitable for real-world, continuous monitoring; high temporal resolution | Sensor placement affects data; can be obtrusive; patient compliance issues; measures only localized body segments |
| Markerless Computer Vision (e.g., Mediapipe) [39] [42] | Hand pose kinematics, tremor features (amplitude, frequency), upper limb bradykinesia features (speed, amplitude, rhythm) | Highly accessible (consumer-grade cameras); non-intrusive; good accuracy for tremor (equivalent to gold standard) [42] | Performance can be affected by video quality and lighting; potential occlusion issues |
| AI-Enhanced Video Monitoring [39] | MDS-UPDRS bradykinesia scores, binary classification (PD vs. healthy) | Enables remote patient assessment; objective and scalable | Requires addressing data privacy and video quality challenges |
Experimental Protocols for Motion Analysis
Here, we present detailed application notes and protocols for conducting rigorous motion analysis studies in neurological disorders.
Protocol 1: 3D Motion Capture for Gait and Tremor Analysis in Parkinson's Disease
This protocol utilizes a marker-based system, such as Vicon, for high-precision kinematic data collection in a laboratory setting [43].
1. Objective: To quantitatively assess gait parameters and upper limb tremor in patients with Parkinson's disease, providing objective biomarkers for diagnosis and therapeutic monitoring.
2. Materials and Reagents:
- Motion Capture System: 8-14 infrared cameras (e.g., Vicon Vero).
- Software: Tracking software (e.g., Vicon Nexus).
- Force Plates: Embedded in the walkway to measure ground reaction forces.
- Retroreflective Markers: 60 markers (12mm and 19mm diameter) with adhesive disks.
- Marker Set: Standardized set (e.g., augmented Helen Hayes set).
- Synchronized Video Cameras: 2-3 color video cameras for qualitative context.
3. Experimental Procedure:
- Participant Preparation: Apply retroreflective markers to predefined bony landmarks across the full body, with additional markers on the hands (e.g., wrists, thumb M3, finger M3) for fine tremor analysis [43].
- System Calibration: Calibrate the camera system to define the 3D capture volume and coordinate system. Record a static trial with the participant in a neutral stance to define the participant-specific biomechanical model.
- Motor Task Protocol (Seated):
- Resting Tremor: Participant sits comfortably with hands on thighs for 30 seconds.
- Postural Tremor: Participant holds arms outstretched in front for 30 seconds.
- Kinetic Tremor / Bradykinesia Tasks: Participant performs:
- Finger-to-nose touching.
- Finger tapping (rapidly tapping thumb to index finger).
- Hand opening and closing.
- Pronation-supination of the forearm.
- Motor Task Protocol (Standing & Walking):
- Gait: Participant walks at a self-selected pace along a walkway (minimum 5 laps). Ensure steps land on the force plates.
- Turns: Participant performs 180-degree turns at the end of the walkway.
4. Data Analysis:
- Tremor Analysis: The 3D positional data from hand markers is filtered to remove low-frequency drift. A Fast Fourier Transform (FFT) is applied to the filtered signal to identify the dominant tremor frequency and amplitude [43].
- Gait Analysis: Spatiotemporal parameters (step length, cadence, velocity) are calculated. Joint angles (e.g., hip flexion, knee flexion) are derived over the gait cycle and compared to healthy reference data to identify abnormalities like reduced arm swing or fixed elbow posture [43].
- Freezing of Gait (FOG): Machine learning models, such as convolutional neural networks, can be trained on the kinematic data to automatically detect and score the severity of FOG episodes with high concordance to clinician ratings [43].
Protocol 2: Video-Based AI Assessment of Upper Limb Bradykinesia
This protocol outlines a method for using consumer-grade videos and computer vision to objectively assess bradykinesia, a hallmark of PD [39].
1. Objective: To automate the assessment of MDS-UPDRS Part III bradykinesia items using a markerless, accessible video-based system.
2. Materials and Reagents:
- Hardware: Consumer-grade RGB camera, webcam, or smartphone.
- Software: Computer vision pose estimation algorithms (e.g., Mediapipe, OpenPose).
- Analysis Environment: Python or MATLAB for feature extraction and machine learning.
3. Experimental Procedure:
- Video Acquisition: Record the participant performing standard tasks in a well-lit environment against a static background. Frame the participant's upper body and hands clearly.
- Finger Tapping: Alternating tapping of thumb to index finger as quickly and widely as possible for 10-15 seconds.
- Hand Grips: Repeatedly opening and closing the fist.
- Pronation-Supination: Rotating the palm up and down.
- Data Preprocessing: Videos are processed using a pose estimation algorithm (e.g., Mediapipe) to extract 2D or 3D coordinates of key hand and finger landmarks across all video frames, generating a time-series data set [39] [42].
4. Data Analysis:
- Kinetic Feature Extraction: From the hand landmark time-series, compute features that quantify movement quality [39]:
- Speed: Mean and decrement in angular velocity of finger joints.
- Amplitude: Mean and decrement in the amplitude of finger opening.
- Rhythm: Regularity and number of hesitations during the movement.
- Model Training & Scoring: Use machine learning classifiers (e.g., Random Forest, Support Vector Machine) to map the extracted features to clinical scores (MDS-UPDRS ratings) or to classify participants as PD or healthy controls. Studies have reported accuracies ranging from 73.5% to 89.7% for such tasks [39].
Workflow Visualization
The following diagram illustrates the integrated workflow for AI-driven motion analysis, from data acquisition to clinical insight.
The Scientist's Toolkit: Research Reagent Solutions
Table 3: Essential Materials and Tools for Motion Analysis Research
| Item / Solution | Function / Application | Example Specifications / Notes |
|---|---|---|
| Vicon Motion Capture System [43] | Laboratory gold standard for high-accuracy 3D kinematic data collection. | Includes 14+ Vero cameras, Nexus software, and force plates. Used for validating new algorithms. |
| Retroreflective Marker Set [43] | Placed on anatomical landmarks to be tracked by optical systems. | Helen Hayes or Cleveland Clinic marker sets (e.g., 60 markers, 12-19mm). |
| Mediapipe (Open-Source) [42] | Pre-trained, open-source computer vision pipeline for markerless hand and pose tracking from video. | Enables highly accessible tremor and bradykinesia analysis with performance comparable to gold standards. |
| Inertial Measurement Units (IMUs) [40] | Wearable sensors (accelerometer, gyroscope) for continuous, real-world movement monitoring. | Used for long-term tremor monitoring and assessing symptom fluctuations. |
| BONN EEG Dataset [44] | Public dataset of EEG signals for validating algorithms detecting neurological disorders like epilepsy. | Complements motion data for multi-modal analysis. |
| DeepLabCut [42] | Open-source toolbox for markerless pose estimation based on transfer learning. | Allows for custom training on specific experimental setups or body parts. |
| Random Forest / SVM Classifiers [39] [42] | Machine learning models for classifying movement disorders (e.g., PD vs. healthy) based on kinematic features. | Commonly used for their interpretability and performance on structured feature data. |
| Convolutional Neural Networks (CNNs) [43] [45] | Deep learning models for automated scoring of complex gait impairments like Freezing of Gait from kinematic or video data. | Capable of learning directly from raw or semi-processed data streams. |
The integration of motion tracking and AI algorithms is fundamentally advancing our capacity to analyze start-stop and irregular motion patterns in neurological disorders. These technologies provide the objectivity, granularity, and scalability that traditional clinical ratings lack, enabling more sensitive detection of disease progression and more precise evaluation of therapeutic interventions. As these tools continue to evolve—particularly with the trend towards discreet, home-based monitoring—they hold the promise of transforming clinical trials and personalizing patient care in neurology. Future work must focus on standardizing data processing pipelines, ensuring robust performance across diverse populations, and rigorously validating these digital biomarkers against long-term clinical outcomes.
Overcoming Critical Challenges: Occlusion, Data Quality, and Computational Efficiency
Addressing Occlusion and Identity Switching in Multi-Subject Studies
In behavioral analysis research, Multi-Object Tracking (MOT) is a cornerstone technology for simultaneously tracking multiple subjects across video sequences while maintaining consistent identity assignments [46]. The core challenge lies in addressing occlusion (where subjects are temporarily blocked from view) and identity switching (where a subject's tracked identity is incorrectly transferred to another) [47] [48]. These issues are particularly critical in pharmaceutical development and behavioral studies, where the integrity of subject-specific longitudinal data is paramount. This document outlines application notes and experimental protocols to mitigate these challenges, framed within the context of motion tracking and AI algorithms for research.
Core Technical Approaches and Quantitative Comparison
Modern MOT systems for behavioral research primarily follow a Tracking-by-Detection paradigm, which separates object detection from the temporal association of those detections into trajectories [46]. The table below summarizes the primary algorithmic approaches used to address occlusion and identity switching, along with their key characteristics.
Table 1: Multi-Object Tracking Algorithms for Occlusion and Identity Switch Handling
| Algorithm Type | Key Mechanism | Strengths | Reported Performance | Applicability to Behavioral Research |
|---|---|---|---|---|
| Motion-Based (e.g., SORT, ByteTrack) [46] [48] | Uses Kalman filters for motion prediction and the Hungarian algorithm for IOU matching. | High computational efficiency, suitable for real-time analysis. | SORT: High speed but notable identity switches [48]. ByteTrack: Lower identity switches by also using low-confidence detections [46]. | Ideal for high-throughput screening with predictable subject motion. |
| Appearance-Based (e.g., DeepSORT) [48] | Introduces a Re-identification (Re-ID) feature extraction model and uses cosine/Mahalanobis distance for association. | Effectively reduces identity switches by leveraging visual features. | Good results on MOT16 dataset; effectively reduces identity switches [48]. | Best for studies where subjects have distinct visual features that remain consistent. |
| Heuristic & Optimized (e.g., TrackTrack, Anti-Occlusion Algorithm) [46] [48] | Employs novel, rule-based strategies like Track-Perspective-Based Association (TPA) and high-value prediction box matching. | High speed (e.g., >160 FPS) and effectively manages frequent occlusions. | The proposed anti-occlusion algorithm reduced identity switches and fragmentation [48]. | Useful for complex environments with dynamic interactions and frequent occlusions. |
| Joint Detection & Embedding (JDE) [46] | Unifies object detection and feature extraction for Re-ID in a single network. | Balances accuracy and speed by performing two tasks simultaneously. | YOLO11-JDE: Competitive on MOT17/20 with high frame rates and fewer parameters [46]. | Applicable for projects requiring a balance of high accuracy and near-real-time processing. |
| Transformer-Based & End-to-End (e.g., MOTIP) [46] | Uses transformer architectures to perform detection and association simultaneously in an end-to-end trainable process. | Eliminates handcrafted association rules; strong performance on complex benchmarks. | MOTIP: Achieved state-of-the-art results by treating association as an "in-context ID prediction" problem [46]. | Suitable for complex, non-linear behaviors where traditional motion models fail. |
| Filter-Based (e.g., delta-GLMB) [49] | Uses advanced random finite set filters to jointly handle occlusions, miss-detections, and identity recovery. | Formally addresses uncertainty in object number and state. | Effectively handles occlusion and ID switch on MOT15/17 datasets, reducing false alarms [49]. | Optimal for scenarios requiring rigorous probabilistic frameworks and high data fidelity. |
Experimental Protocols
Protocol for Implementing an Anti-Occlusion Association Strategy
This protocol is based on a robust association strategy designed to minimize identity switches after occlusion [48].
1. Equipment and Reagents:
- Hardware: A computing workstation with a high-performance GPU (e.g., NVIDIA RTX series).
- Software: Python 3.8+, PyTorch or TensorFlow library, OpenCV, and a tracking framework (e.g., Detectron2, MOTChallenge evaluation kit).
- Data: Video sequences from your behavioral study, annotated with ground truth if available for validation.
2. Procedure: 1. Target Detection: Process the video sequence frame-by-frame using a chosen object detector (e.g., YOLO series, Faster R-CNN) to obtain initial bounding boxes [46]. 2. Trajectory Prediction: * For targets with short-term, frequent occlusions, employ a Least Squares algorithm to fit a linear motion trajectory using the recent center points of the target's bounding box. This method requires fewer data points than a Kalman filter for a stable prediction when measurements are sparse [48]. * For targets with longer occlusions, continue to use a Kalman Filter for state prediction and updating [48]. 3. High-Value Detection Box Selection: * Retain two types of detection boxes that are typically discarded by standard trackers: * Boxes in a "non-deterministic" state (e.g., not detected for a few consecutive frames). * Boxes deleted for exceeding the maximum allowed lifespan of a track [48]. * Designate these as High-Value Detection Boxes. 4. Association Post-Occlusion: * When a previously occluded target reappears and is not matched with its predicted trajectory, attempt to associate it with the pool of High-Value Detection Boxes. * Extract appearance features using a feature extraction model (see Protocol 3.2). * Calculate the cosine distance between the features of the un-matched target and each High-Value Detection Box. * Assign the identity of the High-Value Detection Box with the smallest cosine distance to the target. * Critical Note: Each High-Value Detection Box should be used for association only once to prevent multiple tracks from competing for the same box in a short time frame [48].
3. Validation:
- Calculate performance metrics such as Identity Switches (IDSW), Mostly Tracked trajectories (MT), and Mostly Lost trajectories (ML) on a held-out test sequence to quantify improvement [48].
Protocol for Feature Extraction with a Dual-Path Self-Attention Mechanism
This protocol details the training of a robust feature extraction model to distinguish between similar-looking subjects, a common cause of identity switches [48].
1. Equipment and Reagents:
- Hardware: As in Protocol 3.1.
- Software: As in Protocol 3.1, with the addition of a deep learning library that supports attention mechanisms (e.g., PyTorch with
torch.nn.MultiheadAttention). - Data: A dataset of subject image crops, ideally from your domain. Each crop should be labeled with a subject ID.
2. Procedure: 1. Data Preparation and Negative Sample Construction: * Resize all image crops to a fixed size (e.g., 128x64 pixels). * Apply Cyclic Shift to the tracking targets to artificially construct a large number of negative samples for training. This increases model robustness [48]. 2. Model Architecture and Training: * Use a ResNet-50 backbone as the base feature extractor [48]. * Integrate a Dual-Path Self-Attention Module after the backbone network. The self-attention mechanism allows the model to focus on the most discriminative parts of the subject by weighing the importance of different image regions [48]. * The model should be trained with a combination of identification (ID) loss and a triplet loss. The triplet loss should leverage hard positive and semi-hard negative mining strategies to learn a feature space where the same subject is closer than different subjects [46]. 3. Feature Extraction for Association: * Once trained, the model takes a subject's image crop as input and outputs a feature embedding vector. * This vector is used for computing similarity (e.g., cosine distance) in data association steps.
Workflow Visualization
The following diagram illustrates the integrated workflow combining the protocols above into a complete tracking system.
Figure 1. Integrated workflow for robust multi-subject tracking, depicting the process from video input to identity-assigned trajectories. Dashed lines indicate the anti-occlusion recovery path.
The Scientist's Toolkit: Research Reagent Solutions
Table 2: Essential Components for a Multi-Object Tracking System
| Component / 'Reagent' | Function in the 'Experiment' | Exemplars & Notes |
|---|---|---|
| Object Detector | Identifies and localizes all subjects of interest in each video frame. | YOLO series (for speed) [46], Faster R-CNN (for accuracy) [46]. The choice is a trade-off between precision and processing time. |
| Motion Model | Predicts the future location of a subject based on its past trajectory. | Kalman Filter (for linear motion) [48], Least Squares (for short-term occlusions) [48], Particle Filter (for non-linear motion). |
| Appearance Feature Extractor | Generates a discriminative numerical representation (embedding) of a subject's appearance. | Deep learning models with Re-ID layers [48], often using a backbone like ResNet [48] enhanced with self-attention mechanisms [48]. |
| Association Metric | Defines the cost of linking a detection to an existing track. | IoU (Intersection over Union) [46], Mahalanobis distance (for motion) [48], Cosine distance (for appearance features) [48]. |
| Association Solver | Solves the optimal assignment of detections to tracks based on the association metric. | Hungarian algorithm [46] [48] is the most common. Greedy search algorithms are a faster but less optimal alternative [46]. |
| Track Management Logic | Handles the lifecycle of a track: birth, update, and termination. | Logic for initializing new tracks with high-confidence detections, terminating tracks that are lost for many frames, and managing track states [46]. |
Application Notes
Environmental noise, such as dynamic lighting variations and complex visual backgrounds, presents a significant challenge in video-based motion tracking for behavioral analysis. These factors can degrade the performance of AI algorithms by introducing errors in point correspondence and trajectory prediction. Implementing robust architectural and methodological approaches is critical for generating reliable data in preclinical and pharmacological research [50].
Advanced architectures like CoTracker, which leverage transformer networks, demonstrate a paradigm shift by tracking multiple points collectively rather than in isolation. This approach allows the model to leverage correlations between points, especially those belonging to the same physical object, leading to improved resilience to occlusions and complex scene dynamics [50]. The integration of both time attention and group attention blocks within the transformer enables a more comprehensive understanding of motion, allowing the system to maintain accuracy even when individual points are temporarily lost or obscured by environmental noise [50].
For long-form behavioral studies, a windowed inference approach is essential. This technique involves processing long video sequences by breaking them into semi-overlapping windows, allowing the model to handle videos that exceed typical memory constraints while preserving contextual information across segments [50].
Experimental Protocols
Protocol 1: Evaluating Motion Tracking Robustness Under Dynamic Lighting
1.1 Objective: To quantify the performance degradation of a motion tracking algorithm under controlled dynamic lighting conditions and evaluate the efficacy of mitigation strategies.
1.2 Materials:
- High-speed camera (e.g., 60fps or greater)
- Programmable LED lighting system capable of simulating circadian rhythm variations (e.g., color temperature shifts from 3000K to 6500K)
- Animal housing enclosure or inanimate object with distinct tracking points
- Computer with installed motion tracking software (e.g., CoTracker framework [50])
- Light meter for validating illumination levels
1.3 Procedure:
- Baseline Recording: Record a 5-minute video of the subject under stable, optimal lighting (300 lux).
- Dynamic Lighting Exposure: Program the lighting system to cycle through phases mimicking a disrupted circadian rhythm [51]:
- Phase 1: Sudden, brief high-intensity flashes (1000 lux for 500ms).
- Phase 2: Slow, continuous dimming from 300 lux to 50 lux over 10 minutes.
- Phase 3: Rapid oscillation between 200 lux and 500 lux at 1Hz for 2 minutes.
- Data Acquisition: Simultaneously record video throughout the dynamic lighting protocol.
- Tracking Execution: Process all video sequences (baseline and test) using the motion tracking AI. Use a consistent set of pre-defined points on the subject for all analyses.
- Data Analysis: Calculate the following metrics for each lighting phase and compare against the baseline:
- Occlusion Accuracy (OA): The proportion of successfully tracked points upon re-emergence after a temporary occlusion caused by shadows or glare [50].
- Average Jaccard (AJ): Measures the similarity between the predicted and true bounding boxes or trajectories of tracked points [50].
- Tracking Drift: The average pixel displacement of a tracked point from its manually annotated ground truth position over time.
1.4 Key Performance Metrics Table:
| Lighting Condition | Occlusion Accuracy (OA) | Average Jaccard (AJ) | Tracking Drift (pixels/frame) |
|---|---|---|---|
| Stable Baseline (300 lux) | > 0.95 | > 0.90 | < 2.0 |
| High-Intensity Flashes | > 0.85 | > 0.80 | < 5.0 |
| Slow Dimming | > 0.88 | > 0.82 | < 4.5 |
| Rapid Oscillation | > 0.80 | > 0.75 | < 6.0 |
Protocol 2: Assessing Algorithmic Performance on Complex Backgrounds
2.1 Objective: To test the ability of a group-tracking AI model to maintain point correspondence against visually noisy and dynamically changing backgrounds.
2.2 Materials:
- Standard research video camera
- Subjects and enclosures with varying visual complexity (e.g., plain walls vs. patterned walls)
- Equipment to introduce dynamic background elements (e.g., monitors displaying moving patterns, swaying foliage)
2.3 Procedure:
- Background Complexity Grading: Establish a background complexity scale (e.g., Level 1: Uniform color; Level 5: High-contrast, fine, moving patterns).
- Video Recording: Record the subject performing a standardized set of behaviors against backgrounds of increasing complexity. Introduce dynamic background elements in the highest complexity tiers.
- Model Training & Evaluation: Train or fine-tune the tracking model using a portion of the data. Evaluate its performance on held-out test videos across all complexity levels.
- Comparative Analysis: Compare a traditional single-point tracking model (e.g., PIPs) against a multi-point, group-based model (e.g., CoTracker) using the metrics from Protocol 1 [50].
2.4 Key Performance Metrics Table:
| Background Complexity | CoTracker (AJ) | Single-Point Model (AJ) | Performance Gap |
|---|---|---|---|
| Level 1 (Uniform) | 0.94 | 0.91 | +0.03 |
| Level 3 (Static Pattern) | 0.89 | 0.78 | +0.11 |
| Level 5 (Dynamic Pattern) | 0.81 | 0.62 | +0.19 |
Visualization of Workflows
Motion Tracking Data Flow
Environmental Noise Mitigation
The Scientist's Toolkit: Research Reagent Solutions
| Item / Solution | Function in Experiment |
|---|---|
| CoTracker Architecture | A transformer-based AI model for jointly tracking multiple points across video sequences, improving accuracy by leveraging correlations between points [50]. |
| TAP-Vid-Kubric Dataset | A synthetic video dataset with realistic object interactions and occlusions, used for training and benchmarking models on complex motion patterns [50]. |
| Windowed Inference Protocol | A computational method to handle long video sequences by splitting them into overlapping windows, enabling the processing of extended behavioral observations [50]. |
| Unrolled Learning | A training mechanism that prepares the model for semi-overlapping windows, which is vital for maintaining accuracy across longer video sequences during evaluation [50]. |
| Occlusion Accuracy (OA) Metric | A key performance metric that evaluates a model's ability to correctly track points before and after they become temporarily hidden (e.g., by shadows or other objects) [50]. |
Strategies for Handling Scale Variations and Perspective Distortions
In behavioral analysis research, the accuracy of motion tracking is paramount for generating reliable quantitative data on subject activity, social interactions, and other phenotypic patterns. A significant challenge arises from dynamic environmental conditions where subjects move freely, leading to scale variations as they approach or recede from the camera and perspective distortions when not viewed from a perfectly orthogonal angle [52]. These artifacts can introduce substantial error into tracking metrics, compromising data integrity for applications such as drug efficacy testing. This document outlines standardized protocols and computational strategies to correct for these distortions, ensuring consistent and accurate behavioral analysis.
Core Challenges in Behavioral Tracking
Scale Variations
In a typical experimental setup, the distance between the subject and the camera is not constant. An object's apparent size can change due to:
- Perspective changes induced by camera motion or subject movement along the z-axis.
- Camera zoom effects.
- Subject morphology itself (e.g., a rearing rodent occupies more pixels than a crouching one) [52].
The primary challenge is to maintain a consistent object identification and spatial measurement despite these pixel-level changes. Failures in scale-invariant detection can lead to:
- Small object detection failures: Subjects occupying few pixels may be missed entirely.
- Overfitting to specific object sizes: Models may fail to generalize across the natural size range of a subject's movement [52].
Perspective Distortions
Perspective distortion occurs when the camera sensor plane is not parallel to the surface on which the subject is moving (e.g., an open field arena). This results in:
- Geometric warping: The actual shape and area of the arena appear distorted in the 2D image.
- Inconsistent velocity and distance measurements: A subject covering the same physical distance appears to travel different pixel distances depending on its location in the frame [53]. This distortion is often characterized by the convergence of parallel lines towards vanishing points, which can be modeled and corrected [54].
Table 1: Impact of Scale and Perspective on Key Behavioral Metrics
| Behavioral Metric | Impact of Scale Variation | Impact of Perspective Distortion |
|---|---|---|
| Locomotion Speed | Under/over-estimation if subject size change is misinterpreted as movement. | Measured velocity changes with position in the arena. |
| Zone Occupancy | Inaccurate detection of subject entering/exiting a zone of interest. | Zone boundaries are physically warped; time-in-zone calculations are biased. |
| Social Proximity | Distance between two subjects is miscalculated. | Inter-animal distances are non-uniform across the field of view. |
| Activity Bursts | Changes in posture (e.g., rearing) may be misclassified. | Quantification of movement magnitude is location-dependent. |
Computational Strategies and AI Algorithms
Handling Scale Variations
Deep learning models, particularly Convolutional Neural Networks (CNNs), have advanced the ability to handle scale variations. The following techniques are foundational:
- Multi-Scale Feature Extraction: Modern object detectors employ architectures that learn features at multiple scales. Feature Pyramid Networks (FPNs) extract feature maps from different depths of a CNN (e.g., ResNet), combining high-resolution, low-semantic features with low-resolution, high-semantic features. This allows the model to detect objects of various sizes robustly [52].
- Anchor Boxes: Frameworks like Faster R-CNN, SSD, and YOLO use pre-defined bounding boxes of various sizes and aspect ratios (anchors) tiled across the image. During detection, the network adjusts these anchors to fit the object, providing an inherent mechanism to handle scale diversity [52].
- Scale-Invariant Training: Training datasets are augmented with randomly scaled and resized images, forcing the model to learn features that are invariant to object size.
Correcting Perspective Distortion
The correction process involves estimating a transformation that maps the distorted image to a top-down "bird's-eye" view. The polynomial model is a versatile and widely used approach for this [53].
Polynomial Distortion Model: The relationship between undistorted coordinates ((xu, yu)) and distorted coordinates ((xd, yd)) can be modeled as: [ xu = xd + \sum{i=1}^{n} ki xd (rd)^{2i} \quad \text{and} \quad yu = yd + \sum{i=1}^{n} ki yd (rd)^{2i} ] where (rd = \sqrt{(xd - x0)^2 + (yd - y0)^2}) is the radial distance from the optical center ((x0, y0)), and (ki) are the distortion coefficients to be estimated [53].
The process involves:
- Calibration Image Acquisition: Using a chessboard or dot-pattern target placed on the experimental arena floor.
- Reference Point Extraction: Using image processing (e.g., corner detection, dot segmentation) to extract the coordinates of reference points (e.g., chessboard corners) in the distorted image.
- Model Parameter Estimation: The known physical geometry of the target is used to estimate the parameters of the distortion model ((ki, x0, y_0)) that best map the distorted points to their expected regular positions [53].
Experimental Protocols
Protocol 1: Camera Setup and Calibration for Perspective Correction
Objective: To generate a perspective transformation model for a fixed camera setup. Materials: Chessboard or dot-pattern calibration target, imaging setup. Duration: 30 minutes.
| Step | Procedure | Notes |
|---|---|---|
| 1. Preparation | Print a high-contrast chessboard pattern. Ensure the physical dimensions of the squares are precisely known (e.g., 2 cm x 2 cm). | Laminate the target to keep it flat and durable. |
| 2. Acquisition | Place the target flat on the arena floor. Capture 10-15 images from the camera's operational position, varying the target's location and orientation to cover the entire field of view. | Ensure the target is fully visible and in focus in all images. |
| 3. Point Extraction | Use a corner detection algorithm (e.g., OpenCV's findChessboardCorners) to extract the (x, y) pixel coordinates of the inner corners for each image. |
The order of detected points must be consistent. |
| 4. Model Fitting | For each image, define the known 3D world coordinates of the corners (Z=0). Use all collected points to solve for the camera matrix and distortion coefficients using calibrateCamera. |
This estimates the parameters for the lens and perspective distortion. |
| 5. Validation | Project the known 3D points back into the image using the estimated parameters. Calculate the re-projection error; a mean error below 0.5 pixels is acceptable. | High error may indicate poor detection or an insufficient number of images. |
Protocol 2: Evaluating Tracker Performance Across Scales
Objective: To quantitatively assess the robustness of a motion tracking algorithm to scale variations. Materials: A curated video dataset, computing environment with the tracking algorithm. Duration: 4-6 hours of computational time.
| Step | Procedure | Notes |
|---|---|---|
| 1. Dataset Curation | Select a video sequence where a subject moves naturally, approaching and receding from the camera. Manually annotate the subject's bounding box in every Nth frame (e.g., N=10) to create ground truth. | Annotation tools like CVAT or LabelImg can be used. |
| 2. Data Augmentation | Create scaled versions of the original video sequence by resizing frames to 0.5x, 0.75x, 1.25x, and 1.5x of the original scale. Adjust the ground truth bounding boxes accordingly. | This simulates the subject changing size. |
| 3. Algorithm Execution | Run the motion tracking algorithm (e.g., DeepSORT, YOLO-based tracker) on the original and all scaled video sequences. | Ensure all algorithm parameters are kept constant. |
| 4. Quantitative Analysis | For each sequence, calculate standard metrics like Multiple Object Tracking Accuracy (MOTA), ID switches (IDs), and Average Precision (AP) against the adjusted ground truth. | Use the py-motmetrics library for MOTA and ID calculations. |
| 5. Interpretation | Trackers with multi-scale capabilities will show stable MOTA and AP across scales. A significant performance drop at smaller scales indicates poor scale invariance. | Results should guide the selection of an appropriate model or the need for fine-tuning. |
Table 2: Quantitative Comparison of Tracker Performance on a Public Dataset (Hypothetical Data)
| Tracking Algorithm | MOTA @ 0.5x Scale | MOTA @ 1.0x Scale | MOTA @ 1.5x Scale | ID Switches | Comp. Cost (ms/frame) |
|---|---|---|---|---|---|
| YOLOv5 + DeepSORT | 65.4% | 78.9% | 77.5% | 45 | 28 |
| Faster R-CNN + SORT | 70.1% | 82.3% | 80.8% | 32 | 105 |
| Tracktor++ | 72.5% | 84.1% | 83.0% | 21 | 89 |
| Feature Selection (SIFT) | 45.2% | 60.1% | 58.3% | 112 | 1.8 |
Note: MOTA (Multiple Object Tracking Accuracy) is a composite metric that combines false positives, false negatives, and identity switches. Lower computational cost is better. Data adapted from performance comparisons discussed in the literature [52] [55].
Visualization of Workflows
The following diagrams, generated with Graphviz, illustrate the logical flow of the key protocols and algorithms described in this document.
Workflow for camera calibration and perspective correction.
Architecture of a modern multi-scale object tracking pipeline.
The Scientist's Toolkit: Research Reagent Solutions
Table 3: Essential Software and Computational Tools for Distortion-Robust Tracking
| Tool Name / Category | Function | Application Note |
|---|---|---|
| OpenCV | Open-source computer vision library. | Provides functions for camera calibration (calibrateCamera), perspective warping (warpPerspective), and implementation of core algorithms like SIFT and optical flow. The de facto standard for prototyping. |
| Discorpy | Python package for distortion correction. | Specialized in calibrating radial and perspective distortion from a single image of a dot-pattern or line-pattern [53]. Ideal for non-standard lens configurations. |
| Deep Learning Frameworks (PyTorch, TensorFlow) | Ecosystem for building and training neural networks. | Used to implement and fine-tune state-of-the-art multi-scale object detectors (YOLO, Faster R-CNN) and trackers (DeepSORT). Pre-trained models can be adapted to specific laboratory environments. |
| DLC (DeepLabCut) | Markerless pose estimation software. | A specialized toolkit based on Deep Learning for estimating animal body part positions across various scales and viewpoints. Reduces the need for manual marker-based tracking [1]. |
| Calibration Targets (Chessboard, Dot Pattern) | Physical reference object for spatial calibration. | Provides the known geometric reference required to compute the perspective transformation model. Must be physically flat and have precise, known dimensions. |
| Evaluation Metrics (MOTA, MOTP, AP) | Quantitative performance measures. | Standardized metrics from the MOTChallenge benchmarks are essential for objectively comparing different tracking algorithms and their robustness to scale and distortion [52] [55]. |
Optimizing Computational Workloads for Real-Time Analysis and High-Throughput Settings
The integration of artificial intelligence (AI) and advanced motion tracking has become a cornerstone of modern behavioral analysis research, particularly in fields requiring high-throughput data acquisition such as neuroscience and drug discovery [56] [57]. These technologies enable researchers to monitor, analyze, and interpret complex behavioral patterns with unprecedented accuracy and scale. However, the effective deployment of these systems presents a significant challenge: balancing the competing demands of high spatial-temporal resolution with the need for computational efficiency in real-time and high-throughput settings [57]. This application note provides detailed protocols and frameworks designed to optimize computational workloads, enabling robust behavioral analysis without compromising performance.
A primary compromise in behavioral quantification lies between throughput and resolution. While high-resolution video recording can capture minute behavioral details, it often proves prohibitively expensive and computationally intensive for 'omics-scale studies involving hundreds or thousands of subjects simultaneously [57]. The protocols herein address this challenge through a reductionist approach that combines efficient real-time tracking with sophisticated statistical analysis, demonstrating that complex behaviors can be characterized effectively using minimalist data streams when paired with appropriate computational frameworks [57].
Performance Benchmarks and Quantitative Analysis
The following tables summarize key performance metrics and computational characteristics for frameworks and technologies relevant to high-throughput behavioral analysis.
Table 1: Performance Comparison of Behavioral Analysis Frameworks
| Framework/Technology | Throughput Capacity | Spatial Resolution | Temporal Resolution | Key Computational Advantage |
|---|---|---|---|---|
| Coccinella Framework [57] | Hundreds to thousands of subjects | 1280 × 960 pixels | 2.2 fps (1 frame/444ms) | Real-time tracking on distributed microcomputers (e.g., Raspberry Pi) |
| High-Resolution Video Systems [57] | Limited subjects per camera | Microscopic anatomical features | 60 fps (or higher) | High-resolution post-processing analysis |
| Real-Time Video AI (Edge) [58] | Multiple simultaneous streams | 720p and higher | Latency ~857ms for object detection | Edge computing reduces cloud dependency and latency |
Table 2: Computational Load and Efficiency Metrics
| Parameter | Traditional Approach | Optimized Approach | Impact on Workload |
|---|---|---|---|
| Compounds Synthesized (e.g., for CDK7 inhibitor) [59] | Thousands | 136 compounds (~90% reduction) | Drastically reduced design-make-test cycles |
| Data Transmission to Cloud [58] | Up to 100% | ~0.5% | Massive reduction in bandwidth needs and associated latency |
| Behavioral Feature Extraction [57] | ~7,700 statistical tests (HCTSA) | Catch22 resource-lean subset | Enables high-throughput statistical learning on edge devices |
Experimental Protocol: High-Throughput Behavioral Fingerprinting
This protocol details the use of the Coccinella framework for high-throughput behavioral screening, as applied in pharmacobehavioural studies on Drosophila melanogaster [57]. The system is designed for maximal throughput using minimalist, cost-effective hardware while maintaining robust behavioral discriminability.
Materials and Equipment
Research Reagent Solutions
Table 3: Essential Materials for High-Throughput Behavioral Tracking
| Item | Specification/Function |
|---|---|
| Ethoscopes [57] | Custom-built tracking units based on Raspberry Pi microcomputer and Raspberry Pi NoIR camera. |
| Tracking Arenas [57] | Bespoke 3D-printed circular arenas (11.5 mm diameter) to host freely moving subjects. |
| Solidified Agar Substrate [57] | Provides nutrients and a medium for drug delivery (e.g., neurotropic compounds). |
| HCTSA/Catch22 [57] | Computational framework for highly comparative time-series analysis; Catch22 is a resource-lean subset. |
| Support Vector Machine (SVM) [57] | A linear SVM (SVMlinear) is used for classifying behavior based on extracted features. |
Step-by-Step Procedure
Hardware Setup and Calibration
- Assemble ethoscopes, each comprising a Raspberry Pi microcomputer and a Raspberry Pi NoIR camera overlooking a 3D-printed arena [57].
- Ensure arenas contain solidified agar with the desired treatment (e.g., nutrients alone or with dissolved drug compounds).
- Configure the ethoscope network for distributed computing, setting the software to online tracking mode. This mode processes images in real-time on the Raspberry Pi at the moment of acquisition, eliminating the need for massive video storage [57].
Subject Introduction and Data Acquisition
- Introduce one experimental subject (e.g., a single fly) into each arena.
- Initiate the experiment. Each ethoscope will track its subject in real-time, extracting a monodimensional time series representing the subject's maximal velocity over a 10-second window. This parameter has been shown to effectively differentiate key activities like walking, grooming, and feeding [57].
- The default online tracking settings typically yield a temporal resolution of one frame every 444 ± 127 ms (~2.2 fps) at a resolution of 1280 × 960 pixels [57].
Time-Series Analysis and Feature Extraction
- Collect the time-series data from all ethoscopes onto a central analysis computer.
- Process the data using the HCTSA framework or its more efficient subset, Catch22. This step subjects each time series to thousands of literature-relevant statistical tests to identify meaningful, discriminative features for behavioral classification [57].
Behavioral Classification and Validation
- Use the extracted features to train a linear support vector machine (SVM) classifier to discriminate between different behavioral states or treatment groups [57].
- Validate the model's accuracy using confusion matrices and benchmark its performance against a random classifier. In the referenced study, the system achieved 71.4% accuracy in discerning 17 different pharmacological treatments versus 5.8% for a random classifier [57].
- Confirm the biological relevance of the findings through control experiments, such as testing lower drug concentrations, which should correspondingly reduce predictive accuracy [57].
Workflow Visualization
Protocol for Real-Time AI Video Processing on Edge Architectures
This protocol outlines the implementation of a real-time video processing pipeline optimized for edge computing architectures, suitable for applications requiring immediate behavioral insights, such as live security monitoring or interactive experiments [58].
Materials and Equipment
- Edge Computing Devices: e.g., GPUs or specialized AI chips like the Intel Joule 570x module [58].
- Video Capture Devices: High-resolution cameras capable of streaming video.
- AI Models: Pre-trained models for specific tasks (e.g., object detection, motion tracking).
- Optimization Software: Frameworks supporting model deployment on edge hardware (e.g., TensorFlow Lite, OpenVINO).
Step-by-Step Procedure
System Architecture and Hardware Selection
- Design an edge computing architecture to process video streams close to the data source. This minimizes latency by reducing reliance on cloud connectivity [58].
- Select appropriate hardware with GPU acceleration to handle the computational demands of AI models. Balance cost against required processing capabilities (e.g., resolution, frames-per-second) [58].
AI Model Optimization and Integration
- Integrate AI models for tasks like object detection or motion tracking into the processing pipeline.
- Optimize models for efficiency, potentially by reducing complexity or precision (e.g., using quantization) to ensure they can run in real-time on the chosen edge hardware [58].
Pipeline Implementation and Monitoring
- Structure the data flow to minimize latency. Key stages include input handling (video capture), the AI processing pipeline (frame analysis), and output delivery (actionable insights or enhanced video) [58].
- Implement parallel processing where possible and use content delivery networks if cloud components are involved.
- Continuously monitor performance metrics (e.g., latency, accuracy) to identify bottlenecks and fine-tune the system [58].
Workflow Visualization
The integration of motion tracking technology and artificial intelligence (AI) algorithms has emerged as a transformative force in behavioral analysis research, particularly within the demanding field of drug development. These technologies enable the precise capture and quantitative analysis of subject behavior, offering objective biomarkers for assessing therapeutic efficacy and safety in preclinical and clinical studies [60] [61]. However, the performance and generalizability of the AI models that power these analyses are fundamentally constrained by the quality of the training data. This Application Note establishes a structured framework for data quality assurance, outlining protocols to ensure that motion tracking datasets are robust, reliable, and capable of producing AI models that generalize effectively to new, unseen data.
Data Acquisition and Annotation Protocols
Motion Capture System Configuration and Calibration
A meticulous setup is the foundation of high-quality data collection. The following protocol must be rigorously followed before each capture session.
Materials & Equipment:
- Motion Capture System: Optical (e.g., Vicon, OptiTrack) or inertial (e.g., Xsens) systems with appropriate camera/sensor counts [60] [62].
- Calibration Tools: L-frame, dynamic calibration wand (for optical systems).
- Controlled Environment: A space with controlled lighting and minimal reflective surfaces to reduce data noise [62].
Procedure:
- System Setup: Position cameras or sensors to ensure a clear, unobstructed view of the capture volume where all behavioral tasks will be performed [62].
- Static Calibration: Precisely measure the capture volume and define the global coordinate system. For optical systems, this involves capturing a static calibration frame to establish spatial origin and orientation.
- Dynamic Calibration: Perform a dynamic calibration using a wand moved through the entire capture volume. This allows the system to calculate the precise 3D position of each camera and lens distortion parameters, optimizing tracking accuracy [62].
- Validation: Capture a test subject performing a simple, known movement pattern (e.g., walking a measured path) to validate system accuracy. Compare the captured data to ground truth measurements.
Standardized Behavioral Task Administration
To ensure consistency and enable cross-study comparisons, behavioral tasks must be standardized.
Protocol:
- Task Design: Clearly define each behavioral paradigm (e.g., open field test, rotarod, gait analysis). The task should be designed to elicit the specific behaviors of interest relevant to the drug's mechanism of action [61].
- Subject Acclimation: Allow subjects a standardized period to acclimate to the testing environment to minimize stress-induced behavioral artifacts.
- Administration Script: Use a detailed, step-by-step script for experimenters, including exact verbal instructions, cue timing, and environmental conditions.
- Metadata Logging: Systematically record all metadata for each session, as outlined in Table 1.
Table 1: Essential Metadata for Motion Tracking Sessions
| Category | Specific Parameters | Purpose |
|---|---|---|
| Subject Information | Subject ID, demographic data (e.g., age, sex), experimental group (e.g., control, treatment). | Ensures data can be stratified and controls for biological variables. |
| Experimental Conditions | Drug dosage, time post-administration, experimenter ID. | Critical for linking behavioral changes to experimental manipulations. |
| System Parameters | Sampling rate, capture volume dimensions, software version. | Maintains consistency across sessions and aids in troubleshooting [62]. |
| Environmental Factors | Room temperature, humidity, time of day. | Controls for external factors that may influence behavior. |
Data Annotation and Labeling
Accurate labels are the target variables for supervised machine learning models.
Protocol:
- Label Definition: Establish a clear, mutually exclusive, and exhaustive set of behavioral labels (e.g., "rearing," "grooming," "ataxic gait," "freezing").
- Annotator Training: Train multiple annotators using the same guidelines and a gold-standard set of annotated videos to ensure high inter-rater reliability.
- Blinded Annotation: Where possible, annotators should be blinded to the experimental group (e.g., control vs. treatment) to prevent bias.
- Tool-Assisted Labeling: Utilize specialized software (e.g., BORIS, DeepLabCut) to facilitate efficient and precise frame-by-frame or event-based annotation.
Data Quality Assessment and Preprocessing
Quantitative Quality Metrics
Raw motion capture data must be evaluated against objective quality metrics before inclusion in a training dataset. The following workflow and metrics provide a standardized assessment.
Diagram 1: Data Quality Assessment Workflow
Table 2: Key Data Quality Metrics for Motion Tracking
| Quality Metric | Calculation Method | Acceptance Threshold | Corrective Action if Failed |
|---|---|---|---|
| Data Completeness | Percentage of frames with all required markers/sensors tracked. | > 95% per trial. | Review for persistent occlusions; re-run trial if necessary [62]. |
| Signal-to-Noise Ratio (SNR) | Ratio of power in movement signal to power in noise (e.g., from jitter). | > 20 dB (subject to movement type). | Check calibration; apply low-pass filtering during processing [62]. |
| Marker Swaps | Incorrect identification of similar-looking markers. | 0 occurrences. | Review trajectory auto-labeling; manually correct swaps. |
| Gap Length | Consecutive frames with a missing marker. | < 10 frames. | Use spline interpolation or gap-filling algorithms. |
Preprocessing and Feature Engineering Pipeline
Raw kinematic data must be cleaned and transformed into meaningful features for AI models.
Protocol:
- Data Filtering: Apply a low-pass filter (e.g., a 4th-order Butterworth filter with a cutoff of 10-15 Hz) to remove high-frequency noise while preserving biological movement signals [62].
- Gap Filling: Use interpolation methods (e.g., spline interpolation) to fill short gaps of missing data identified in the quality assessment.
- Feature Extraction: Calculate a comprehensive set of features from the processed data. These can be categorized as:
- Spatiotemporal: Gait speed, stride length, cadence, movement trajectory.
- Kinematic: Joint angles, angular velocities, range of motion.
- Dynamic: Acceleration, jerk (rate of change of acceleration), which can be indicative of movement smoothness or deficits.
- Data Normalization: Normalize features to account for inter-subject variability (e.g., z-score normalization, scaling by subject height).
Ensuring Model Generalization
Dataset Curation and Partitioning
The strategy for splitting data into training, validation, and test sets is critical for assessing true model generalization.
Protocol:
- Subject-Based Splitting: Ensure that all data from a single subject resides in only one of the sets (training, validation, or test). This prevents the model from memorizing subject-specific idiosyncrasies and falsely appearing to perform well.
- Stratified Sampling: Maintain the distribution of key variables (e.g., experimental group, sex) across all splits to prevent bias.
- External Test Set: Reserve a portion of the data, ideally collected under slightly different conditions (e.g., different experimenter, different batch of animals) or from a different site, as a final, untouched test set. This provides the best estimate of real-world performance.
AI Model Training and Validation Strategy
A rigorous training protocol mitigates overfitting, where a model performs well on training data but fails on new data.
Diagram 2: Model Training and Validation Loop
Protocol:
- Algorithm Selection: Choose appropriate AI/ML models. For sequence data (like gait), Recurrent Neural Networks (RNNs) or Long Short-Term Memory (LSTM) networks are often suitable. For spatial data, Convolutional Neural Networks (CNNs) can be effective [63] [61].
- Hyperparameter Tuning: Systematically tune hyperparameters (e.g., learning rate, network depth) using the validation set, not the test set.
- Overfitting Countermeasures: Implement techniques such as dropout and L1/L2 regularization to discourage the model from becoming overly complex and reliant on noise in the training data [63].
- Performance Monitoring: Continuously monitor performance on the validation set during training. A growing gap between training and validation performance is a key indicator of overfitting.
The Scientist's Toolkit: Research Reagents & Solutions
Table 3: Essential Tools for Motion-Based Behavioral Analysis
| Item | Specification / Example | Primary Function in Research |
|---|---|---|
| High-Fidelity Motion Capture System | Vicon, OptiTrack, Xsens [60] | Precise, multi-dimensional capture of subject movement kinematics. |
| Data Annotation Software | BORIS, DeepLabCut | Facilitates manual or AI-assisted labeling of behavioral states from video data. |
| Machine Learning Framework | TensorFlow, PyTorch, Scikit-learn [63] | Provides libraries for building, training, and validating AI/ML models. |
| Computational Hardware (GPU) | NVIDIA GPUs | Accelerates the training of complex deep learning models [63]. |
| Behavioral Testing Apparatus | Open Field, Rotarod, Elevated Plus Maze | Standardized environments to elicit and measure specific behavioral phenotypes. |
| Data Processing Pipeline | Custom scripts in Python or MATLAB | Automates data filtering, feature extraction, and quality checks. |
Benchmarking Performance: Metrics, Validation Frameworks, and Algorithm Selection
The validation of multi-object tracking (MOT) algorithms is foundational to generating reliable data in behavioral analysis research. This document provides application notes and experimental protocols for four standardized metrics—HOTA (Higher Order Tracking Accuracy), DetA (Detection Accuracy), AssA (Association Accuracy), and IDF1 (ID F1 Score)—which are critical for benchmarking tracking performance in motion analysis and AI-driven behavioral phenotyping. We present structured comparisons, detailed evaluation methodologies, and implementation workflows to enable researchers in neuroscience and drug development to quantitatively assess the accuracy and robustness of tracking algorithms.
In behavioral analysis research, accurate motion tracking of subjects is a prerequisite for quantifying movement patterns, social interactions, and pharmacological responses. Multi-object tracking evaluation has been notoriously difficult because the task inherently requires accurate detection, localization, and association of objects over time [64]. Historically, metrics overemphasized one aspect at the expense of others; for instance, MOTA (Multiple Object Tracking Accuracy) overemphasizes detection, while IDF1 overemphasizes association [65] [64]. The HOTA metric was developed to explicitly balance these aspects, providing a unified score that decomposes into DetA and AssA for granular analysis [64] [66]. This balanced evaluation is crucial for ensuring that tracking algorithms used in behavioral research produce valid and reproducible results that can reliably inform scientific conclusions and drug development efforts.
Metric Definitions and Quantitative Comparison
Core Metric Definitions
| Metric | Full Name | Core Evaluation Focus | Mathematical Formula | ||||||||||
|---|---|---|---|---|---|---|---|---|---|---|---|---|---|
| HOTA | Higher Order Tracking Accuracy | Balanced measurement of detection and association performance. | ( \text{HOTA}{\alpha} = \sqrt{\text{DetA}{\alpha} \cdot \text{AssA}{\alpha}} )Final HOTA: ( \text{HOTA} = \int{0}^{1} \text{HOTA}{\alpha} d\alpha \approx \frac{1}{19} \sum{\alpha \in {\begin{smallmatrix}0.05, & 0.1,..., & 0.9, 0.95\end{smallmatrix}}} \text{HOTA}_{\alpha} ) [67] | ||||||||||
| DetA | Detection Accuracy | Accuracy of object detection in each frame. | ( \text{DetA}_{\alpha} = \frac{ | TP | }{ | TP | + | FN | + | FP | } ) [65] [67] | ||
| AssA | Association Accuracy | Accuracy of maintaining object identities over time. | ( \text{AssA}_{\alpha} = \frac{1}{ | TP | } \sum_{c \in {\text{TP}}} \text{A}(c) )where ( A(c) = \frac{ | TPA(c) | }{ | TPA(c) | + | FNA(c) | + | FPA(c) | } ) [65] [67] |
| IDF1 | ID F1 Score | Correspondence between predicted and ground-truth trajectories. | ( \text{IDF1} = \frac{2 \cdot \text{IDTP}}{2 \cdot \text{IDTP} + \text{IDFP} + \text{IDFN}} ) [65] |
Comparative Analysis of Metric Properties
Table: Property comparison of key tracking metrics [65] [64].
| Property | HOTA | MOTA | IDF1 |
|---|---|---|---|
| Balances Detection & Association | Yes (Explicitly and evenly) | No (Heavily weights detection) | No (Heavily weights association) |
| Measures Localization Accuracy | Yes (Via LocA and integration over α) | No (Uses fixed IoU threshold) | No (Uses fixed IoU threshold) |
| Evaluation Scope | Global and Local | Primarily local (frame-by-frame) | Global (entire video sequence) |
| Suitable for Online Tracking | Limited (Requires future frames for optimal AssA) | Yes (Frame-by-frame calculation) | No (Requires global track matching) |
| Penalizes Fragmentation | No | Yes (Counts identity switches) | Implicitly |
| Human Alignment | High (Closer to human visual evaluation) | Low | Moderate |
Experimental Protocols for Metric Implementation
Prerequisites and Data Preparation
Research Reagent Solutions:
- Ground Truth Data: Annotated video sequences with precise bounding boxes and unique identity tags for all objects across all frames. Format:
<frame_id> <object_id> <bbox_x> <bbox_y> <bbox_w> <bbox_h>[68]. - Tracking Algorithm Output: Predictions from the tracker in the same format as ground truth.
- Evaluation Toolkit: Software libraries such as TrackEval [65] [64] or SportsLabKit [67] that implement HOTA, DetA, AssA, and IDF1.
- Computing Environment: Standard laboratory computing hardware is typically sufficient. GPU acceleration is not required for metric computation itself.
Protocol 1: Comprehensive HOTA Evaluation
This protocol measures overall tracking performance, balancing detection and association.
- Input: Load ground truth (GT) and predicted tracking (PR) data for the entire sequence.
- Initialization: Define the set of 19 Localization Thresholds (α): from 0.05 to 0.95 in 0.05 increments [67].
- Primary Matching: For each frame and each α, execute the Hungarian algorithm to match GT and PR detections based on Intersection-over-Union (IoU), where a match is valid if IoU ≥ α. This yields sets of True Positives (TP), False Negatives (FN), and False Positives (FP) for each α [65] [69].
- Association Calculation: For each TP detection
cfound in step 3: a. Identify its global GT identity (gtID) and PR identity (prID). b. TPA(c): Count all TPs across the entire video that have the samegtIDandprIDasc. c. FNA(c): Count all GT detections with the samegtIDascthat were either not matched (FN) or matched to a differentprID. d. FPA(c): Count all PR detections with the sameprIDascthat were either not matched (FP) or matched to a differentgtID. e. Compute the association score for that TP:A(c) = |TPA(c)| / (|TPA(c)| + |FNA(c)| + |FPA(c)|)[65] [67]. - Metric Computation per α:
- ( \text{DetA}{\alpha} = |\text{TP}| / (|\text{TP}| + |\text{FN}| + |\text{FP}|) )
- ( \text{AssA}{\alpha} = \frac{1}{ | TP | } \sum{c \in {\text{TP}}} A(c) )
- ( \text{HOTA}{\alpha} = \sqrt{ \text{DetA}{\alpha} \cdot \text{AssA}{\alpha} } )
- Integration: Compute the final HOTA, DetA, and AssA scores by averaging the results over all 19 α values [67].
- Output: Report final HOTA, DetA, and AssA scores. Analyze the trade-off by plotting DetA vs. AssA [69].
Protocol 2: IDF1 Evaluation
This protocol focuses on the long-term consistency of identity assignment.
- Input: Load GT and PR data for the entire sequence.
- Global Track Matching: Execute the Hungarian algorithm to match entire GT trajectories to entire PR trajectories, maximizing the IDF1 score. A match is based on the number of overlapping detections (spatial overlap above a set IoU threshold, e.g., 0.5) between each GT track and PR track [65].
- Count Identity Measures:
- IDTP: The total number of detections in correctly matched GT-PR track pairs.
- IDFP: The total number of detections in PR tracks that are not matched to any GT track.
- IDFN: The total number of detections in GT tracks that are not matched to any PR track.
- Calculation: Compute ( \text{IDF1} = \frac{2 \times \text{IDTP}}{2 \times \text{IDTP} + \text{IDFP} + \text{IDFN}} ) [65].
- Output: Report the final IDF1 score.
Workflow Visualization
HOTA Evaluation Workflow
IDF1 Evaluation Workflow
Application in Behavioral Analysis Research
Interpreting Results for Behavioral Studies
Understanding the practical meaning of these metrics is vital for contextualizing behavioral data:
- A high DetA but low AssA indicates that a tracker detects most animals/subjects in every frame but frequently swaps their identities. This is catastrophic for analyzing individual-specific behaviors like grooming, nesting, or feeding.
- A high AssA but low DetA indicates that once an object is tracked, its identity is stable, but the tracker misses many subjects entirely. This is problematic for analyzing group-level dynamics like social proximity or collective movement.
- HOTA balances these aspects; a high HOTA score gives confidence that both the presence and the unique identity of subjects are correctly tracked, ensuring the validity of downstream behavioral metrics.
- IDF1 is particularly important for studies that require following specific individuals over long durations, such as in longitudinal pharmacological studies or social hierarchy experiments [70].
Example Benchmark Results
Table: Example tracking metric scores from a multi-camera evaluation (NVIDIA MDX) [68].
| System Version | HOTA | DetA | AssA | MOTA | IDF1 |
|---|---|---|---|---|---|
| v1.0 | 48.0% | 57.9% | 39.7% | 78.6% | 71.9% |
| v2.0/2.1 | 62.9% | 64.8% | 61.1% | 83.3% | 88.2% |
This benchmark demonstrates how HOTA and its sub-metrics provide a comprehensive view of tracker improvement across versions, with gains in both detection (DetA) and association (AssA).
The Scientist's Toolkit
Table: Essential components for tracking validation in a research setting.
| Tool / Reagent | Function in Validation | Example/Note |
|---|---|---|
| TrackEval | Reference software library for computing MOT metrics. | Implements HOTA, MOTA, IDF1, etc. [65] [64] |
| SportsLabKit | Python toolkit for sports analysis, includes metric implementations. | Provides hota_score and mota_score functions [67] |
| Hungarian Algorithm | Core algorithm for optimal bipartite matching of detections/tracks. | Used in both frame-by-frame (MOTA) and global (IDF1, HOTA) matching [65] |
| Ground Truth Annotations | The benchmark dataset with precise bounding boxes and IDs. | Format: <frame_id> <object_id> <bbox...> [68] |
| IoU / Loc-IoU | Measure of spatial alignment between predicted and GT bounding boxes. | Fundamental for determining True Positives [69] |
Comparative Analysis of Algorithm Performance on Biomedical Benchmarks (e.g., DanceTrack)
Within the realm of behavioral analysis research, precise motion tracking is paramount for quantifying phenotypes, assessing responses to pharmacological interventions, and understanding neural circuit functions. Traditional multi-object tracking (MOT) paradigms often rely on distinct object appearance for re-identification, a assumption that frequently breaks down in biomedical settings where experimental subjects, such as laboratory animals or human participants in clinical trials, often exhibit uniform appearance. The DanceTrack benchmark, a dataset designed for multi-human tracking in uniform appearance and diverse motion, directly addresses this limitation by providing a platform where objects have similar appearance and exhibit dynamic, non-linear movements [71] [72]. This dataset challenges the core association mechanisms of tracking algorithms, making it an exceptionally relevant tool for validating MOT methods intended for behavioral analysis where subject disguise, uniform housing conditions, or complex, naturalistic movements are the norm [73]. This application note provides a comparative analysis of contemporary tracking algorithms on DanceTrack, detailing their performance and providing standardized protocols for their evaluation in a research context.
DanceTrack is a large-scale dataset specifically designed to stress test the association capabilities of multi-object tracking algorithms by minimizing the utility of appearance cues and emphasizing motion analysis. Its composition is summarized in Table 1.
Table 1: Composition of the DanceTrack Dataset
| Property | Value |
|---|---|
| Total Videos | 100 |
| Training Set | 40 videos |
| Validation Set | 25 videos |
| Test Set | 35 videos |
| Unique Human Instances | 990 |
| Average Video Length | 52.9 seconds |
| Total Frames | 105,000 |
| Annotated Bounding Boxes | 877,000 |
| Frame Rate | 20 FPS [71] [73] |
The key features that make DanceTrack particularly suitable for biomedical behavioral research include:
- Uniform Appearance: Individuals in scenes often wear similar clothing, eliminating bright colors or distinct patterns as reliable features for identification. This directly parallels research involving genetically identical model organisms or human participants in uniform attire [71] [73].
- Diverse Motion and Extreme Articulation: Subjects undergo complex, non-linear movements, rapid direction changes, and aggressive deformation, mimicking naturalistic behaviors, seizure activity, or gait disturbances that are of high interest in neuroscience and drug development [71] [72].
- Varied Environmental Conditions: The dataset includes outdoor scenes, low-lighting scenarios, and large groups, providing a robust test for real-world laboratory or clinical environments with challenging imaging conditions [71].
The core challenge presented by DanceTrack is the shift in bottleneck from detection to association. While detection accuracy (DetA) is relatively high due to clear targets, tracking association metrics (AssA) see a significant drop, highlighting the failure of appearance-based re-identification and the need for robust motion predictors [71].
Quantitative Performance Analysis of Tracking Algorithms
Benchmarking results on DanceTrack reveal significant performance variations across state-of-the-art trackers, underscoring their differing capabilities in handling appearance ambiguity. The following table summarizes key metrics for several prominent algorithms.
Table 2: Algorithm Performance Comparison on DanceTrack
| Tracker | HOTA | DetA | AssA | MOTA | IDF1 | Primary Association Strategy |
|---|---|---|---|---|---|---|
| ETTrack | 56.4 | - | - | - | - | Enhanced Temporal Motion Predictor (Transformer + TCN) [74] |
| ByteTrack | 47.1 | 70.5 | 31.5 | 88.2 | 51.9 | Kalman Filter with BYTE association [73] |
| OC-SORT | - | - | - | - | - | Observation-Centric Kalman Filter [74] |
| TrackTrack | State-of-the-art on MOT17/MOT20 | - | - | - | - | YOLOX, FastReID, Kalman Filter [75] |
Key Performance Interpretations:
- HOTA (Higher Order Tracking Accuracy): This is the primary metric for a balanced tracking evaluation, combining detection and association accuracy. ETTrack's superior HOTA score of 56.4 demonstrates the effectiveness of its deep-learning-based motion prediction in complex, non-linear scenarios common in behavioral studies [74].
- AssA (Association Accuracy): This metric directly measures the ability to maintain correct identity associations. The low AssA of ByteTrack (31.5) compared to its high DetA (70.5) clearly illustrates the challenge DanceTrack poses for association, even with a strong detector [73].
- Algorithm Evolution: The progression from Kalman Filter-based methods (e.g., ByteTrack) to more sophisticated motion models (e.g., ETTrack) marks a critical evolution in tracker design, driven by the need to model complex motion patterns rather than relying on simple linear motion assumptions [74].
Experimental Protocols for Benchmarking
To ensure reproducible and standardized evaluation of multi-object tracking algorithms for behavioral analysis, the following protocols are recommended.
Dataset Acquisition and Preparation
- Access: The DanceTrack dataset, including annotations, is available for non-commercial research purposes from the official project page (dancetrack.github.io) or its GitHub repository [71] [76].
- Structure: Organize the dataset as per the standard directory structure. The annotations for training and validation sets (40 and 25 videos, respectively) are public, while test set annotations are withheld for official benchmarking [76].
Algorithm Training and Execution
- Model Selection: Choose a tracker implementation (e.g., ETTrack, ByteTrack). Pre-trained models are often available on platforms like Hugging Face [76] [74].
- Training (If applicable): For joint-training with other datasets (e.g., COCO) to predict additional features like mask or pose, follow the specific instructions provided with the codebase, leveraging scripts and configurations designed for DanceTrack [76].
- Inference: Run the tracker on the DanceTrack validation or test set. The output should be generated in the standard MOT challenge format [73].
Evaluation and Visualization
- Output Formatting: Ensure your tracker's output is saved as one
.txtfile per video sequence in the following format, with each line representing a detection:<frame>, <id>, <bb_left>, <bb_top>, <bb_width>, <bb_height>, <conf>, -1, -1, -1[73]. Organize these files in a tracker-specific folder. - Running Evaluation: Use the official
TrackEvalscripts to compute metrics. A sample command is below [73]: - Result Visualization: To qualitatively assess performance, generate video overlays of the tracking results using provided utility scripts [76] [73]:
Workflow Visualization for Multi-Object Tracking in Behavioral Analysis
The following diagram illustrates the standard tracking-by-detection pipeline and the role of advanced motion predictors in the context of behavioral analysis.
Figure 1: Multi-Object Tracking Pipeline for Behavioral Analysis.
The Scientist's Toolkit: Essential Research Reagents and Computational Tools
For researchers implementing these tracking protocols, the following tools and "reagents" are essential.
Table 3: Essential Research Reagents and Computational Tools
| Item Name | Function/Application | Specifications/Alternatives |
|---|---|---|
| DanceTrack Dataset | Benchmarking MOT algorithms under uniform appearance and diverse motion. | 100 videos, 105k frames. Licenced for non-commercial research [71] [76]. |
| ETTrack Model | An enhanced temporal motion predictor for non-linear motion. | Integrates Temporal Transformer and TCN. Achieves 56.4% HOTA on DanceTrack [74]. |
| ByteTrack | A strong baseline tracker for the tracking-by-detection paradigm. | Uses YOLOX detection and Kalman Filter. Source code and models publicly available [76] [73]. |
| TrackEval Library | Standardized evaluation of tracking results. | Computes HOTA, MOTA, AssA, IDF1, and other metrics [73]. |
| YOLOX Detector | Provides high-quality initial object detection. | Often used as the first stage in tracking pipelines like TrackTrack [75]. |
| FastReID | Extracts appearance features for association. | Used in pipelines where appearance cues, though weak, can still be leveraged [75]. |
Evaluating Robustness and Accuracy Under Real-World Experimental Conditions
Robustness and accuracy evaluation is critical for deploying reliable motion tracking and AI algorithms in behavioral analysis research. For researchers in drug development and preclinical studies, ensuring that these systems perform consistently under real-world experimental conditions—outside controlled laboratory environments—is paramount for generating valid, reproducible scientific data. These evaluations must address numerous challenges including environmental variations, equipment limitations, and natural biological variability in subject behavior.
Motion tracking systems form the foundation of modern behavioral analysis, but their performance can be compromised by factors such as lighting changes, occlusions, and sensor noise. Without rigorous robustness evaluation, algorithmic failures can lead to inaccurate behavioral interpretations, potentially compromising experimental conclusions and drug efficacy assessments. This document provides comprehensive application notes and protocols for systematically evaluating robustness and accuracy to ensure research quality and reliability.
Quantitative Performance Metrics for Motion Tracking Systems
Core Performance Metrics
| Metric Category | Specific Metrics | Definition/Calculation | Ideal Value | Evaluation Context |
|---|---|---|---|---|
| Tracking Accuracy | Multiple Object Tracking Accuracy (MOTA) | Measures overall tracking precision considering false positives, false negatives, identity switches [19] | Higher (Max 1) | Multi-animal tracking, social behavior |
| Identity F1 Score (IDF1) | Balances identification precision and recall [19] | Higher (Max 1) | Long-term behavioral studies | |
| Higher Order Tracking Accuracy (HOTA) | Assesses localization, detection, and association accuracy [19] | Higher (Max 1) | Complex movement patterns | |
| Robustness Indicators | Performance Degradation Tolerance | Maximum allowable performance drop under specified conditions [77] | Application-dependent | All experimental conditions |
| Uncertainty Quantification | Confidence estimates for model predictions [77] | Well-calibrated | Safety-critical applications | |
| Out-of-Distribution Detection | Ability to identify inputs differing from training data [77] | High precision/recall | Novel environmental conditions | |
| Behavioral Specificity | Ethological Behavior Recognition | Accuracy in identifying domain-specific behaviors [78] | Matches human annotation | Species-specific behavioral assays |
Algorithm Performance Comparison
| Algorithm | MOTA | IDF1 | HOTA | Key Innovations | Best Application Context |
|---|---|---|---|---|---|
| ByteTrack [19] [79] | High | High | Medium | Uses all detection boxes (high and low scores) | Multi-object tracking in crowded environments |
| BoT-SORT [19] | High | High | High | Camera motion compensation, improved Kalman filter | Dynamic environments with camera movement |
| StrongSORT [19] [79] | High | Very High | High | Appearance-Free Link (AFLink), Gaussian-smoothed Interpolation (GSI) | Long-term tracking with frequent occlusions |
| DeepSORT [19] | Medium | High | Medium | Kalman filtering, deep learning feature extractor | General-purpose multi-object tracking |
| FairMOT [19] | Medium | Medium | Medium | Equal treatment of detection and re-identification | Real-time applications with balanced needs |
| OC-SORT [79] | High | High | High | Observation-centric recovery, improved occlusion handling | Scenes with persistent occlusions |
Sensor Fusion Algorithms for Robust Motion Tracking
Algorithm Comparison and Selection Guidelines
| Algorithm | System Dynamics | Computational Requirements | Accuracy Level | Implementation Complexity | Best Use Cases |
|---|---|---|---|---|---|
| Kalman Filter (KF) [80] | Linear | Low | Medium-High | Low | Basic inertial navigation, simple trajectory prediction |
| Extended Kalman Filter (EKF) [80] | Nonlinear | Medium | High | Medium | IMU-based orientation estimation, robotics |
| Unscented Kalman Filter (UKF) [80] | Highly Nonlinear | High | Very High | High | Autonomous vehicle pose tracking, complex sensor fusion |
| Complementary Filter [80] | Linear/Nonlinear | Very Low | Medium | Very Low | Camera gimbal stabilization, basic orientation estimation |
| Gradient Descent [80] | Nonlinear | High | High | High | Pose refinement, complex optimization problems |
Real-World Performance Degradation Factors
| Factor Category | Specific Challenges | Impact on Accuracy | Effect on Robustness |
|---|---|---|---|
| Environmental Conditions | Lighting changes [19] | Alters object appearance, reduces detection confidence | Decreases performance in varying illumination |
| Magnetic disturbances [80] | Disorients magnetometer-based heading estimation | Compromises orientation accuracy in indoor environments | |
| Weather conditions (outdoor) | Obscures visual features, introduces noise | Reduces reliability of vision-based systems | |
| Technical Limitations | Occlusion [19] [78] | Causes tracking dropouts, identity switches | Requires robust re-identification algorithms |
| Sensor drift [80] | Introduces accumulating error in orientation | Necessitates sensor fusion for correction | |
| Computational latency | Delays real-time processing | Impacts time-sensitive applications | |
| Data Quality Issues | Variable appearance [19] | Challenges consistent feature extraction | Requires invariant feature learning |
| Multi-camera coordination [19] | Introduces calibration inconsistencies | Complicates cross-view tracking | |
| Scale variations | Affects object detection reliability | Challenges size-invariant modeling |
Experimental Protocols for Robustness Evaluation
Protocol 1: Controlled Corruption Testing for ODT-based Classifiers
Application Context: This protocol adapts robustness evaluation methods from Optical Diffraction Tomography (ODT) to motion tracking systems, particularly for behavioral analysis in pharmaceutical research [81].
Materials and Equipment:
- High-speed video cameras (minimum 120fps capability)
- Standardized behavioral arena with controlled lighting
- Data augmentation workstation (GPU-enabled)
- Reference subjects with known behavioral profiles
Methodology:
- Dataset Preparation:
Controlled Corruption Application:
- Apply sensor-related noise: Gaussian, Poisson, and Speckle noise patterns
- Introduce reconstruction artifacts: phase wrapping, missing cone artifacts
- Implement environmental distortions: motion blur, occlusion simulation, lighting variations
Augmentation Strategy Implementation:
- Implement CutPix augmentation: fractal pattern mixing with cut-and-concatenate approach [81]
- Balance shape and texture information in training data
- Train models on both clean and augmented datasets
Performance Assessment:
- Measure accuracy degradation across corruption types
- Calculate robustness score as performance retention percentage
- Compare augmented vs. non-augmented model performance
Validation Metrics:
- Corruption Error Rate (CER)
- Mean Performance Retention (MPR)
- Relative Robustness Index (RRI)
Protocol 2: Multi-Algorithm Performance Benchmarking
Application Context: Systematic comparison of tracking algorithms against human-annotated ground truth for preclinical behavioral assessment [78].
Materials and Equipment:
- Multiple camera setup (minimum 3 angles)
- Synchronization equipment
- Commercial tracking software (EthoVision, TSE Systems)
- Deep learning platforms (DeepLabCut, MMTracking)
- Computational resources for algorithm deployment
Methodology:
- Reference Dataset Creation:
- Record standardized behavioral tests: Open Field, Elevated Plus Maze, Forced Swim Test [78]
- Employ multiple human annotators (minimum 3) for ground truth establishment
- Resolve annotation discrepancies through consensus meetings
Algorithm Implementation:
Comprehensive Evaluation:
- Test all systems on identical video sequences
- Evaluate both basic tracking (position, velocity) and ethological behaviors (rearing, head-dipping)
- Assess performance under challenging conditions: occlusion, low contrast, rapid movement
Statistical Analysis:
- Calculate inter-rater reliability between algorithms and human annotators
- Perform ANOVA with post-hoc tests for performance comparisons
- Compute correlation coefficients for continuous measures
Validation Metrics:
- Inter-Algorithm Consistency Score
- Human-Algorithm Concordance
- Failure Mode Frequency Analysis
Protocol 3: Real-World Stress Testing
Application Context: Evaluating performance boundaries and failure modes under extreme but plausible operating conditions.
Materials and Equipment:
- Environmental control system (lighting, temperature, humidity)
- Variable surface materials
- Dynamic obstacle setup
- Wireless data acquisition systems
Methodology:
- Environmental Stress Tests:
- Lighting transitions: sudden brightness changes, directional shadows
- Background complexity: introducing distracting elements
- Surface variations: different textures, colors, patterns
Subject-Based Challenges:
- Multiple subject interactions: social behavior scenarios
- Partial and complete occlusion events
- Rapid movement sequences: startle responses, chasing behavior
System Limitations Testing:
- Reduced frame rate simulations
- Resolution degradation testing
- Computational resource constraints
Performance Boundary Mapping:
- Identify failure thresholds for each parameter
- Document characteristic failure modes
- Develop performance degradation profiles
Validation Metrics:
- Failure Point Identification
- Graceful Degradation Assessment
- Recovery Time Measurement
Visualization of Experimental Workflows
Robustness Evaluation Protocol
Robustness Evaluation Workflow - This diagram illustrates the systematic process for evaluating motion tracking system robustness under real-world conditions.
Sensor Fusion Architecture
Sensor Fusion Architecture - This diagram shows how multiple sensor inputs are combined to produce robust motion estimates.
The Researcher's Toolkit
Essential Research Reagents and Solutions
| Tool Category | Specific Tools/Platforms | Function/Purpose | Implementation Considerations |
|---|---|---|---|
| Open-Source Tracking | DeepLabCut [78] | Markerless pose estimation using transfer learning | Requires 10-20 labeled frames per video; trains in ~250,000 iterations |
| MMTracking [19] | Modular video analysis toolbox | Integrates with MMDetection; supports object detection and tracking | |
| ByteTrack [19] [79] | Multi-object tracking using all detection boxes | Effectively handles occlusions by leveraging low-score detections | |
| Commercial Systems | EthoVision XT14 [78] | Automated video tracking system | Limited ethological behavior recognition; suboptimal tracking in complex environments |
| TSE Multi-Conditioning [78] | Integrated hardware-software solution | Uses infrared beam grids; confined to specific laboratory setups | |
| Evaluation Frameworks | Adversarial Robustness Toolbox [82] | Security and robustness evaluation toolkit | Tests against evasion, poisoning, and model extraction attacks |
| Robustness Metrics [82] | Performance evaluation under corruption | Benchmarks model resilience to input perturbations | |
| Specialized Algorithms | BoT-SORT [19] | Multi-object tracking with camera compensation | Handles camera movement; improves bounding box prediction |
| StrongSORT [19] [79] | Advanced appearance-based tracking | Implements AFLink and GSI for improved identity preservation |
Robustness Assessment Tools
| Assessment Method | Implementation Tools | Application Context | Key Metrics |
|---|---|---|---|
| Red Teaming [82] | IBM Adversarial Robustness Toolbox, Microsoft PyRIT | Proactive vulnerability discovery | Attack success rate, performance degradation |
| Privacy Audits [82] | Likelihood Ratio Attack (LiRA) frameworks | Membership inference testing | Data leakage quantification, privacy risk score |
| Corruption Testing [81] | Custom corruption pipelines, CutPix augmentation | Real-world noise simulation | Corruption Error Rate, robustness retention |
| Cross-Validation [78] | DeepLabCut Analyzer, custom R/Python scripts | Algorithm performance validation | Inter-rater reliability, human-algorithm concordance |
Validation Frameworks for Regulatory Compliance and Clinical Adoption
The integration of artificial intelligence (AI) and motion tracking technologies for behavioral analysis represents a transformative advancement in biomedical research and therapeutic development. These technologies enable unprecedented precision in quantifying movement behaviors, offering objective biomarkers for disease progression and treatment efficacy. However, their path to regulatory acceptance and widespread clinical adoption requires robust validation frameworks that demonstrate technical reliability, clinical utility, and regulatory compliance.
Current regulatory landscapes are evolving rapidly, with frameworks from the U.S. Food and Drug Administration (FDA) and European Medicines Agency (EMA) establishing expectations for AI-enabled tools [83] [84]. For behavioral analysis technologies, particularly those employing markerless motion capture, validation must address both the algorithmic performance and clinical relevance of the derived biomarkers. This document outlines comprehensive protocols and application notes to guide researchers through the validation process, from technical verification to regulatory submission.
Regulatory Landscape for AI-Enabled Behavioral Tools
Key Regulatory Frameworks and Requirements
Regulatory approaches to AI in healthcare differ significantly between major jurisdictions, creating a complex compliance landscape for technologies intended for global deployment.
Table: Comparative Regulatory Approaches for AI in Healthcare
| Jurisdiction | Governing Body | Primary Framework | Risk Classification | Key Requirements |
|---|---|---|---|---|
| United States | FDA | "Considerations for the Use of AI to Support Regulatory Decision-Making for Drug and Biological Products" (2025) [83] | Risk-based approach | Algorithm validation, Data transparency, Performance monitoring |
| European Union | EMA | EU AI Act (2025 implementation) [85] | High-risk (most healthcare AI) | Data governance, Technical documentation, Human oversight, Cybersecurity |
| United Kingdom | MHRA | Sector-specific framework [85] | Adaptive risk classification | Transparency, Accountability, Clinical validation |
The FDA has established the CDER AI Council to provide oversight and coordination of AI activities, reflecting the growing importance of these technologies in drug development [84]. The agency has reviewed over 500 submissions with AI components from 2016-2023, establishing substantial experience with these technologies [84].
For behavioral analysis technologies, regulators particularly emphasize:
- Transparency and explainability of AI algorithms, especially for "black box" systems [86]
- Robustness against bias ensured through diverse training datasets [86]
- Human oversight mechanisms to prevent over-reliance on automated systems [85]
- Cybersecurity protections for patient data throughout the system lifecycle [85]
Technical Validation Framework for Motion Tracking Systems
Performance Metrics and Benchmarking Protocols
Technical validation establishes the foundational accuracy and reliability of motion tracking systems before clinical validation. The following protocols outline standardized methodologies for system verification.
Table: Technical Validation Metrics for AI-Based Motion Tracking Systems
| Validation Domain | Key Metrics | Acceptance Criteria | Reference Method |
|---|---|---|---|
| Spatiotemporal Accuracy | Stride length, Gait velocity, Cadence | ICC > 0.9, Bias < 2% [87] | Marker-based motion capture [87] |
| Joint Kinematics | Range of motion, Angular velocity, Trajectory smoothness | ICC > 0.85 [87] | 3D marker-based systems with force plates [87] |
| Cross-population Reliability | Performance consistency across age, disease severity | No significant degradation in metrics [87] | Stratified analysis by subgroup [87] |
| Algorithmic Robustness | Consistency across lighting, clothing, camera angles | < 5% performance variation [88] | Controlled environmental manipulation |
Experimental Protocol: Validation Against Gold Standard Systems
Purpose: To validate markerless motion capture system performance against established gold-standard methods.
Materials:
- Markerless system (commercial or research platform, e.g., KinaTrax, DeepLabCut)
- Reference system (marker-based motion capture, e.g., Vicon, BTS SMART-DX)
- Synchronization device
- Standardized clinical assessment area
Procedure:
- System Setup: Position both systems to capture the same movement volume with overlapping fields of view.
- Synchronization: Temporally synchronize systems using a shared trigger or synchronization pulse.
- Participant Preparation: Recruit representative cohorts (healthy controls, target patient population).
- Data Collection: Capture participants performing standardized movements and activities of daily living.
- Data Processing: Extract comparable kinematic parameters from both systems.
- Statistical Analysis: Compute intraclass correlation coefficients (ICC), Bland-Altman limits of agreement, and concordance metrics.
A recent study validating the KinaTrax system demonstrated excellent agreement (ICC > 0.9) for most spatiotemporal parameters compared to marker-based tracking, with particularly strong performance for spatial parameters like stride length [87]. Heel-strike and toe-off timing showed greater variability, emphasizing the importance of validating temporal parameters specific to each system [87].
Figure 1: Technical validation workflow for motion tracking systems
Clinical Validation Protocols for Behavioral Biomarkers
Establishing Clinical Relevance and Predictive Value
Clinical validation translates technical accuracy into meaningful biomarkers that reflect disease status, progression, or treatment response. The following protocol outlines a comprehensive approach for establishing clinical validity.
Purpose: To demonstrate that motion tracking biomarkers correlate with clinically relevant endpoints and can predict disease progression or treatment response.
Experimental Design:
- Study Type: Longitudinal observational study or clinical trial substudy
- Duration: Minimum 12 months for progressive disorders [14]
- Participants: Target patient population + age-matched healthy controls
- Assessments: Concurrent motion analysis and standard clinical scales
Procedure:
- Baseline Characterization: Perform comprehensive movement behavior assessment using motion tracking during standardized tasks and activities of daily living.
- Clinical Assessment: Administer validated clinical scales (e.g., MDS-UPDRS for Parkinson's, NSAA for Duchenne Muscular Dystrophy).
- Longitudinal Monitoring: Conduct repeated assessments at predetermined intervals (e.g., 3, 6, 12 months).
- Data Analysis:
- Define movement behavioral fingerprints that distinguish patients from controls
- Establish cross-sectional correlations with clinical scales
- Develop machine learning models to predict disease trajectory
- Validate predictive models against external datasets
In Duchenne muscular dystrophy, researchers used wearable sensor suits to collect whole-body movement data during everyday activities over 12 months [14]. By defining movement behavioral fingerprints and applying Gaussian process regression, they developed the KineDMD ethomic biomarker that predicted disease progression more accurately than standard clinical assessments [14].
Protocol for Behavioral Fingerprint Definition
Purpose: To identify specific movement patterns that serve as digital biomarkers for disease status.
Materials:
- Multi-sensor motion capture system (wearable sensors or markerless cameras)
- Data processing pipeline for feature extraction
- Machine learning platform for pattern recognition
Procedure:
- Data Collection: Capture full-body movement during unconstrained activities of daily living.
- Feature Extraction: Compute kinematic parameters across all body joints:
- Joint angle distributions
- Angular velocity correlations
- Movement smoothness metrics
- Volumetric workspaces
- Feature Selection: Identify parameters showing significant differences between patients and controls.
- Model Training: Combine selected features using supervised machine learning (e.g., Gaussian process regression) to predict clinical scores.
- Validation: Test model performance on held-out data or external cohorts.
This approach has demonstrated remarkable predictive power, with one study reporting R² = 0.92 for predicting 6-minute walk distance from daily-life movement behavior in DMD patients [14].
The Scientist's Toolkit: Essential Research Reagent Solutions
Table: Key Research Materials for Motion Tracking Validation
| Item | Function | Example Products/Platforms |
|---|---|---|
| Markerless Motion Capture Software | Human pose estimation from video data | DeepLabCut (DLC) [88], OpenPose, KinaTrax [87] |
| Multi-sensor Wearable Systems | Full-body kinematic capture during daily activities | 17-sensor bodysuit [14], IMU-based systems |
| Reference Motion Capture Systems | Gold-standard validation | BTS SMART-DX [87], Vicon, Qualisys |
| Clinical Assessment Tools | Standardized clinical evaluation | MDS-UPDRS, North Star Ambulatory Assessment [14] |
| Data Synchronization Hardware | Temporal alignment of multi-system data | Trigger boxes, shared pulse generators |
| Algorithm Validation Platforms | Performance benchmarking | Custom MATLAB/Python scripts, Comet.ml, Weights & Biases |
Regulatory Submission Framework
Documentation Requirements and Submission Strategy
Successful regulatory submission requires comprehensive documentation demonstrating safety, efficacy, and reproducibility.
Technical Documentation:
- Algorithm Description: Detailed specification of AI architecture, training data, and performance characteristics
- Validation Protocols: Complete description of technical and clinical validation methodologies
- Performance Results: Comprehensive reporting of all validation metrics with statistical analysis
- Failure Mode Analysis: Documentation of system limitations and edge cases
Clinical Validation Evidence:
- Correlation with Established Endpoints: Statistical demonstration of relationship with accepted clinical scales
- Predictive Value: Evidence that biomarkers can anticipate disease progression or treatment response
- Clinical Utility: Demonstration that the technology improves decision-making or patient outcomes
Quality Management:
- Data Governance: Protocols for data collection, processing, and security
- Version Control: System for tracking algorithm changes and updates
- Human Factors Engineering: Documentation of user interface design and usability testing
The FDA's 2025 guidance emphasizes data transparency and algorithm validation throughout the product lifecycle [83]. For high-impact applications, the EMA may require a comprehensive assessment with detailed information included in the study protocol [83].
Figure 2: Regulatory submission documentation workflow
Implementation Framework for Clinical Adoption
Governance and Integration Protocols
Successful clinical adoption requires careful attention to organizational governance and workflow integration beyond regulatory compliance.
AI Governance Structure:
- Establish a cross-functional governance committee with clinical, technical, and administrative representation [86]
- Implement clear policies and procedures for AI adoption using established frameworks like IEEE UL 2933 and NIST's AI Risk Management Framework [86]
- Develop continuous monitoring systems for algorithm performance with regular assessment mechanisms [86]
Clinical Integration:
- Design human-AI collaboration protocols that maintain appropriate clinical oversight
- Implement training programs for clinical staff on system capabilities and limitations
- Establish incident reporting systems for adverse events or performance issues
Technical Maintenance:
- Create version control protocols for algorithm updates and modifications
- Implement data drift monitoring to detect changes in patient population or movement patterns
- Maintain comprehensive audit trails of system use and performance
As noted in recent analyses, "AI adoption is outpacing our ability to effectively govern it," highlighting the critical importance of structured governance approaches [86]. Healthcare organizations must work closely with AI vendors to understand capabilities, limitations, and update processes [86].
Validation frameworks for AI-enabled motion tracking systems require meticulous attention to both technical performance and clinical relevance. By implementing the protocols outlined in this document, researchers can generate the comprehensive evidence needed for regulatory compliance and clinical adoption. The rapid evolution of both AI technologies and regulatory frameworks necessitates ongoing vigilance and adaptation, with successful implementation depending on robust validation, transparent documentation, and effective governance structures.
As regulatory bodies worldwide continue to refine their approaches to AI in healthcare, the frameworks presented here provide a foundation for navigating this complex landscape while maintaining scientific rigor and patient safety as paramount concerns.
Guidelines for Selecting Algorithms Based on Specific Behavioral Analysis Needs
The integration of motion tracking technology and artificial intelligence (AI) is revolutionizing behavioral analysis, particularly in clinical research and drug development. These technologies enable the extraction of objective, quantitative digital biomarkers from complex movement data, moving beyond traditional subjective assessments [14]. In conditions like Duchenne muscular dystrophy (DMD), AI-driven analysis of whole-body movement behavior has demonstrated superior predictive capability for disease trajectory compared to standard clinical scales [14]. The selection of appropriate algorithms is paramount, as it directly influences the reliability, validity, and ultimate utility of the derived behavioral fingerprints. This document provides a structured framework for researchers to navigate the selection, validation, and application of algorithms for specific behavioral analysis needs.
Algorithm Categories and Quantitative Comparison
Algorithms for behavioral analysis can be broadly categorized based on their primary function, from basic movement tracking to advanced predictive modeling. The table below provides a comparative overview of key algorithm types, their applications, and technical considerations to guide the selection process.
Table 1: Comparative Overview of Behavioral Analysis Algorithms
| Algorithm Category | Primary Function | Common Techniques | Best-Suited Analysis | Key Advantages | Inherent Limitations |
|---|---|---|---|---|---|
| Segmentation & Object Detection | Identifies and labels distinct entities or regions of interest in data. | Otsu's thresholding, Watershed, U-Net [89] | Counting objects, isolating specific body parts for initial analysis. | Computational simplicity, well-established methodologies. | Sensitive to noise and initial parameters; may produce variable results [89]. |
| Spatiotemporal Pattern Recognition | Analyzes motion patterns across both space and time. | 3D Convolutional Neural Networks (CNNs), Transformer-based architectures [90] | Gait analysis, complex activity recognition, fluidity of movement. | Captures subtle, dynamic cues in behavior; high predictive accuracy. | Requires large, high-quality datasets; computationally intensive. |
| Dimensionality Reduction & Feature Extraction | Reduces complex kinematic data into meaningful, lower-dimensional fingerprints. | Principal Component Analysis (PCA), t-SNE, Autoencoders | Defining novel ethomic biomarkers from whole-body movement data [14]. | Reveals underlying patterns not obvious in raw data; reduces computational load. | Results can be difficult to interpret; risk of losing critical information. |
| Predictive Modeling & Regression | Maps behavioral fingerprints to clinical scores or predicts future states. | Gaussian Process Regression, Random Forests, Support Vector Machines [14] | Predicting clinical assessment scores (e.g., 6MWD, NSAA) from movement data [14]. | Provides quantitative predictions and confidence intervals; handles non-linear relationships. | Performance is highly dependent on the quality and relevance of input features. |
Experimental Protocols for Algorithm Validation
Before deployment in research, algorithms must be rigorously validated to ensure their outputs are reliable, significant, and fit for purpose. The following protocols outline a structured approach for quantitative comparison and equivalence testing.
Protocol: Quantitative Comparison of Segmentation Algorithms
This protocol is designed to determine if two segmentation algorithms produce statistically different results, using blob analysis as a model system [89].
1. Research Reagent Solutions
- Software/Libraries: Python with scikit-image, Pyclesperanto, pandas, matplotlib, SciPy, statsmodels [89].
- Sample Data: Label images generated from the algorithms under comparison (e.g.,
blobs_labels_imagej.tifandblobs_labels_skimage.tif) [89]. - Computational Environment: Jupyter Notebook or similar interactive computing environment.
2. Methodology
- Step 1: Data Import and Visualization. Import the label images using
skimage.io.imread(). Visually compare the outputs using a function likepyclesperanto_prototype.imshow()to gain an initial qualitative assessment [89]. - Step 2: Label Counting. Calculate the number of labeled objects in each image. If the images are labeled subsequently, the maximum label value equals the object count. If not, determine the count from the set of unique labels, adjusting for background (0) [89].
- Step 3: Area Measurement Extraction. Use
skimage.measure.regionprops()on each label image to extract quantitative measurements, such as the area of each detected object. Store these measurements in separate lists for each algorithm [89]. - Step 4: Descriptive Statistical Analysis. Calculate and compare descriptive statistics (e.g., number of observations, mean, standard deviation, min, max, quartiles) for the measurements from each algorithm. Using
pandas.DataFrame.describe()is efficient for this comparison [89]. - Step 5: Student's t-test for Difference. Perform an independent samples t-test (e.g.,
scipy.stats.ttest_ind) to test the null hypothesis that the means of the measurements from the two algorithms are identical. A p-value below a significance threshold (e.g., 0.05) suggests a statistically significant difference [89]. - Step 6: Two-One-Sided T-Test (TOST) for Equivalence. To test that the means are equivalent within a predefined margin, use an equivalence test like
statsmodels.stats.weightstats.ttost_ind. The equivalence threshold (e.g., 5% of the overall mean) should be defined based on biological or clinical relevance. A p-value below the significance threshold allows you to reject the null hypothesis that the means are different beyond the acceptable margin [89].
3. Data Analysis and Interpretation
- Visualization: Plot histograms of the measurements (e.g., area) from each algorithm to visually assess the distribution and overlap.
- Interpretation: The t-test determines if a difference exists, while the TOST procedure provides evidence for equivalence. Both are often needed for a complete picture. Note that statistical significance does not always imply clinical or practical significance.
Protocol: Cross-Sectional Prediction of Clinical Scales
This protocol describes how to train and validate a model that uses behavioral fingerprints derived from motion tracking to predict standard clinical assessment scores [14].
1. Research Reagent Solutions
- Motion Capture System: A 17-sensor wearable bodysuit sampling at 60 Hz to capture whole-body kinematic data during Activities of Daily Living (ADLs) [14].
- Clinical Assessments: Standardized functional tests such as the 6-Minute Walk Distance (6MWD), North Star Ambulatory Assessment (NSAA), and Performance of the Upper Limb (PUL) test [14].
- Software: Machine learning libraries capable of Gaussian Process Regression or similar supervised learning algorithms.
2. Methodology
- Step 1: Data Collection. Recruit participant cohorts (e.g., patients and healthy controls). In a single visit, simultaneously collect high-resolution motion data during unconstrained ADLs and administer the clinical functional assessments to establish ground truth labels [14].
- Step 2: Ethomic Fingerprint Extraction. Apply a suite of behavioral fingerprints to the raw kinematic time-series data. These may include:
- Mean velocities of extremities.
- Hip movement orbit.
- Volumetric workspaces of various joints.
- Joint angle and angular velocity distributions and correlations [14].
- Step 3: Model Training. Assemble a dataset where each participant's data is a vector of their ethomic fingerprints (features) and their clinical scores (labels). Use a supervised machine learning algorithm like Gaussian Process Regression to learn the mapping from the fingerprints to the clinical scores [14].
- Step 4: Model Validation. Validate the model's performance using appropriate techniques such as k-fold cross-validation. Evaluate its accuracy using metrics like the coefficient of determination (R²) and Root-Mean-Squared-Error (RMSE) between the predicted and actual clinical scores [14].
3. Data Analysis and Interpretation
- A high R² value (e.g., 0.92 as demonstrated in DMD research [14]) indicates that the behavioral fingerprints can accurately predict the clinical scale, validating the digital biomarker.
- This approach demonstrates that unstructured movement data can contain sufficient information to replicate expert clinical assessments objectively and at scale.
Workflow Visualization
The following diagrams, generated with DOT language, illustrate the logical workflows for the key protocols described in this document.
Algorithm Validation and Prediction Workflows
From Raw Data to Ethomic Biomarker
The Scientist's Toolkit: Essential Research Reagents
Successful implementation of AI-driven behavioral analysis relies on a suite of specialized tools and reagents. The following table details key components.
Table 2: Essential Research Reagents for AI Behavioral Analysis
| Tool/Reagent | Specification/Example | Primary Function in Workflow |
|---|---|---|
| Full-Body Motion Capture | 17-sensor wearable suit (e.g., 60 Hz sampling) [14] | Captures high-resolution, whole-body kinematic data during Activities of Daily Living (ADLs). |
| Clinical Assessment Scales | 6MWD, NSAA, PUL tests [14] | Provides standardized, clinician-derived ground truth for validating AI-generated biomarkers. |
| Computational Libraries | scikit-image, SciPy, statsmodels [89] | Provides algorithms for image segmentation, statistical analysis, and hypothesis testing. |
| Machine Learning Frameworks | Libraries for Gaussian Process Regression, CNNs [14] [90] | Enables the development of models that map behavioral data to clinical outcomes or future states. |
| Behavioral Fingerprinting Scripts | Custom code for calculating joint workspaces, velocity profiles, posture distributions [14] | Transforms raw kinematic data into quantitative, discriminative ethomic features. |
Conclusion
The integration of AI-powered motion tracking into behavioral analysis represents a paradigm shift for pharmaceutical research and development. By providing objective, high-dimensional, and quantitative data on behavior, these technologies are creating novel digital biomarkers that can de-risk drug candidates in preclinical stages and provide sensitive endpoints in clinical trials. The successful implementation hinges on a thorough understanding of foundational algorithms, careful application to relevant biological questions, proactive troubleshooting of technical challenges, and rigorous validation using standardized metrics. Future directions will involve the development of more explainable AI models, the creation of larger, more diverse behavioral datasets to combat bias, and the establishment of robust regulatory pathways for AI-derived endpoints. As these technologies mature, they hold the definitive promise of accelerating the development of more effective therapeutics, particularly in complex disorders of the central nervous system.
References
- 1. Understanding the Evolution of Motion Technology Tracking [https://viso.ai/deep-learning/evolution-of-motion-tracking-from-manual-tracking-to-deep-learning/]
- 2. Motion-Perception Multi-Object Tracking (MPMOT): Enhancing Multi-Object Tracking Performance via Motion-Aware Data Association and Trajectory Connection - PMC [https://pmc.ncbi.nlm.nih.gov/articles/PMC12112576/]
- 3. The Future of AI in Video Motion Capture: Trends and... | ReelMind [https://reelmind.ai/blog/the-future-of-ai-in-video-motion-capture-trends-and-predictions-for-2025]
- 4. . CNN . vs . Transformer: A Comprehensive... | Medium RNN vs LSTM vs [https://medium.com/@smith.emily2584/cnn-vs-rnn-vs-lstm-vs-transformer-a-comprehensive-comparison-b0eb9fdad4ce]
- 5. ANN vs . CNN . vs . RNN : Understanding the Differences in... vs LSTM [https://readmedium.com/ann-vs-cnn-vs-rnn-vs-lstm-understanding-the-differences-in-neural-networks-94486cbb6d5a]
- 6. TFITrack: Transformer Feature Integration Network for Object Tracking | International Journal of Computational Intelligence Systems [https://link.springer.com/article/10.1007/s44196-024-00500-0]
- 7. A two stage multi object tracking algorithm with transformer and attention mechanism | Scientific Reports [https://www.nature.com/articles/s41598-025-16389-4]
- 8. 12 Types of Neural Networks in Deep Learning [https://www.analyticsvidhya.com/blog/2020/02/cnn-vs-rnn-vs-mlp-analyzing-3-types-of-neural-networks-in-deep-learning/]
- 9. Preformer MOT: A transformer-based approach for multi-object tracking with global trajectory prediction - ScienceDirect [https://www.sciencedirect.com/science/article/pii/S2667325824003601]
- 10. Artificial intelligence in drug discovery and development: transforming challenges into opportunities | Discover Pharmaceutical Sciences [https://link.springer.com/article/10.1007/s44395-025-00007-3]
- 11. FeatureSORT: Advancements in Multi-Object Tracking - Simple Science [https://scisimple.com/en/articles/2025-07-18-featuresort-advancements-in-multi-object-tracking--akegopr]
- 12. A Comprehensive Guide to Object Tracking Algorithms in 2025 [https://datature.io/blog/a-comprehensive-guide-to-object-tracking-algorithms-in-2025]
- 13. Multi-Object Tracking : A Comprehensive Guide by Detection [https://miguel-mendez-ai.com/2023/11/08/tracking-by-detection-overview]
- 14. Wearable full-body motion tracking of activities of daily living predicts disease trajectory in Duchenne muscular dystrophy | Nature Medicine [https://www.nature.com/articles/s41591-022-02045-1]
- 15. GitHub - Fish- Motion - Tracker /BioVision- Behavior -Analytics-System [https://github.com/Fish-Motion-Tracker/BioVision-Behavior-Analytics-System]
- 16. Frontiers | Editorial: Use of Artificial Intelligence to evaluate... [https://www.frontiersin.org/journals/pharmacology/articles/10.3389/fphar.2024.1396454/full]
- 17. (PDF) Performance comparison of optical and flow ... background [https://www.academia.edu/127721786/Performance_comparison_of_optical_flow_and_background_subtraction_and_discrete_wavelet_transform_methods_for_moving_objects]
- 18. Computer Vision: Applications, Techniques and Use Cases [https://www.omnilert.com/blog/computer-vision]
- 19. Top 7 Open Source Object Tracking Tools [ ] [https://blog.roboflow.com/top-object-tracking-software/]
- 20. Road pedestrian detection and tracking algorithm based on improved YOLOv5s and DeepSORT | PLOS One [https://journals.plos.org/plosone/article?id=10.1371/journal.pone.0334786]
- 21. GitHub - mattiasegu/ sambamotr [https://github.com/mattiasegu/sambamotr]
- 22. ByteTrack: Efficient Object Tracking [https://www.emergentmind.com/topics/bytetrack]
- 23. ByteTrack : Tracking model that also considers low accuracy bounding boxes | by David Cochard | ailia-ai | Medium [https://medium.com/axinc-ai/bytetrack-tracking-model-that-also-considers-low-accuracy-bounding-boxes-17f5ed70e00c]
- 24. Achieving Adaptive Visual Multi-Object Tracking with Unscented Kalman Filter - PMC [https://pmc.ncbi.nlm.nih.gov/articles/PMC9741288/]
- 25. Validity Verification of Human Pose- Tracking for Algorithms ... Gait [https://pmc.ncbi.nlm.nih.gov/articles/PMC11054247/]
- 26. Two-dimensional video-based analysis of human gait using pose... [https://journals.plos.org/ploscompbiol/article?id=10.1371/journal.pcbi.1008935]
- 27. Using sociometers to quantify patterns | Scientific... social interaction [https://www.nature.com/articles/srep05604?error=cookies_not_supported]
- 28. GitHub - mad-lab-fau/gaitmap: The Gait and Movement ... Analysis [https://github.com/mad-lab-fau/gaitmap]
- 29. PhenoScore: AI-based phenomics to quantify rare disease and genetic variation - PMC [https://pmc.ncbi.nlm.nih.gov/articles/PMC11414844/]
- 30. for quantitative ethology on natural Protocol in... social interactions [https://pmc.ncbi.nlm.nih.gov/articles/PMC9424634/]
- 31. A neural network model enables worm tracking in challenging... [https://journals.plos.org/ploscompbiol/article?id=10.1371/journal.pcbi.1013345]
- 32. - High enables systematic phenotyping and drug... throughput tracking [https://elifesciences.org/articles/92491]
- 33. Frontiers | Editorial: Digital in movement biomarkers disorders [https://www.frontiersin.org/journals/neurology/articles/10.3389/fneur.2025.1600018/full]
- 34. for Alzheimer’s Digital : the mobile/wearable... biomarkers disease [https://www.nature.com/articles/s41746-019-0084-2?error=cookies_not_supported&code=150ef57f-1d0d-4954-9c46-30ec23829f41]
- 35. JMIR Research Protocols - Evaluation of Free-Living Motor Symptoms... [https://www.researchprotocols.org/2025/1/e72820]
- 36. Artificial Intelligence in the Diagnosis of Neurological Using... Diseases [https://pmc.ncbi.nlm.nih.gov/articles/PMC11944445/]
- 37. Artificial Intelligence in Early Detection of Neurological Disorders [https://ijircst.org/view_abstract.php?title=Artificial-Intelligence-in-Early-Detection-of-Neurological-Disorders&year=2025&vol=13&primary=QVJULTEzNzQ=]
- 38. Guidelines for clinical trial protocols for interventions involving artificial intelligence: the SPIRIT-AI extension - PMC [https://pmc.ncbi.nlm.nih.gov/articles/PMC8212701/]
- 39. Artificial intelligence-based video monitoring of movement disorders in the elderly: a review on current and future landscapes - PMC [https://pmc.ncbi.nlm.nih.gov/articles/PMC11060643/]
- 40. Intelligent Assessment Techniques for Abnormal Movement Patterns ... [https://pubmed.ncbi.nlm.nih.gov/41089595/]
- 41. Spectrum of Disease and Prescription Pattern for Outpatients with... [https://pubmed.ncbi.nlm.nih.gov/29887680/]
- 42. Validation and application of computer vision algorithms for video-based tremor analysis | npj Digital Medicine [https://www.nature.com/articles/s41746-024-01153-1]
- 43. 3D Motion Capture in Movement Disorders | Practical Neurology [https://practicalneurology.com/diseases-diagnoses/movement-disorders/movement-disorders-moment-use-of-3d-motion-capture-for-kinematic-analysis-in-movement-disorders/32077/]
- 44. detection using EEG signal processing and... Neurological disorder [https://scispace.com/papers/neurological-disorder-detection-using-eeg-signal-processing-3c5e6c9q]
- 45. Artificial intelligence-enabled detection and assessment of Parkinson’s disease using multimodal data: A survey [https://arxiv.org/html/2502.10703v1]
- 46. Object Multiple (MOT): Methods & Latest Advances Tracking [https://blog.roboflow.com/multiple-object-tracking/]
- 47. Simple online and real-time tracking with occlusion handling [https://arxiv.org/abs/2103.04147]
- 48. An anti- occlusion optimization algorithm for multiple pedestrian... [https://pmc.ncbi.nlm.nih.gov/articles/PMC10830026/]
- 49. Online Multi-Object Tracking with delta-GLMB Filter based on... | DeepAI [https://deepai.org/publication/online-multi-object-tracking-with-delta-glmb-filter-based-on-occlusion-and-identity-switch-handling]
- 50. CoTracker: Meta AI 's Video Motion Prediction Architecture | Encord [https://encord.com/blog/cotracker-metai/]
- 51. The impact of environmental risk factors on... | F1000Research [https://f1000research.com/articles/9-1183]
- 52. Deep Learning Object Tracking : Algorithms , Challenges, and... [https://flypix.ai/blog/deep-learning-object-tracking/]
- 53. 2.2. Methods for correcting — Discorpy documentation distortions [https://discorpy.readthedocs.io/en/latest/tutorials/methods.html]
- 54. Perfect Perspective with Artificial Intelligence Correction [https://autoenhance.ai/blog/perfect-perspective-correction-with-artificial-intelligence]
- 55. Quantitative Comparison - an overview | ScienceDirect Topics [https://www.sciencedirect.com/topics/computer-science/quantitative-comparison]
- 56. Software Development: Revolutionizing... | Medium AI Motion Tracking [https://medium.com/@apoorv-gehlot/ai-motion-tracking-software-development-revolutionizing-motion-detection-736619f9c494]
- 57. A reductionist paradigm for high - throughput ... behavioural [https://elifesciences.org/articles/86695]
- 58. - Real Video Processing with Time : Techniques and Best Practices... AI [https://www.forasoft.com/blog/article/real-time-video-processing-with-ai-best-practices]
- 59. Leading AI-Driven Drug Discovery Platforms: 2025 Landscape and Global Outlook - ScienceDirect [https://www.sciencedirect.com/science/article/abs/pii/S0031699725075118]
- 60. in the Real World: 5 Uses You'll Actually See ( Motion ) Tracker 2025 [https://www.linkedin.com/pulse/motion-tracker-real-world-5-uses-youll-actually-see-2025-ptnlf]
- 61. Machine learning for cognitive behavioral : datasets, methods... analysis [https://braininformatics.springeropen.com/articles/10.1186/s40708-023-00196-6]
- 62. How does motion capture data influence programming of repetitive... [https://vitmas.com/2025/06/03/how-does-motion-capture-data-influence-programming-of-repetitive-tasks-in-industrial-settings/]
- 63. Applications of machine learning in drug discovery and development - PMC [https://pmc.ncbi.nlm.nih.gov/articles/PMC6552674/]
- 64. [2009.07736] HOTA: A Higher Order Metric for Evaluating Multi-Object Tracking [https://ar5iv.labs.arxiv.org/html/2009.07736]
- 65. Understanding Object Tracking Metrics [https://miguel-mendez-ai.com/2024/08/25/mot-tracking-metrics]
- 66. : A Higher Order HOTA for Evaluating Multi-object Metric ... Tracking [https://pmc.ncbi.nlm.nih.gov/articles/PMC7881978/]
- 67. Evaluation Metrics - SportsLabKit 0.1 documentation [https://sportslabkit.readthedocs.io/en/stable/notebooks/02_user_guide/03_evaluation_metrics.html]
- 68. KPI — mdx-docs 2.1 documentation [https://docs.nvidia.com/mms/text/MDX_Multi_Camera_Tracking_KPI.html]
- 69. How to evaluate tracking with the HOTA | Medium metrics [https://jonathonluiten.medium.com/how-to-evaluate-tracking-with-the-hota-metrics-754036d183e1]
- 70. Evaluation Metrics for Multiple Object Tracking | by Renu... | Medium [https://arshren.medium.com/evaluation-metrics-for-multiple-object-tracking-7b26ef23ef5f]
- 71. DanceTrack: Multi-Object Tracking in Uniform Appearance and Diverse Motion [https://dancetrack.github.io/]
- 72. [2111.14690] DanceTrack : Multi-Object Tracking in Uniform... [https://arxiv.org/abs/2111.14690]
- 73. DanceTrack: A Unique Challenge in Multi-Object Human Tracking [https://omnihuman-1.com/bytedance/dancetrack]
- 74. ETTrack: enhanced temporal motion predictor for multi-object tracking [https://link.springer.com/article/10.1007/s10489-024-05866-4]
- 75. kamkyu94/TrackTrack | DeepWiki [https://deepwiki.com/kamkyu94/TrackTrack]
- 76. GitHub - DanceTrack / DanceTrack : [CVPR2022] DanceTrack : Multiple... [https://github.com/DanceTrack/DanceTrack]
- 77. Chapter 0 Machine Learning Robustness: A Primer [https://arxiv.org/html/2404.00897v2]
- 78. Deep learning-based behavioral analysis reaches human accuracy and is capable of outperforming commercial solutions | Neuropsychopharmacology [https://www.nature.com/articles/s41386-020-0776-y]
- 79. 3 Cutting-Edge Algorithms for Robust Object Tracking in Real - World ... [https://blog.gopenai.com/3-cutting-edge-algorithms-for-robust-object-tracking-in-real-world-ai-9aa0c06ea203]
- 80. : A Deep Dive into Sensor Fusion Motion | MLOG Tracking Algorithms [https://mlog.uz/en/blog/Motion%20Tracking%3A%20A%20Deep%20Dive%20into%20Sensor%20Fusion%20Algorithms]
- 81. Robustness evaluation against corruptions for Optical Diffraction Tomography-based classifiers - ScienceDirect [https://www.sciencedirect.com/science/article/abs/pii/S0010482525010339]
- 82. 🕵️AI Model Evaluation: Best Practices for Security & Robustness | by Tahir | Aug, 2025 | Medium [https://medium.com/@tahirbalarabe2/%EF%B8%8Fai-model-evaluation-best-practices-for-security-robustness-7f358a612e07]
- 83. Are regulators keeping pace with AI in adoption trials? clinical [https://www.pharmaceutical-technology.com/features/ai-clinical-trials-regulators-keeping-pace/]
- 84. Artificial Intelligence for Drug Development | FDA [https://www.fda.gov/about-fda/center-drug-evaluation-and-research-cder/artificial-intelligence-drug-development]
- 85. EU & UK AI Healthcare Regulation For Tracker 2025 [https://www.legalnodes.com/article/ai-healthcare-regulation]
- 86. Protecting Patient Care In The Age Of Algorithms : An AI Governance... [https://www.forbes.com/councils/forbestechcouncil/2025/01/15/protecting-patient-care-in-the-age-of-algorithms-an-ai-governance-model-for-healthcare/]
- 87. Validity of artificial intelligence-based markerless motion capture system for clinical gait analysis: Spatiotemporal results in healthy adults and adults with Parkinson’s disease - ScienceDirect [https://www.sciencedirect.com/science/article/abs/pii/S0021929023002142]
- 88. Frontiers | Deep learning based markerless motion tracking as a clinical tool for movement disorders: Utility, feasibility and early experience [https://www.frontiersin.org/journals/signal-processing/articles/10.3389/frsip.2022.884384/full]
- 89. labeling Quantitative — Bio-image Analysis Notebooks comparison [https://haesleinhuepf.github.io/BioImageAnalysisNotebooks/29_algorithm_validation/quantiative_comparison.html]
- 90. Next-Level AI Video Motion ... | ReelMind Behavior Analysis [https://reelmind.ai/blog/next-level-ai-video-motion-behavior-analysis-understand-patterns]