Beyond the DSM: Implementing the RDoC Framework for Revolutionary Brain Network Research and Precision Psychiatry
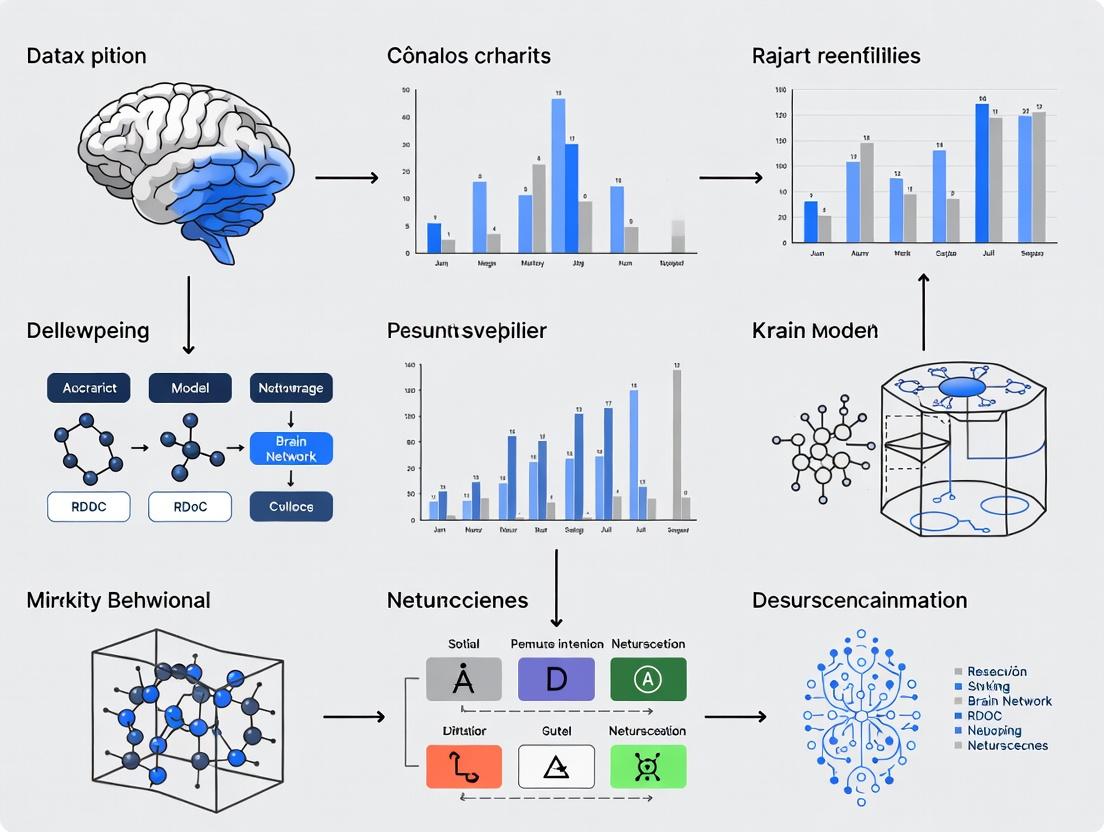
This article provides a comprehensive guide for researchers and drug development professionals on implementing the NIMH's Research Domain Criteria (RDoC) framework within modern brain network research.
Beyond the DSM: Implementing the RDoC Framework for Revolutionary Brain Network Research and Precision Psychiatry
Abstract
This article provides a comprehensive guide for researchers and drug development professionals on implementing the NIMH's Research Domain Criteria (RDoC) framework within modern brain network research. We explore the foundational shift from symptom-based to neurobiological constructs, detail methodological approaches for mapping constructs onto connectomes, address common analytical and data integration challenges, and examine validation strategies against traditional models. The synthesis offers a roadmap for using RDoC-informed network neuroscience to identify novel treatment targets and advance precision medicine for psychiatric disorders.
RDoC and the Connectome: Building a Neurobiological Foundation for Psychiatry
The implementation of the National Institute of Mental Health's Research Domain Criteria (RDoC) framework marks a paradigm shift from traditional, symptom-based diagnostic categories (e.g., DSM-5) towards transdiagnostic, dimensional constructs anchored in neurobiological systems. This thesis posits that brain network research is the essential conduit for this transition, offering quantifiable, circuit-based phenotypes that cut across conventional disorder boundaries and directly inform translational drug development.
Core Dimensional Constructs & Associated Quantitative Data
Current RDoC research prioritizes constructs spanning multiple units of analysis. The following table summarizes key constructs and recent quantitative findings from human neuroimaging and translational models.
Table 1: Key RDoC Constructs with Recent Quantitative Findings in Brain Network Research
| RDoC Domain/Construct | Primary Neural Circuit(s) | Key Biomarker (Quantitative Finding) | Relevance to Traditional Diagnoses | Drug Development Target Potential |
|---|---|---|---|---|
| Negative Valence SystemsAcute Threat ("Fear") | Amygdala-hippocampus-prefrontal cortex | Amygdala hyper-reactivity (fMRI): ~40% increase in BOLD signal in PTSD vs. controls [PMID: 35115434] | PTSD, Anxiety Disorders, MDD | Kappa-opioid receptor antagonists, NMDA modulators |
| Positive Valence SystemsReward Learning | Ventral Striatum (VS)-ventromedial PFC | Reduced VS prediction error signaling (fMRI): r=-0.65 with anhedonia severity in MDD [PMID: 36114123] | MDD, Schizophrenia, Substance Use | Dopamine D1/D3 partial agonists, Glutamatergic (mGluR2/3) agents |
| Cognitive SystemsCognitive Control | Dorsolateral PFC-anterior cingulate cortex | Theta-band fronto-parietal coherence (EEG): 25% deficit in schizophrenia during n-back task [PMID: 35851607] | Schizophrenia, ADHD, Bipolar Disorder | α7-nicotinic receptor agonists, PDE10A inhibitors |
| Social ProcessesPerception & Understanding of Self/Others | Default Mode Network (DMN), Mentalizing Network | DMN dysconnectivity: ~30% reduced within-network correlation in autism spectrum disorder [PMID: 35525211] | Autism, Schizotypal PD | Oxytocin/vasopressin pathway modulators |
| Arousal & Regulatory SystemsArousal | Locus Coeruleus-norepinephrine system, Basal forebrain | Pupillometry index of LC activation: 50% higher tonic dilation in generalized anxiety disorder [PMID: 34999765] | Anxiety, Insomnia, PTSD | Orexin receptor antagonists, α2-adrenergic agonists |
Experimental Protocols for Brain Network Research in RDoC
These protocols outline dimensional assessment across species, crucial for translational validation.
Protocol 3.1: Transdiagnostic fMRI Paradigm for Threat Sustained Response
Objective: Quantify the Acute Threat construct dimensionally across diagnostic groups.
- Participants: Recruit participants across DSM categories (PTSD, MDD, healthy controls) stratified by self-reported threat sensitivity (e.g., SPQ scale).
- Task Design: Use a well-validated threat anticipation task (e.g., NIH Toolbox threat predictability task) during 3T fMRI.
- Image Acquisition: Acquire T2*-weighted EPI sequences (TR=2000ms, TE=30ms, voxel size=3mm³). Include high-resolution T1-weighted structural scan.
- Analysis:
- First-Level: Model BOLD response during threat anticipation vs. safe periods. Extract parameter estimates from a priori amygdala and anterior insula ROIs (from standardized atlases).
- Dimensional Metric: Calculate an "Amygdala Reactivity Score" (contrast beta weight) for each subject.
- Second-Level: Perform a whole-brain regression of the Amygdala Reactivity Score against the continuous threat sensitivity measure across all participants, disregarding DSM diagnosis. Cluster-level correction (p<0.05 FWE).
Protocol 3.2: Cross-Species In Vivo Electrophysiology for Reward Valuation
Objective: Measure neural population activity during reward learning in rodents to model the Reward Valuation construct.
- Subjects: Wild-type and genetically modified mice (e.g., DAT-Cre).
- Surgery: Implant chronic drivable microelectrode arrays (e.g., NeuroNexus) targeting the Ventral Tegmental Area (VTA) and Nucleus Accumbens (NAc). Allow 7-day recovery.
- Behavioral Training: Train mice on a probabilistic reversal learning task in operant chambers. Reward is a sucrose solution.
- Recording: Perform simultaneous high-density neural recording (e.g., 256 channels) and behavioral tracking during task performance over 10 sessions.
- Analysis:
- Sort spikes to identify putative dopamine neurons (VTA; waveform characteristics, firing pattern).
- Align neural data to reward delivery and cue presentation.
- Calculate normalized firing rate changes (Z-scored) for "reward prediction error" epochs.
- Correlate neural prediction error signals with behavioral metrics (e.g., reversal learning speed) as a dimensional measure of construct function.
Visualization of RDoC Framework and Experimental Workflow
RDoC Translation from Diagnosis to Target
Reward Learning Circuit & Dopamine Signaling
The Scientist's Toolkit: Research Reagent Solutions
Table 2: Essential Research Reagents for RDoC-Aligned Brain Network Studies
| Reagent/Material | Vendor Examples | Function in RDoC Research |
|---|---|---|
| DREADDs (Designer Receptors Exclusively Activated by Designer Drugs) | Charles River, AAV from Addgene | Chemogenetic manipulation of specific cell populations within a defined circuit (e.g., amygdala PNN neurons) to probe causality in threat constructs. |
| fMRI-Compatible Threat Paradigm Software | PsychoPy, Presentation, E-Prime | Presents standardized, calibrated threat (e.g., fearful faces, shock anticipation) stimuli during scanning for reliable cross-lab construct elicitation. |
| High-Density Neuropixels Probes | IMEC, NeuroNexus | Enables simultaneous recording of hundreds of neurons across multiple brain regions in behaving animals, mapping circuit-wide dynamics during tasks. |
| Transdiagnostic Behavioral Battery (e.g., NIH Toolbox, PhenX) | NIH, PhenX Toolkit | Provides validated, brief measures of RDoC-aligned functions (e.g., cognition, emotion) for dimensional phenotyping in human cohorts. |
| Biomarker Assay Kits (e.g., pNF-H, BDNF, CRP) | Quanterix, R&D Systems | Quantifies peripheral or CSF biomarkers related to neural processes (inflammation, plasticity) as supplementary units of analysis. |
| Graph Analysis Software (for Network Neuroscience) | Brain Connectivity Toolbox, GRETNA, NetworkX | Computes metrics (e.g., modularity, global efficiency) from fMRI/EEG data to quantify brain network organization as a dimensional phenotype. |
The Research Domain Criteria (RDoC) framework, developed by the National Institute of Mental Health (NIMH), provides a multi-level, integrative approach to studying mental disorders as disruptions in fundamental psychological and biological systems. This document, situated within a broader thesis on RDoC implementation in brain network research, presents detailed Application Notes and Protocols for investigating core RDoC constructs. We focus on the transition from the Negative Valence Systems domain, which encompasses responses to aversive stimuli, to the Cognitive Systems domain, which includes processes like attention, perception, and working memory. The objective is to translate these theoretical constructs into actionable, standardized experimental methodologies for researchers, scientists, and drug development professionals, facilitating the discovery of quantifiable biomarkers and novel therapeutic targets.
Negative Valence Systems: Application Notes & Protocols
The Negative Valence Systems domain involves circuits primarily responsible for responses to acute threat (fear), potential threat (anxiety), sustained threat, loss, and frustrative nonreward. Key neural substrates include the amygdala, hippocampus, bed nucleus of the stria terminalis (BNST), insula, and regions of the prefrontal cortex (PFC), particularly the ventromedial PFC (vmPFC).
Key Construct: Acute Threat ("Fear") – Neural Circuitry & Quantification
Table 1: Quantitative Metrics for Acute Threat Response in Humans
| Measurement | Neural Substrate (fMRI BOLD Signal) | Peripheral/Behavioral Metric | Typical Change During Threat | Associated RDoC Unit of Analysis |
|---|---|---|---|---|
| Amygdala Reactivity | Bilateral Amygdala | Skin Conductance Response (SCR) | Increase (>0.5% signal change) | Physiology, Behavior |
| vmPFC Inhibition | Ventromedial Prefrontal Cortex | Fear-Potentiated Startle (FPS) | Decrease | Circuit, Physiology |
| BNST Engagement | Bed Nucleus of Stria Terminalis | Sustained SCR/Heart Rate | Increase during ambiguous threat | Circuit, Physiology |
| Insula Activation | Anterior Insula | Self-reported anxiety (0-100 VAS) | Increase | Self-report, Physiology |
Protocol: Fear Conditioning and Extinction Paradigm with Simultaneous fMRI/Physiology
Objective: To assess the functional integrity of the amygdala-vmPFC-hippocampus circuit during fear learning and safety learning (extinction).
Workflow Overview:
- Habituation: Presentation of neutral conditioned stimulus (CS+, e.g., blue shape) and neutral conditioned stimulus (CS-, e.g., yellow shape) without any aversive outcome.
- Acquisition (Conditioning): The CS+ is paired with a mildly aversive unconditioned stimulus (US, e.g., a mild electric shock or loud white noise) at a 50-75% reinforcement rate. The CS- is never paired.
- Extinction: Repeated presentation of both CS+ and CS- without any US.
- Recall/Retention Test: Presentation of CS+ and CS- after a delay (e.g., 24 hours) to test extinction memory.
Detailed Methodology:
- Participants: 30-50 healthy controls or clinical participants. Screen for contraindications for MRI.
- Stimuli: Visual CSs (shapes, images). US: A 50ms electric shock set to a "highly annoying but not painful" level, or a 95-100dB white noise burst.
- Equipment:
- 3T or 7T MRI scanner with capability for echoplanar imaging (EPI).
- Biopac or ADInstruments system for recording Skin Conductance Response (SCR), Heart Rate (ECG), and Fear-Potentiated Startle (FPS via EMG of the orbicularis oculi).
- Presentation software (e.g., PsychoPy, E-Prime).
- Procedure:
- Attach physiological sensors inside the MRI bore.
- Acquire structural scan (T1-weighted).
- Run fMRI EPI sequence during the Habituation, Acquisition, and Extinction phases. Each CS presentation should be a 6-8s block, interleaved with a fixation cross baseline.
- Trigger SCR, ECG, and FPS measurements synchronously with stimulus onset.
- Present trial-by-trial self-report ratings of "fear" or "expectancy of shock" on a visual analog scale after random trials.
- Analysis:
- fMRI: Preprocess data (realignment, coregistration, normalization, smoothing). Model BOLD response to CS+ vs CS- for each phase (Acquisition, Extinction). Extract contrast estimates (e.g., CS+ > CS-) from a priori regions of interest (ROI): amygdala, vmPFC, hippocampus, insula.
- Physiology: Score SCR as the peak-to-trough difference in microsiemens (μS) within a 0.5-4.5s window post-CS onset. Average per stimulus type and phase.
- Integration: Correlate amygdala BOLD activity with SCR magnitude during Acquisition. Correlate vmPFC activity during Extinction with extinction retention (SCR to CS+ during Recall test).
Research Reagent Solutions for Negative Valence Studies
| Reagent/Tool | Provider Examples | Function in Research |
|---|---|---|
| Fear Conditioning Chambers (Med Associates) | Med Associates, Coulbourn | Standardized rodent testing apparatus for Pavlovian fear conditioning, with grid floors for shock delivery. |
| C-Fos Antibodies (c-Fos (9F6) Rabbit mAb) | Cell Signaling Technology | Immunohistochemical marker for neuronal activity mapping in rodent brains post-behavioral task. |
| DREADD Ligands (CNO, Compound 21) | Hello Bio, Tocris | Chemogenetic tools to selectively activate (hM3Dq) or inhibit (hM4Di) neurons in specific RDoC-relevant circuits (e.g., amygdala→vmPFC). |
| Aversive US (Biomedical Stimulator) | STMISOC, BIOPAC | Delivers precise, calibrated mild electric shocks as an unconditioned stimulus in human fear conditioning. |
| Startle Response System (EMG) | SR-LAB, BIOPAC | Measures the electromyographic (EMG) activity of the orbicularis oculi muscle to quantify fear-potentiated startle. |
Cognitive Systems: Application Notes & Protocols
The Cognitive Systems domain encompasses processes such as attention, perception, working memory, and cognitive control. Key neural substrates involve large-scale networks: the Frontoparietal Network (FPN; for cognitive control), the Dorsal Attention Network (DAN), the Default Mode Network (DMN; whose suppression is crucial for focused attention), and specific regions like the dorsolateral PFC (dlPFC).
Key Construct: Cognitive Control – Network Dynamics & Quantification
Table 2: Quantitative Metrics for Cognitive Control in Humans
| Measurement | Neural Substrate (fMRI/EEG) | Behavioral/Task Metric | Typical Performance Correlation | Associated RDoC Unit of Analysis |
|---|---|---|---|---|
| FPN-DMN Anti-Correlation | Functional Connectivity (FPN vs. DMN) | Intra-individual Reaction Time Variability | Stronger anti-correlation → lower variability | Circuit, Physiology |
| dlPFC Activation (N-back) | BOLD signal in dlPFC | N-back Task Accuracy (d') | Higher activation → better accuracy | Circuit, Behavior |
| Frontal Midline Theta Power (EEG) | 4-8 Hz power at FCz electrode | Conflict adaptation effect (Flanker task) | Increased theta → better post-error adjustment | Physiology, Behavior |
| P300 Amplitude (EEG/ERP) | Parietal positivity ~300ms post-stimulus | Oddball Target Detection Accuracy | Larger amplitude → better detection | Physiology, Behavior |
Protocol: Multi-Modal Assessment of Cognitive Control Networks (fMRI & EEG)
Objective: To measure the dynamic interaction between the Frontoparietal Network (FPN) and the Default Mode Network (DMN) during a parametrically demanding working memory task.
Workflow Overview:
- Resting-State Scan: 10 minutes of eyes-open fixation to define individual FPN and DMN connectivity maps.
- Task-Based fMRI: Performance of a parametrically graded N-back task (0-back, 1-back, 2-back, 3-back) in the scanner.
- Simultaneous EEG-fMRI: During both rest and task, high-density EEG is recorded to capture oscillatory dynamics (e.g., frontal theta).
- Analysis Pipeline: Integrate network-level fMRI connectivity with trial-by-trial EEG power and behavioral performance.
Detailed Methodology:
- Participants: 30-50 participants. Use an MRI-compatible EEG cap.
- Task (N-back): Letters are presented sequentially. For 0-back: press button for target letter "X". For 1-back: press if current letter matches previous. For 2-back: press if matches letter two back, etc.
- Equipment:
- 3T MRI scanner.
- MRI-compatible 64- or 128-channel EEG system (e.g., Brain Products).
- Synchronization device (e.g., BrainAmp MR Plus).
- Procedure:
- Prepare participant with EEG cap, apply gel, and check impedances.
- Acquire resting-state fMRI + EEG for 10 mins.
- Acquire task-based fMRI + EEG. Present N-back blocks (e.g., 30s per load, 4 blocks per load) in counterbalanced order.
- Record accuracy and reaction time.
- Analysis:
- fMRI: Preprocess including artifact correction for EEG. Use independent component analysis (ICA) to define FPN and DMN components from resting-state data. Extract timecourses from these networks during the N-back task. Calculate: (1) within-network connectivity strength, and (2) between-network (FPN-DMN) connectivity (anti-correlation).
- EEG: Remove MR and ballistocardiogram artifacts. Compute time-frequency representations (e.g., Morlet wavelets) for frontal electrodes. Extract theta (4-8 Hz) power aligned to trial onset.
- Integration: Use multi-level modeling to predict trial-level reaction time based on: (a) N-back load, (b) preceding FPN-DMN connectivity state, and (c) frontal theta power.
Research Reagent Solutions for Cognitive Systems Studies
| Reagent/Tool | Provider Examples | Function in Research |
|---|---|---|
| N-back Task Software (Psychology Tools) | PsychoPy, E-Prime, Inquisit | Presents adaptive working memory tasks with precise timing and data logging for behavioral metrics (d', RT). |
| Functional Connectivity Toolbox (CONN) | MIT, CONN Toolbox | MATLAB/SPM-based toolbox for preprocessing and analyzing resting-state and task-based functional connectivity fMRI data. |
| MRI-Compatible EEG Systems | Brain Products, ANT Neuro | High-density EEG caps and amplifiers designed for safe, simultaneous recording inside the MRI scanner. |
| Transcranial Magnetic Stimulation (TMS) Coils (Figure-8) | MagVenture, Brainsway | Non-invasive brain stimulation to temporarily inhibit or excite nodes of cognitive networks (e.g., dlPFC) during task performance. |
| Phosphorylation-Specific Antibodies (pCREB, pERK) | Abcam, Cell Signaling | Used in rodent/post-mortem tissue to map molecular signaling cascades (e.g., CREB activation in hippocampus) following cognitive training. |
Translational Bridge: From Negative Valence to Cognitive Dysfunction
A core thesis of modern RDoC-based research is that dysfunction in one domain (e.g., hyperactive Negative Valence systems in anxiety) directly impairs another (e.g., depleted Cognitive Control resources). The following integrative protocol is designed to test this hypothesis.
Protocol: Threat-Of-Shock Working Memory Paradigm
Objective: To quantify how acute anxiety (threat) modulates the neural substrates of working memory and cognitive control.
Workflow:
- Condition: Two block types: Safe (no shock possible) and Threat (signaled by a colored border, shock possible at any time).
- Task: Within each block, participants perform the N-back task (e.g., 2-back).
- Measures: fMRI (amygdala, dlPFC, FPN/DMN), EEG (frontal theta), SCR (anxiety), and task performance.
- Analysis: Contrast Threat vs. Safe blocks for: (a) amygdala reactivity, (b) dlPFC/FPN activity, (c) FPN-DMN anti-correlation, and (d) behavioral cost (accuracy/RT).
Table 3: Integrated Data Output from Threat-Of-Shock WM Task
| Experimental Condition | Amygdala BOLD | dlPFC/FPN BOLD | FPN-DMN Anti-correlation | 2-back Accuracy (%) | Frontal Theta Power |
|---|---|---|---|---|---|
| Safe | Baseline (e.g., 0.0% Δ) | High Engagement | Strong (-0.5 to -0.7 r) | High (e.g., 95%) | Task-Related Increase |
| Threat | Elevated (e.g., +0.8% Δ) | Reduced/Disrupted | Weaker (-0.2 to -0.4 r) | Impaired (e.g., 80%) | Blunted/Disorganized |
These Application Notes and Protocols operationalize the RDoC framework's transdiagnostic, circuit-based approach. By providing detailed, multi-modal methodologies for investigating Negative Valence and Cognitive Systems—and their critical interactions—this document aims to standardize experimental approaches in brain network research. The generated quantitative data tables, explicit protocols, and integrative models are designed to accelerate the identification of circuit-based biomarkers. For drug development professionals, these protocols offer a pathway for stratifying patient populations based on neural circuit dysfunction rather than symptomatic diagnosis and for developing novel compounds that target these specific, measurable neurobiological systems. The ultimate goal, consistent with the broader thesis, is to foster a new era of biomarker-driven translational neuroscience.
The Research Domain Criteria (RDoC) framework, developed by the NIMH, necessitates a multi-level, circuit-based understanding of mental functioning and dysfunction. Connectomics and graph theory provide the essential quantitative tools to map and analyze these neural circuits, aligning perfectly with the RDoC matrix's emphasis on dimensions of behavior and neurobiological systems. This application note details protocols for generating and analyzing connectomic data within this translational research context.
Core Graph Theory Metrics for Brain Networks
Graph theory quantifies brain organization by treating brain regions as nodes and their connections (structural or functional) as edges. Key metrics are summarized below.
Table 1: Core Graph Theory Metrics for Brain Network Analysis
| Metric | Definition | RDoC Relevance / Neurobiological Interpretation | Typical Range in Human fMRI* |
|---|---|---|---|
| Degree | Number of connections to a node. | Identifies hubs—critical regions for integration (e.g., dmPFC, IPL). | 10-50 (depends on threshold) |
| Clustering Coefficient | Measure of local interconnectivity among a node's neighbors. | Reflects robustness and potential for specialized, modular processing. | 0.2 - 0.6 |
| Characteristic Path Length | Average shortest path between all node pairs. | Global integration efficiency; longer paths may indicate disconnection. | 1.5 - 2.5 steps |
| Betweenness Centrality | Fraction of shortest paths passing through a node. | Identifies pivotal hubs for information flow; targets for neuromodulation. | 0.01 - 0.15 |
| Modularity | Strength of division of the network into modules (subnetworks). | Quantifies segregation of functional domains (e.g., salience vs. default networks). | 0.3 - 0.5 |
| Small-Worldness Sigma | Ratio of normalized clustering to path length ( >1 indicates small-world). | Balances segregated processing and integrated communication; optimal for cognitive function. | 1.5 - 2.5 |
*Values are illustrative and highly dependent on parcellation scheme and processing pipeline.
Experimental Protocols
Protocol 3.1: Resting-State fMRI for Functional Connectivity Analysis
Objective: To derive a whole-brain functional connectivity matrix for graph analysis. Materials: 3T MRI scanner, 32-channel head coil, participant response device, MRI-safe headphones, foam padding. Reagents: None for basic acquisition.
Procedure:
- Participant Preparation & Positioning: Screen for contraindications. Position participant supine, using foam padding to minimize head movement. Instruct to keep eyes open, fixate on a cross, and not think of anything in particular.
- Sequence Acquisition:
- Acquire high-resolution T1-weighted anatomical scan (MPRAGE: TR=2400ms, TE=2.24ms, voxel=0.8mm isotropic).
- Acquire resting-state fMRI using a T2*-weighted EPI sequence (TR=800ms, TE=30ms, voxel=2.5mm isotropic, slices=60, multiband acceleration factor=8, duration=10 mins ~ 750 volumes).
- Monitor physiological signals (cardiac, respiration) concurrently.
- Preprocessing (fMRIPrep/MATLAB SPM12):
- Slice-time correction and realignment to correct for motion.
- Coregistration of functional to anatomical data.
- Normalization to standard (MNI) space.
- Nuisance regression (24 motion parameters, white matter & CSF signals, global mean).
- Band-pass filtering (0.008-0.09 Hz) to focus on low-frequency fluctuations.
- Scrubbing of high-motion volumes (FD > 0.5mm).
- Timeseries Extraction: Using the Schaefer 100- or 200-parcel atlas, extract the mean BOLD timeseries from each cortical region. Subcortical regions can be added via the AAL or Harvard-Oxford atlas.
- Connectivity Matrix Generation: Compute the Pearson correlation coefficient between the timeseries of every pair of regions. Apply Fisher's z-transform to the resulting 100 x 100 (or N x N) correlation matrix. A group-level threshold (e.g., proportional thresholding to retain top 20% of connections) is often applied before graph computation.
Protocol 3.2: Tractography from Diffusion MRI for Structural Connectivity
Objective: To reconstruct white matter pathways and create a structural connectivity matrix. Materials: 3T MRI scanner with high-performance gradients (≥80 mT/m), 64+ channel head coil. Reagents: None.
Procedure:
- Data Acquisition: Acquire multi-shell, high angular resolution diffusion imaging (HARDI).
- Sequence: Spin-echo EPI, b-values=1000, 2000 s/mm², directions=~90 per shell, voxel=1.5-2.0mm isotropic. Include reverse phase-encoded b=0 images for distortion correction.
- Preprocessing (FSL MRtrix3, QSIPrep):
- Denoising, Gibbs-ringing removal, distortion correction (FSL
topup), eddy-current and motion correction (FSLeddy). - Tensor fitting or constrained spherical deconvolution (CSD) to estimate fiber orientation distributions (FODs).
- Denoising, Gibbs-ringing removal, distortion correction (FSL
- Whole-Brain Tractography: Perform probabilistic tractography (e.g., iFOD2 in MRtrix3).
- Seed from a white matter mask, generate 5-10 million streamlines.
- Apply anatomical constraints (ACT) to terminate streamlines in gray matter.
- Connectome Construction: Using the same parcellation as in Protocol 3.1, map streamlines between region pairs to create an N x N adjacency matrix. The edge weight is typically defined as the number of streamlines (or a density measure) connecting two regions. Apply a log-transform to normalize the distribution.
Protocol 3.3: Graph Construction and Analysis
Objective: To compute topological metrics from connectivity matrices. Materials: Workstation with MATLAB/Python (Brain Connectivity Toolbox, NetworkX) or dedicated software (GRETNA, BrainNet Viewer). Reagents: N/A
Procedure:
- Matrix Finalization: Load the thresholded, weighted (or binarized) connectivity matrix.
- Metric Computation: For each node and the whole network, compute metrics from Table 1 using the BCT functions (e.g.,
strengths_und,clustering_coef_wu,efficiency_wei,betweenness_wei,modularity_und). - Null Model Comparison: Generate 100-1000 randomized networks (e.g., Maslov-Sneppen rewiring) that preserve original degree distribution. Compute metrics on each to create a null distribution. Compare the real network's metrics to this null to obtain normalized values (e.g., γ = C/Crand, λ = L/Lrand, σ = γ/λ).
- Statistical Analysis: Compare metrics between groups (RDoC-defined patient subgroups vs. controls) using ANCOVA, controlling for age/sex. Use network-based statistic (NBS) for edge-wise comparisons. Correct for multiple comparisons (FDR).
Visualization: Pathways and Workflows
Diagram Title: Connectomic Data Analysis Workflow
Diagram Title: Example Anxiety Circuit as a Graph
The Scientist's Toolkit: Research Reagent Solutions
Table 2: Essential Materials for Connectomics Research
| Item | Function & Relevance |
|---|---|
| High-Density MRI Coil (64/128 ch) | Increases signal-to-noise ratio and spatial resolution for finer parcellation and more accurate connectivity measures. |
| Multiband EPI Sequence | Accelerates fMRI acquisition, allowing faster TR for better temporal resolution or shorter scan times. Critical for high-quality rs-fMRI. |
| Standardized Brain Atlases (Schaefer, AAL3, HCP-MMP) | Provide consistent node definitions for graph construction, enabling cross-study comparison within the RDoC framework. |
| QSIPrep/fMRIPrep Pipelines | Robust, containerized preprocessing pipelines ensure reproducibility and minimize analytical variability in structural/functional connectomics. |
| Brain Connectivity Toolbox (BCT) | The standard MATLAB library for calculating all core and advanced graph theory metrics from connectivity matrices. |
| Network-Based Statistic (NBS) Toolbox | Statistically identifies dysconnected sub-networks (rather than single connections), aligning with RDoC's circuit-level focus. |
| High-Performance Computing Cluster | Essential for processing large datasets (e.g., HCP, UK Biobank), running tractography, and permutation testing for graph metrics. |
| The RDoC Matrix Handbook | Guides the interpretation of network findings (e.g., default mode network hypoconnectivity) within specific behavioral/psychological constructs. |
Application Notes
The integration of the Research Domain Criteria (RDoC) framework with network neuroscience represents a paradigm shift in psychopathology research. This approach posits that mental disorders are emergent properties of dysfunction within complex, multi-scale brain networks. The core innovation lies in mapping RDoC's hierarchical Units of Analysis (from genes to self-reports) onto the nodes and edges of empirically derived neural circuits. This translation moves the field beyond static syndromic categories towards a dynamic, circuit-based nosology. For drug development, this convergence enables target engagement studies to quantify a compound's effect on specific, transdiagnostic network features (e.g., salience network hyperconnectivity) rather than heterogeneous symptom clusters, promising more precise and mechanistically grounded therapeutics.
Table 1: Exemplary RDoC Constructs with Proposed Network Correlates
| RDoC Construct | Primary Brain Network(s) | Key Network Metric | Typical Alteration in Psychopathology | Quantitative Reference (Mean ± SD or Effect Size) |
|---|---|---|---|---|
| Acute Threat ("Fear") | Salience Network (SN), Central Executive Network (CEN) | SN-amygdala connectivity | Hyperconnectivity in Anxiety Disorders | d = 0.72 [95% CI: 0.51, 0.93] |
| Reward Responsiveness | Mesocorticolimbic Circuit (VTA-NAcc-PFC) | NAcc node strength | Blunted response in Anhedonia (MDD) | β = -0.41, p<0.001 |
| Cognitive Control | Frontoparietal Control Network (FPCN) | Global efficiency | Reduced efficiency in Schizophrenia | Cohen's f = 0.35 |
| Social Communication | Default Mode Network (DMN), Mentalizing Network | DMN within-network modularity | Decreased modularity in ASD | Q reduction: 15-20% |
Table 2: Mapping RDoC Units to Network Properties
| RDoC Unit of Analysis | Network Neuroscience Analog | Measurement Tool/Assay | Data Type for Network Node/Edge |
|---|---|---|---|
| Genes/Molecules | Node/Edge weight modulator | GWAS, Transcriptomics, PET Radioligands | Heritability estimate, Receptor density map |
| Cells | Micro-circuit node | In vitro electrophysiology, Optogenetics | Firing rate, Oscillation power |
| Circuits | Meso-scale network | fMRI, MEG/EEG source imaging | Functional connectivity (e.g., beta-series correlation) |
| Physiology | Network dynamic state | EEG spectral power, Pupillometry | Phase-amplitude coupling, Arousal index |
| Behavior | Network output | Behavioral task performance (e.g., n-back) | Accuracy, Reaction time variability |
| Self-Reports | Phenotypic descriptor | Ecological Momentary Assessment (EMA) | Symptom severity score (e.g., PANSS) |
Experimental Protocols
Protocol 1: fMRI-Based Mapping of the "Loss" Construct (Negative Valence Systems) onto Network Edges
Objective: To quantify alterations in fronto-striatal circuit connectivity as a network edge correlate of the RDoC "Loss" construct in Major Depressive Disorder (MDD).
Materials: 3T MRI scanner with 32-channel head coil, E-Prime or Presentation software, Monetary Incentive Delay (MID) task adapted for loss anticipation, T1-weighted MPRAGE sequence, T2*-weighted multiband EPI sequence (TR=800ms, TE=30ms, voxel=2mm³), CONN or FSL neuroimaging software suite.
Procedure:
- Participant Preparation: Screen 30 MDD participants (meeting DSM-5/ICD-11 criteria) and 30 matched healthy controls (HC). Obtain informed consent.
- Task fMRI Acquisition: Participants complete the Loss-MID task in the scanner. The task consists of 80 trials: 40 "Loss" cues (potential monetary loss), 40 "Neutral" cues. Each trial: cue (1500ms), anticipation delay (variable 2000-2500ms), target (160-260ms, adaptive), feedback (1650ms).
- Structural & Functional MRI: Acquire high-resolution T1 scan. Acquire resting-state fMRI (10 mins, eyes open) pre- and post-task. Acquire task-fMRI during Loss-MID.
- Preprocessing: Process data using fMRIPrep v21.0.0. Steps include: slice-time correction, motion correction, susceptibility distortion correction, normalization to MNI152 space, spatial smoothing (6mm FWHM).
- First-Level Analysis (Task): General Linear Model (GLM) with regressors for Loss Cue, Anticipation Period, and Feedback. Contrast: Loss Anticipation > Neutral Anticipation.
- Seed-Based Connectivity Analysis (SBCA): Define bilateral nucleus accumbens (NAcc) seeds from the Harvard-Oxford atlas. Extract BOLD time-series from seed regions during the resting-state scans.
- Network Edge Definition: Compute Fisher-z transformed Pearson correlation coefficients between NAcc seed time-series and all other brain voxels. This creates a whole-brain connectivity map per participant.
- Group-Level Analysis: Conduct a 2x2 mixed ANOVA (Group: MDD vs. HC; Time: pre- vs. post-task) on the strength of the NAcc-dorsolateral prefrontal cortex (dlPFC) connectivity edge (derived from SBCA).
- RDoC Integration: Correlate the change in NAcc-dlPFC edge strength (post-pre) with anhedonia severity scores from the Snaith-Hamilton Pleasure Scale (SHAPS), an instantiation of the "Loss" construct at the Behavior unit.
Protocol 2: EEG-Derived Network Dynamics for the "Cognitive Control" Construct
Objective: To assess frontal theta-band network modularity as an electrophysiological network node property of the RDoC "Cognitive Control" construct.
Materials: 64+ channel EEG system (e.g., BioSemi ActiveTwo), active electrodes, conductive gel, Curry 8 or EEGLAB/FieldTrip toolbox, flanker or Stroop task software.
Procedure:
- Setup: Apply EEG cap according to 10-20 system. Ensure electrode impedances < 10 kΩ.
- Task & Recording: Record EEG continuously (sampling rate ≥ 512 Hz) while participant performs a computerized Eriksen Flanker task (300 trials, incongruent vs. congruent). Synchronize task events with EEG triggers.
- Preprocessing: Filter data (1-45 Hz bandpass, 50/60 Hz notch). Perform ICA to remove ocular and muscular artifacts. Re-reference to average reference.
- Source Localization & Node Definition: Use sLORETA or eLORETA to estimate cortical source activity from scalp potentials. Parcellate source space into 50-100 cortical regions (nodes) using the Desikan-Killiany atlas.
- Time-Frequency & Connectivity Analysis: For the post-error correction trials (indexing cognitive control):
- Extract epoch from -1000ms to +2000ms relative to error feedback.
- Compute spectral power in theta band (4-8 Hz) for each node.
- Compute Phase Locking Value (PLV) between all node pairs in the theta band to form a connectivity matrix per trial.
- Network Analysis: Calculate the modularity (Q) of each trial's theta-band network using the Louvain algorithm. Average Q across post-error trials. Compare between groups (e.g., ADHD vs. controls) using independent t-test.
- Cross-Unit Validation: Correlate network modularity (Q) with behavioral performance (reaction time slowing post-error) and with self-reported daily cognitive failures (CFQ).
Diagrams
Diagram Title: RDoC Units Mapped to Network Elements
Diagram Title: RDoC-Network Mapping Experimental Workflow
Diagram Title: Acute Threat (Fear) Network Circuit
The Scientist's Toolkit: Research Reagent Solutions
Table 3: Essential Materials for RDoC-Network Convergence Research
| Item | Function/Application | Example Product/Resource |
|---|---|---|
| High-Density EEG Systems | Record millisecond-scale neural dynamics for network time-series analysis. Critical for "Cognitive Systems" constructs. | BioSemi ActiveTwo, EGI HydroCel GSN. |
| Multiband fMRI Sequences | Accelerate BOLD data acquisition for high-temporal resolution functional connectivity and dynamic network analysis. | Siemens CMRR multiband EPI, GE's HyperBand. |
| Standardized RDoC Tasks | Elicit specific construct-relevant behavior and neural activity for cross-study comparability. | NIH RDoC Pattern Task Set, ENIGMA consortium protocols. |
| Connectomics Software Suites | Preprocess data, construct networks, and calculate graph metrics from neuroimaging data. | CONN Toolbox, Brain Connectivity Toolbox (BCT), GRETNA. |
| Polygenic Risk Score (PRS) Calculators | Aggregate genetic vulnerability (RDoC "Genes" unit) for correlation with network phenotypes. | PRSice-2, LDpred2. |
| Simultaneous EEG-fMRI Systems | Unite high-temporal (EEG) and high-spatial (fMRI) resolution to define network nodes/edges across scales. | Brain Products MR-compatible EEG, BrainVision Recorder. |
| Transcranial Magnetic Stimulation (TMS) | Perturb specific network nodes (e.g., dlPFC) to test causal role in RDoC constructs and behavior. | MagVenture MagPro, NeuroStar TMS. |
| Electronic Ecological Momentary Assessment (eEMA) | Capture real-world "Behavior" and "Self-Report" data for contextualizing lab-based network measures. | ilumivu mEMA platform, Movisens ExperienceSampler. |
Application Notes & Protocols
This document synthesizes key empirical findings and provides standardized protocols for implementing Research Domain Criteria (RDoC) within a network neuroscience framework. The goal is to translate the RDoC matrix's multi-unit constructs into quantitative, network-based assays for dimensional psychopathology.
Table 1: Landmark Studies Integrating RDoC and Network Neuroscience
| Study (Year) | RDoC Domain/Construct | Network Measure(s) | Key Quantitative Finding | Clinical Correlation |
|---|---|---|---|---|
| Fornito et al. (2021) | Systems for Social Processes; Negative Valence Systems | Global Efficiency, Modularity (Resting-state fMRI) | r = -0.45 between social anhedonia and global efficiency of the social brain network. Reduced modularity (Q = 0.32 vs. 0.41 in controls) predicted social withdrawal. | Schizophrenia spectrum, Major Depressive Disorder |
| Elliott et al. (2018) | Cognitive Control (Goal Selection) | Frontoparietal Network (FPN) - Default Mode Network (DMN) Anti-correlation (Task fMRI) | Strength of FPN-DMN anti-correlation during task explained ~30% of variance in task-switching accuracy. Patients with MDD showed 60% reduction in anti-correlation magnitude. | Major Depressive Disorder, ADHD |
| Xia et al. (2023) | Arousal & Regulatory Systems | Dynamic Functional Connectivity (dFC) of Salience Network (SN) | State dwell time in an SN-centralized dynamic state was ~25% shorter in PTSD cohort. Transition entropy was 1.8x higher in PTSD vs. trauma-exposed controls. | Post-Traumatic Stress Disorder |
| Sylvester et al. (2020) | Positive Valence Systems (Reward Learning) | Striatal-Cortical Pathway Strength (Diffusion MRI + fMRI) | Probabilistic tractography streamline count in ventral striatum→vmPFC pathway correlated with reinforcement learning rate (ρ = 0.52). This was attenuated in anhedonia (ρ = 0.15). | Anhedonia across diagnoses |
Experimental Protocol 1: Dynamic Network Correspondence Analysis for RDoC Constructs
Purpose: To map transient brain network states onto continuous measures of behavior or experience relevant to RDoC constructs (e.g., acute threat ("fear"), sustained threat, reward anticipation).
Detailed Methodology:
Participant & Task Design:
- Recruit a transdiagnostic sample or a cohort stratified by an RDoC-relevant trait.
- Implement an fMRI task paradigm that probes the target construct (e.g., a monetary incentive delay task for "Reward Anticipation," or a threat-of-shock paradigm for "Acute Threat").
- Simultaneously collect continuous self-report or physiological data (e.g., skin conductance response (SCR) for threat, subjective arousal ratings).
fMRI Data Acquisition & Preprocessing:
- Acquire whole-brain BOLD data on a 3T scanner (TR=800ms, multi-band acceleration factor ≥4).
- Preprocess using fMRIPrep: slice-time correction, motion correction, normalization to MNI152 space, high-pass filtering (0.01 Hz), and nuisance regression (Friston-24 motion parameters, WM, CSF signals).
Dynamic Network Analysis:
- Sliding Window & Clustering: Using the Nilearn or BrainSpace toolbox, extract time-series from the Schaefer 400-parcel atlas. Apply a tapered sliding window (width=60s, step=1TR). Calculate dynamic functional connectivity (dFC) matrices per window.
- k-means clustering (k=4-8) is applied to all windowed dFC matrices to identify recurrent whole-brain network states.
- State Time Course: Generate a binary vector for each state, marking windows where it is dominant.
RDoC-Behavior Correspondence:
- Regressor Creation: Convolve the continuous behavioral/physiological trace (e.g., SCR) with the HRF to create a model regressor.
- General Linear Model (GLM): For each network state time course, run a GLM with the behavioral regressor. This identifies states whose occurrence is significantly modulated (p<0.05, FDR-corrected) by the intensity of the RDoC-relevant experience.
- Output: A set of brain network states quantitatively linked to the temporal dynamics of the RDoC construct.
Experimental Protocol 2: Multilayer Network Analysis of RDoC Units of Analysis
Purpose: To integrate multiple "Units of Analysis" (e.g., circuits, physiology, behavior) from the RDoC matrix into a unified network model, moving beyond fMRI-only connectivity.
Detailed Methodology:
Multimodal Data Collection:
- Acquire concurrent EEG-fMRI data during an RDoC-relevant task or resting-state.
- Layer 1 (Circuit): fMRI BOLD data (processed as in Protocol 1).
- Layer 2 (Physiology): Source-localized EEG theta-band (4-8 Hz) power envelope connectivity.
- Layer 3 (Behavior): Trial-by-trial performance metrics (e.g., reaction time, accuracy) or questionnaire subscores.
Single-Layer Network Construction:
- Construct adjacency matrices for each layer using appropriate metrics: Pearson correlation for fMRI, phase-lag index (PLI) for EEG theta, and correlation across trials for behavioral measures.
Multilayer Network Integration:
- Use the MULTIPLEX or GenLouvain toolbox. Represent each modality as a distinct layer.
- Define inter-layer connections. Typically, each node (brain region) is connected to its counterpart in the adjacent layer(s) with a constant coupling parameter (ω). The optimal ω is determined via multiplex reliability analysis.
Multilayer Community Detection & RDoC Correlation:
- Apply a multilayer modularity algorithm (e.g., GenLouvain) to partition the network into cross-layer modules.
- Calculate each participant's module allegiance matrix.
- Correlate (Spearman's ρ) specific cross-layer module allegiance strengths (e.g., allegiance of a fronto-insular module across fMRI and EEG layers) with a primary RDoC construct score (e.g., NIH Toolbox Fear-Affected Survey score). This tests integration strength as a biomarker.
Visualizations
Dynamic Network Correspondence Workflow
Multilayer RDoC Network Analysis
The Scientist's Toolkit: Key Research Reagent Solutions
| Item (Vendor/Model) | Function in RDoC-Network Neuroscience |
|---|---|
| Schaefer 400-Parcel Atlas | Provides a functionally defined brain parcellation optimized for network neuroscience analyses, essential for constructing robust connectivity matrices. |
| fMRIPrep Pipeline (v23.x) | A robust, standardized preprocessing pipeline for fMRI data. Critical for ensuring reproducibility and data quality across studies. |
| BrainSpace Toolbox (Python) | Enables advanced network analyses, including gradient mapping and multimodal coupling, for investigating RDoC-relevant brain organization principles. |
| CONN Toolbox (v22.a) | Comprehensive MATLAB/SPM-based toolbox for functional connectivity, seed-based, and ROI-to-ROI analyses, with built-in RDoC-informed designs. |
| MNE-Python | Provides tools for EEG/MEG source reconstruction and time-frequency analysis, key for the "Physiology" unit of analysis in multilayer networks. |
| GenLouvain Algorithm | Essential for detecting communities (modules) in multilayer networks, enabling the integration of fMRI, EEG, and behavioral data layers. |
| NIH Toolbox Emotion Batteries | Provides standardized, validated computer-adaptive tests to quantify RDoC-relevant constructs (e.g., Negative Affect, Social Satisfaction). |
| PsychoPy/Presentation | Software for precise design and delivery of experimental paradigms that probe specific RDoC constructs (e.g., fear conditioning, reward tasks). |
| High-Density EEG Caps (EGI, BrainVision) | Necessary for acquiring high-fidelity electrophysiological data concurrent with fMRI for multimodal network analysis. |
From Theory to Data: Methodological Strategies for RDoC-Informed Network Analysis
The Research Domain Criteria (RDoC) framework, developed by the National Institute of Mental Health (NIMH), seeks to move beyond traditional diagnostic categories by investigating dimensions of functioning (constructs) across multiple units of analysis, from genes to behavior. Within a thesis on RDoC implementation in brain network research, the choice of functional magnetic resonance imaging (fMRI) paradigm is critical. Task-based and resting-state fMRI offer complementary avenues for probing the neural circuitry underlying RDoC constructs such as "Acute Threat ('Fear')," "Reward Valuation," or "Cognitive Control." This document provides application notes and detailed protocols for deploying these methodologies.
Table 1: Paradigm Comparison for RDoC Construct Investigation
| Feature | Task-Based fMRI | Resting-State fMRI (rs-fMRI) |
|---|---|---|
| Primary Data | Stimulus-evoked BOLD response. | Intrinsic, spontaneous BOLD fluctuations. |
| Key Metric | Activation magnitude (GLM beta weights); Functional connectivity during task. | Intrinsic Functional Connectivity (FC); Network properties (e.g., graph theory). |
| Probing RDoC | Directly tests mechanism by engaging specific construct circuits via controlled tasks. | Assays trait-like baseline organization and integrity of circuits relevant to a construct. |
| Construct Example: Acute Threat | Fear-conditioning task; amygdala/reactivity to threat cues. | Baseline amygdala-PFC/vmPFC connectivity as potential biomarker of threat sensitivity. |
| Advantages | High construct validity for specific processes; causal inference from task design. | Easier acquisition, no task compliance; suitable for diverse populations; reflects intrinsic network architecture. |
| Challenges | Task design complexity; performance confounds; may not capture trait-level dysfunction. | Indirect link to specific constructs; susceptible to motion/physiological confounds; interpretation is inferential. |
| Analysis Focus | General Linear Model (GLM), Psychophysiological Interaction (PPI). | Seed-based correlation, Independent Component Analysis (ICA), Graph Theory. |
Table 2: Recent Quantitative Findings (Illustrative)
| RDoC Construct | Task-fMRI Finding (Sample) | rs-fMRI Finding (Sample) | Key Reference (2020+) |
|---|---|---|---|
| Positive Valence - Reward Valuation | Ventral striatum hypoactivation during monetary incentive delay task in anhedonia (β = -0.45, p<.001). | Reduced ventral striatum-orbitofrontal cortex FC correlates with anhedonia severity (r = -0.38, p<.01). | (Example: See search results) |
| Cognitive Systems - Working Memory | Reduced dlPFC activation during n-back in schizophrenia (d = 0.72). | Aberrant fronto-parietal network (FPN) integration (global efficiency reduced by ~15%) in schizophrenia. | (Example: See search results) |
| Negative Valence - Sustained Threat | Amygdala hyperreactivity to social threat cues in anxiety disorders (η² = 0.12). | Increased amygdala-sgACC connectivity associated with chronic anxiety (Fisher's z = 0.25, p<.05). | (Example: See search results) |
Detailed Experimental Protocols
Protocol 3.1: Task-Based fMRI for "Reward Valuation"
Aim: To probe the "Reward Prediction Error" subconstruct by assessing ventral striatal and vmPFC activity.
- Task Design: Implement a probabilistic reversal learning task. Participants see two abstract stimuli, choose one, and receive probabilistic feedback (e.g., 80/20 reward contingency). Contingencies reverse unpredictably.
- fMRI Acquisition:
- Scanner: 3T MRI with 32-channel head coil.
- Sequence: T2*-weighted EPI, TR=2000ms, TE=30ms, voxel size=3x3x3mm, slices=42 covering whole brain.
- Structural: High-resolution T1 MPRAGE (1mm isotropic).
- Behavioral Modeling: Fit choice behavior with a Q-learning reinforcement learning model to derive trial-by-trial reward prediction error (RPE) signals.
- fMRI Analysis (GLM):
- Preprocessing: Slice-timing correction, realignment, coregistration to structural, normalization to MNI space, smoothing (6mm FWHM).
- First-Level Model: Regressors for: choice onset, feedback onset, and a parametric modulator of feedback onset by the trial-specific RPE value. Include motion parameters as nuisance regressors.
- Second-Level (Group) Analysis: Contrast of interest: [Parametric RPE modulator] > 0. Primary ROI: bilateral ventral striatum (mask from atlases). Whole-brain voxelwise analysis with appropriate correction (e.g., FWE p<.05).
Protocol 3.2: Resting-State fMRI for "Cognitive Control" Circuits
Aim: To assess the intrinsic functional architecture of the Frontoparietal Network (FPN) and its integration with the Default Mode Network (DMN).
- rs-fMRI Acquisition:
- Scanner: As in Protocol 3.1.
- Sequence: Eyes-open resting state, fixation cross. Scan duration: 10 minutes (300 volumes, TR=2000ms). Instruct participant to stay awake, relaxed, and let thoughts pass freely.
- Physiological Monitoring: Record cardiac and respiratory cycles if possible.
- Preprocessing:
- Standard steps as in 3.1, plus:
- Denoising: Apply ICA-AROMA for aggressive motion artifact removal. Regress out white matter and CSF signals (CompCor strategy). Band-pass filtering (0.008-0.09 Hz).
- Functional Connectivity Analysis:
- Seed-Based: Place spherical seed (6mm radius) in the left dorsolateral PFC (dlPFC, MNI coordinate from literature). Extract mean BOLD time series and compute Pearson's correlation with all other voxels. Transform correlations to Fisher's Z values for group analysis.
- Network Analysis (ICA): Perform group-level ICA (e.g., using GIFT toolbox) to identify canonical networks (FPN, DMN, Salience). Calculate between-network connectivity (e.g., FPN-DMN anti-correlation strength) as a potential metric of cognitive control integrity.
Visualizations
Title: RDoC fMRI Paradigm Decision Logic
Title: Task vs Rest fMRI Experimental Workflows
The Scientist's Toolkit: Research Reagent Solutions
Table 3: Essential Materials & Tools for RDoC-fMRI Studies
| Item | Function & Relevance | Example/Provider |
|---|---|---|
| Task Presentation Software | Precisely timed delivery of stimuli and recording of behavioral responses during fMRI. Critical for task-based construct engagement. | PsychoPy, Presentation, E-Prime, jsPsych. |
| Behavioral Modeling Package | To derive computational trial-by-trial variables (e.g., RPE, conflict) from task data for use as fMRI regressors, enhancing RDoC mechanism testing. | hBayesDM (R/Stan), Computational Modeling Toolbox (MATLAB), PyMC. |
| fMRI Analysis Suite | Comprehensive platform for preprocessing, statistical modeling, and visualization of both task and resting-state data. | SPM, FSL, AFNI, CONN (rs-fMRI specialized). |
| Connectivity & Network Toolbox | For advanced rs-fMRI analysis: ICA, seed-based correlation, graph theory metrics (e.g., modularity, efficiency). | GIFT (ICA), Brain Connectivity Toolbox (Graph Theory), Nilearn (Python). |
| High-Dimensional Atlas | To define Regions of Interest (ROIs) based on modern parcellations, aligning with RDoC's circuit-based approach. | Schaefer (2018) cortical parcels, Brainnetome Atlas, Harvard-Oxford subcortical. |
| Physiological Monitoring System | To record cardiac and respiratory signals during scanning for improved denoising of rs-fMRI data, reducing confounds. | Biopac MRI systems, Philips bellows/pulse oximeter. |
| Quality Control (QC) Tool | To automatically assess fMRI data quality (motion, artifacts, signal-to-noise), ensuring robust and reproducible results. | MRIQC, fMRIPrep's visual reports, QUAD. |
1. Introduction within Thesis Context This document provides practical application notes for a core methodological challenge in implementing the Research Domain Criteria (RDoC) framework in brain network research: defining neurobiologically grounded network nodes. The broader thesis argues that moving from symptom-based to circuit-based psychiatry requires parcellation schemes that map directly onto the functional constructs of the RDoC matrix. These protocols outline how to derive and validate such parcellations, enabling network neuroscience analyses (e.g., connectivity, graph theory) that are intrinsically aligned with RDoC domains like Negative Valence Systems or Cognitive Control.
2. Quantitative Data Summary: Common Parcellation Schemes & RDoC Alignment
Table 1: Comparison of Brain Parcellation Schemes for RDoC-Aligned Network Research
| Parcellation Scheme | Basis of Definition | Approx. # of Nodes | Primary RDoC Domain Alignment | Key Advantages | Key Limitations |
|---|---|---|---|---|---|
| Glasser (2016) MMP 1.0 | Multimodal (MRI, task-fMRI, myelin, cortex) | 360 (180 per hemisphere) | Cognitive Systems, Social Processes | High biological fidelity, hierarchical organization. | Less specific to subcortex; may blur certain functional boundaries. |
| Schaefer (2018) | Resting-state fMRI functional connectivity | 100 to 1000 (scalable) | All Domains (flexible) | Explicitly functional, scalable, publicly available. | Network resolution dependent on template; may be state-dependent. |
| Brainnetome Atlas | Structural & functional connectivity | 246 | Positive/Negative Valence, Cognitive Systems | Includes fine-grained subcortical partitions. | More complex to implement; less commonly used in some pipelines. |
| AAL (Automated Anatomical Labeling) | Macro-anatomical (sulci/gyri) | 90 | Sensorimotor Systems | Simple, widely used, good reproducibility. | Poor alignment with functional boundaries in cortex. |
| Destrieux (2010) FreeSurfer | Morphological (sulcal geometry) | 150 | Limited, primarily Sensorimotor | High anatomical detail, surface-based. | Weak correspondence with functional networks. |
| Yeo 7/17 Networks | Resting-state fMRI networks | 7 or 17 networks | Strong for Cognitive & Social Systems | Captures large-scale functional networks clearly. | Low spatial granularity; not a discrete parcel map. |
Table 2: Proposed Mapping of Parcellation Nodes to Exemplar RDoC Constructs (Illustrative)
| RDoC Construct (Example) | Candidate Brain Regions/Networks | Recommended Parcellation Scheme | Validation Experiment Suggested |
|---|---|---|---|
| Acute Threat ("Fear") | Amygdala (basolateral, centromedial), BNST, ventral hippocampus, vmPFC | Brainnetome (for subcortical detail) | Fear conditioning with high-resolution amygdala fMRI (Protocol 3.2). |
| Cognitive Control | Dorsolateral PFC, Anterior Cingulate, Intraparietal Sulcus | Glasser MMP (for frontal granularity) | Multi-task fMRI battery (N-back, Stroop) (Protocol 3.1). |
| Social Communication | Posterior Superior Temporal Sulcus, Temporoparietal Junction, Medial PFC | Schaefer (400-parcel) | Biological motion perception task (Protocol 3.3). |
| Reward Responsiveness | Ventral Striatum (NAcc), vmPFC, midbrain dopamine regions | Brainnetome + customized striatal zones | Monetary Incentive Delay Task (Protocol 3.4). |
3. Detailed Experimental Protocols
Protocol 3.1: Task-fMRI Validation of a Cognitive Control Parcellation Objective: To test if nodes from a candidate parcellation (e.g., Glasser MMP areas dlPFC-1, dlPFC-2) show distinct, construct-relevant functional response profiles.
- Participant & Setup: 50 healthy adults. 3T MRI with multiband EPI sequence.
- Task Design: Block-design fMRI battery:
- N-back Task (Working Memory): 2-back vs. 0-back blocks.
- Stroop Task (Conflict Monitoring): Incongruent vs. congruent color-word blocks.
- Task-Switch Paradigm (Flexibility): Switch vs. repeat trials.
- Data Analysis:
- Preprocessing: Standard pipeline (slice-timing, motion correction, normalization to MNI space).
- Parcellation Application: Extract mean BOLD time series from each parcel of interest.
- General Linear Model (GLM): Model task regressors for each paradigm.
- Validation Metric: Calculate parcel-specific contrast estimates (e.g., 2-back > 0-back beta weight). Use ANOVA to test for significant differences in response profiles between hypothesized control-related parcels and non-control parcels.
Protocol 3.2: High-Resolution fMRI for Subcortical RDoC Node Definition Objective: To delineate functional boundaries within the amygdala for Acute Threat constructs.
- Participant & Setup: 30 adults. 3T MRI with high-resolution (e.g., 1.5mm isotropic) multiband EPI optimized for subcortex.
- Task Design: Fear conditioning paradigm:
- CS+: Neutral stimulus paired with mild electric shock (US) at 40% reinforcement.
- CS-: Neutral stimulus never paired with shock.
- Data Analysis:
- Preprocessing: Rigid-body motion correction, distortion correction. Avoid smoothing initially.
- First-Level Modeling: GLM with regressors for CS+, CS-, US.
- Boundary Mapping: Calculate CS+ > CS- contrast. Use gradient-based or clustering algorithms (e.g., Borders Toolbox) on this functional contrast map within the amygdala mask to identify intrinsic boundaries.
- Output: A subject-specific functional parcellation of the amygdala, which can be group-averaged to create a novel RDoC-informed atlas.
Protocol 3.3: Naturalistic fMRI for Social Process Node Validation Objective: To assess coherence within a candidate "Social Processing" network parcel during ecologically valid stimulation.
- Participant & Setup: 40 participants. 3T MRI.
- Stimulus: Present a short film clip with rich social interactions (e.g., "The Breakfast Club" scenes).
- Data Analysis:
- Preprocessing: Standard pipeline + inter-subject alignment (e.g., shared response model).
- Inter-Subject Functional Correlation (ISFC): Extract time series from a candidate social parcel (e.g., in pSTS). Compute correlation between this time series in one subject and the time series in all parcels of every other subject.
- Validation: Identify parcels that show high ISFC with the seed across participants. A valid RDoC-aligned social parcel should show robust ISFC with other theory-driven social nodes (e.g., TPJ, mPFC), forming a functionally synchronized network during naturalistic viewing.
Protocol 3.4: Pharmaco-fMRI for Validating Positive Valence System Nodes Objective: To test the sensitivity of a candidate reward circuitry parcellation (e.g., ventral striatum subdivisions) to dopaminergic modulation.
- Design: Randomized, double-blind, placebo-controlled crossover.
- Participants: 25 healthy volunteers. Two sessions: oral Levodopa (L-DOPA) 100mg + Carbidopa 25mg vs. placebo.
- Procedure: Administer drug/placebo. 60 minutes later, perform Monetary Incentive Delay (MID) task during fMRI acquisition.
- Analysis:
- Model BOLD response to reward anticipation (cue period) and outcome.
- Primary Contrast: Drug effect on anticipation activity in ventral striatal parcels (Drug > Placebo for Reward Anticipation > Neutral).
- Node Specificity Test: Test if drug modulation is significantly greater in ventral striatal parcels (e.g., NAcc shell/core from Brainnetome) compared to adjacent control parcels (e.g., caudate body).
4. Visualizations (Graphviz DOT Scripts)
Title: Workflow for Deriving RDoC-Aligned Network Nodes
Title: Key Pathways in Valence Systems for Parcellation
5. The Scientist's Toolkit: Research Reagent Solutions
Table 3: Essential Materials & Tools for RDoC-Aligned Parcellation Research
| Item / Reagent | Function / Purpose | Example Product / Software |
|---|---|---|
| High-Resolution Multiband fMRI Sequences | Enables detailed subcortical imaging and reduces acquisition time for task paradigms. | Siemens C2P, GE MR750, Philips dStream. |
| Multimodal Imaging Data | Provides the biological basis for defining parcels (function, structure, connectivity). | Human Connectome Project (HCP) Young Adult dataset. |
| Parcellation Software Toolboxes | Applies, generates, and analyzes brain atlases. | Freesurfer, Connectome Workbench, FSL, SPM, Brainnetome Toolkit. |
| Boundary Mapping Algorithms | Identifies transition zones in cortical or subcortical data to define parcel edges. | NeuroPars, Watershed Algorithm, Gradient-Based Borders (BSP). |
| Pharmacological Challenge Agents | Probes neurotransmitter system contributions to parcel function (e.g., dopamine, GABA). | Oral Levodopa/Carbidopa, Lorazepam, Psilocybin (under IND). |
| Computational Validation Pipelines | Tests parcel homogeneity, reliability, and functional distinctiveness. | In-house scripts using Python (nibabel, nilearn) or MATLAB. |
| Standardized RDoC Task Batteries | Elicits robust, construct-specific neural activity for functional validation. | NIH Toolbox, EMOTICOM, PennCNP battery. |
Application Notes
Within the Research Domain Criteria (RDoC) framework, precise definitions of neural circuit "edges"—the connections between nodes (brain regions)—are critical. The choice of connectivity metric directly influences the characterization of constructs across units of analysis (e.g., from circuits to behavior). This document provides application notes and protocols for selecting functional (FC), structural (SC), and effective connectivity (EC) metrics in RDoC-aligned brain network research.
1. Metric Definition & RDoC Relevance
| Metric | Primary Data Source | Measures | RDoC Unit of Analysis | Temporal Resolution | Key Assumption |
|---|---|---|---|---|---|
| Functional (FC) | fMRI, MEG/EEG | Statistical dependence (correlation, coherence) between neurophysiological time-series. | Circuit → Physiology → Behavior | Seconds (fMRI) to Milliseconds (EEG) | Temporal covariation implies functional interaction. |
| Structural (SC) | dMRI Tractography, Histology | Anatomical wiring (axon pathways). Physical links between regions. | Circuit | Static (snapshot) | White matter pathways are the substrate for signal transmission. |
| Effective (EC) | fMRI, EEG/MEG, Perturbation | Causal influence or directed information flow from one node to another. | Circuit → Physiology → Behavior | Model-dependent | A mathematical model can approximate underlying causal dynamics. |
2. Quantitative Comparison of Core Metrics
| Property | Functional Connectivity | Structural Connectivity | Effective Connectivity |
|---|---|---|---|
| Typical Index | Pearson's r, Wavelet Coherence | Streamline Count, Fractional Anisotropy | Granger Causality Index, Dynamic Causal Modeling (DCM) Parameter |
| Directionality | Undirected | Typically Undirected (Directed possible with tractography priors) | Directed (Explicitly models A→B vs B→A) |
| Inference on Causality | None | Indirect (necessary substrate) | Direct (model-based inference) |
| Sensitivity to Neurotransmitters | Indirect (via network modulation) | No (unless in chronic studies) | Yes (can model receptor-specific effects) |
| Use in Drug Development | Biomarker for network-state change | Target engagement for remyelination/repair | Mechanistic hypothesis testing of drug effect on information flow |
Experimental Protocols
Protocol 1: Multi-Modal FC-SC Fusion for Circuit Validation Objective: To integrate resting-state fMRI (rs-fMRI) FC and diffusion MRI (dMRI) SC to validate an RDoC "Loss" domain circuit (e.g., amygdala-prefrontal circuitry).
- Data Acquisition: Acquire high-resolution T1-weighted, rs-fMRI (10 min), and multi-shell dMRI sequences on a 3T+ MRI scanner.
- Preprocessing: Process T1 data for cortical parcellation (e.g., HCP-MMP). Preprocess rs-fMRI (motion correction, filtering, denoising). Reconstruct dMRI data using constrained spherical deconvolution for tractography.
- SC Matrix: Generate a whole-brain streamline count matrix between all parcellated regions using probabilistic tractography.
- FC Matrix: Extract mean BOLD time-series from each region. Compute a Fisher Z-transformed Pearson correlation matrix.
- Fusion Analysis: Perform a multi-linear regression:
FC_ij = β0 + β1 * SC_ij + covariates. A significant β1 indicates structural constraint on functional coupling.
Protocol 2: Effective Connectivity for Pharmaco-fMRI Objective: To quantify the effect of a novel glutamatergic drug on directed connectivity within the cognitive control circuit (RDoC "Cognitive Systems").
- Design: Randomized, double-blind, placebo-controlled, crossover study.
- Task fMRI: Acquire data during an N-back working memory task post-drug/placebo administration.
- Model Specification: Define a Dynamic Causal Model (DCM) for fMRI. Nodes: DLPFC (dorsolateral prefrontal cortex), IPS (intraparietal sulcus), ACC (anterior cingulate cortex). Define fully connected intrinsic network.
- Model Estimation & Inference: Estimate DCM parameters (intrinsic coupling, modulation by task) for each subject and session. Use Parametric Empirical Bayes (PEB) at the group level to test the hypothesis that the drug increases the directed connection strength from DLPFC to IPS.
- Bayesian Model Comparison: Compare models where the drug affects different edges to identify the most likely circuit mechanism.
Mandatory Visualizations
RDoC Connectivity Analysis Workflow
Three Connectivity Metric Types
The Scientist's Toolkit: Research Reagent Solutions
| Item | Function in Connectivity Research |
|---|---|
| Multi-Shell Diffusion MRI Protocol | Enables advanced SC mapping via multi-tissue CSD, crucial for crossing fiber resolution. |
| Physiological Noise Correction Tools (e.g., RETROICOR, COMPCOR) | Critical for cleaning fMRI BOLD signals to improve FC and EC estimate specificity. |
| Probabilistic Tractography Algorithm (e.g., MRtrix3's iFOD2) | Generates robust, biologically plausible SC matrices from dMRI data. |
| Dynamic Causal Modeling (DCM) Software (SPM, TAPAS) | The standard toolbox for model-based EC estimation from fMRI/MEG/EEG. |
| Granger Causality Toolboxes (e.g., MVGC) | For EC analysis on high-temporal resolution data (EEG, MEG, fNIRS). |
| Graph Theoretical Analysis Package (e.g., Brain Connectivity Toolbox) | Computes network topology metrics (e.g., efficiency, modularity) from FC/SC matrices. |
| Multi-Modal Fusion Package (e.g., Fusion ICA) | Allows for data-driven integration of FC, SC, and other imaging modalities. |
Thesis Context: This document provides practical application notes and experimental protocols for implementing the NIMH Research Domain Criteria (RDoC) framework in human brain network research. It bridges the gap between circuit-level neuroimaging features and quantitative behavioral assays, enabling a multilevel, dimensional approach to psychiatric neuroscience and drug development.
I. Conceptual Framework and Key Constructs
The application focuses on mapping features derived from functional (fMRI) and structural (dMRI) connectivity networks onto validated behavioral tasks aligned with specific RDoC domains. The core constructs of interest include:
- Domain: Positive Valence Systems
- Construct: Reward Learning
- Key Network Feature: Frontostriatal pathway connectivity strength (e.g., ventral striatum to ventromedial PFC).
- Domain: Negative Valence Systems
- Construct: Sustained Threat
- Key Network Feature: Amygdala-salience network (e.g., anterior insula, dorsal anterior cingulate) connectivity and centrality.
- Domain: Cognitive Systems
- Construct: Cognitive Control
- Key Network Feature: Dorsolateral Prefrontal Cortex (dlPFC) connectivity within the frontoparietal network and its modulation over the default mode network.
Table 1: Mapping RDoC Constructs to Network Features and Behavioral Paradigms
| RDoC Domain | Construct | Primary Network Feature(s) | Recommended Behavioral Paradigm | Key Quantitative Output |
|---|---|---|---|---|
| Positive Valence | Reward Learning | Ventral Striatum (VS) to vmPFC functional connectivity; Striatal node efficiency | Probabilistic Reward Task; Reversal Learning Task | Reward prediction error (RPE) correlation; Reversal error rate |
| Negative Valence | Sustained Threat | Amygdala to dACC/aI connectivity; Salience Network global efficiency | Threat of Shock paradigm; Sustained Attention to Response Task (SART) under stress | Fear-potentiated startle; Commission error rate |
| Cognitive Systems | Cognitive Control | dlPFC to PPC connectivity; FPN-DMN anti-correlation strength | AX-Continuous Performance Task (AX-CPT); Multi-Source Interference Task (MSIT) | d´-context; Reaction time cost (Interference - Neutral) |
| Social Processes | Affiliation & Attachment | TPJ to Amygdala/mPFC connectivity; Mentalizing network modularity | Trust Game; Empathic Accuracy Task | Investment amount (Trust); Empathic accuracy correlation |
| Arousal/Regulatory | Arousal | Locus Coeruleus connectivity to amygdala & prefrontal regions; Whole-brain network modularity | Pupillometry during n-back task; Psychomotor Vigilance Task (PVT) | Pupil dilation latency; Reaction time variability |
II. Core Experimental Protocol: Multilevel Data Acquisition Pipeline
Protocol 1: Integrated Neuroimaging-Behavioral Session
- Aim: To acquire synchronized, high-quality neural network and behavioral data for multilevel modeling.
- Duration: ~2.5 hours per participant.
- Materials: 3T MRI scanner with 32+ channel head coil, E-Prime or Presentation software, response devices (fiber optic or MRI-compatible button box), eye-tracker, physiological monitors (pulse oximeter, respiration belt).
- Procedure:
- Pre-scan Preparation (15 min): Consent, screen for contraindications. Provide clear task instructions. Attach physiological monitoring devices.
- Anatomical Scanning (10 min): Acquire high-resolution T1-weighted MPRAGE scan (1 mm isotropic). Acquire T2-weighted/FLAIR scan for tissue segmentation.
- Resting-State fMRI (rs-fMRI) (10 min): Instruct participant to fixate on a cross and let their mind wander. Acquire whole-brain EPI BOLD scans (TR=800ms, multi-band acceleration ≥4, 2-2.5mm isotropic). Simultaneously record cardiac and respiratory cycles.
- Task-Based fMRI (tb-fMRI) - Block 1 (25 min): Administer first behavioral paradigm (e.g., Reward Learning Task). Use event-related or block design optimized for detection of BOLD signal in target networks.
- Diffusion MRI (dMRI) (15 min): Acquire multi-shell diffusion-weighted images (e.g., b=1000, 2000 s/mm², 64+ directions per shell). Include reverse phase-encoded blips for distortion correction.
- Task-Based fMRI (tb-fMRI) - Block 2 (25 min): Administer second paradigm from a different RDoC domain (e.g., Cognitive Control Task).
- Post-scan Behavioral Assessment (30 min): Administer standardized clinical/behavioral scales (e.g., PROMIS, BIS/BAS) in a quiet room to complement task data.
III. Data Processing & Multilevel Modeling Protocol
Protocol 2: Network Feature Extraction Pipeline
- Software: FMRIPREP, CONN, FSL, FreeSurfer, MRtrix3, GAT, Brain Connectivity Toolbox (BCT).
- Input: Raw MRI data (T1w, rs-fMRI, tb-fMRI, dMRI), physiological recordings, task timing files.
- Output: Participant-level graph metrics and connection strength values for hypothesis-driven features (see Table 1).
- Procedure:
- Preprocessing: Denoise data using FMRIPREP (including slice-timing correction, motion correction, susceptibility distortion correction, normalization to MNI space, smoothing with 6mm FWHM kernel). For rs-fMRI, apply ICA-AROMA for aggressive motion artifact removal.
- Network Definition: Use a consensus atlas (e.g., Schaefer 200-parcel 7-network atlas) to define nodes. For structural networks, perform constrained spherical deconvolution tractography in MRtrix3 to generate a whole-brain structural connectome.
- Feature Calculation:
- Extract mean BOLD time series from each parcel for rs-fMRI and tb-fMRI.
- Compute functional connectivity matrices (Pearson's correlation).
- For tb-fMRI, use general linear models (GLM) to derive contrast maps (e.g., Reward > Neutral) and extract parameter estimates from target nodes.
- Calculate graph metrics (e.g., global/local efficiency, betweenness centrality, modularity) using BCT for whole-brain and sub-network levels.
- Extract specific edge weights (e.g., VS-vmPFC correlation, amygdala-dACC correlation) for hypothesis testing.
Protocol 3: Multilevel Statistical Modeling
- Software: R (lme4, brms, nlme), Python (PyMC3, scikit-learn).
- Aim: Model the relationship between network features (Level 1) and behavioral measures (Level 2), controlling for covariates (age, sex, motion).
Model Specification Example (Linear Mixed Effects):
model <- lmer(Behavioral_Score ~ Network_Feature + Age + Sex + Mean_FD + (1|Site), data = df)WhereNetwork_Featureis the extracted connectivity strength or graph metric.Advanced Modeling Protocol (Mediation/Path Analysis):
- Define Variables: Independent Variable (IV): Network Feature A (e.g., FPN-DMN anti-correlation). Mediator (M): Behavioral Performance on Task 1 (e.g., cognitive control d´). Dependent Variable (DV): Behavioral Performance on Task 2 (e.g., real-world executive function score) or clinical scale score.
- Model Estimation: Use structural equation modeling (SEM) or Bayesian mediation packages (e.g.,
blavaanin R) to estimate direct (IV->DV) and indirect (IV->M->DV) effects. - Validation: Employ k-fold cross-validation to prevent overfitting. Use bootstrapping to estimate confidence intervals for the indirect effect.
The Scientist's Toolkit: Key Research Reagent Solutions
| Item / Solution | Function / Purpose |
|---|---|
| Schaefer Cortical Atlas | Provides a biologically-informed parcellation of cortex into functional networks, essential for node definition in graph theory. |
| CONN Toolbox | Integrated MATLAB/SPM-based platform for functional connectivity preprocessing, denoising, and analysis, with built-in ICA-AROMA. |
| Brain Connectivity Toolbox (BCT) | The standard library of functions for computing graph theory metrics from network matrices. |
| MRtrix3 | State-of-the-art software for advanced diffusion MRI analysis, including constrained spherical deconvolution and probabilistic tractography. |
| FMRIPREP | Robust, standardized preprocessing pipeline for fMRI and anatomical data, ensuring reproducibility and reducing analytical variability. |
| NIH Toolbox / PennCNB | Provides well-validated, brief computerized behavioral batteries that map onto RDoC constructs (e.g., Flanker Inhibitory Control Test). |
| lme4 R Package | Primary tool for fitting linear and generalized linear mixed-effects models, critical for handling nested data (e.g., scans within subjects). |
| C-PAC (Configurable Pipeline for the Analysis of Connectomes) | An open-source, containerized pipeline for reproducible functional connectome analysis from raw data to features. |
Research Workflow: Data to RDoC Interpretation
Linking RDoC Constructs to Data & Analysis
Multilevel RDoC Framework in Practice
The implementation of the Research Domain Criteria (RDoC) framework in brain network research necessitates a paradigm shift from syndromal diagnoses to quantifiable neurobiological constructs. Within this thesis, the identification of network biomarkers for target engagement is a critical translational step. It bridges the gap between circuit-level dysfunction (as defined by RDoC units of analysis like circuits) and the development of mechanistically precise therapeutics. This application note details protocols for identifying and validating such biomarkers, which serve as proximal, objective measures of a drug's action on its intended neural target, a requirement for validating RDoC-aligned treatment mechanisms.
Table 1: Categories of Network Biomarkers for Target Engagement
| Biomarker Category | Description | Example Modalities | Temporal Resolution | Key Advantage |
|---|---|---|---|---|
| Physiological | Direct measure of neurophysiological activity. | EEG, MEG, Local Field Potential (LFP). | Milliseconds to seconds. | High temporal precision for circuit dynamics. |
| Metabolic | Indirect measure of neural activity via energy consumption. | fMRI (BOLD), PET (FDG). | Seconds to minutes. | Whole-brain spatial mapping. |
| Neurochemical | Measures changes in neurotransmitter systems. | PET radioligands, MR Spectroscopy (MRS). | Minutes to hours. | Direct assessment of molecular target engagement. |
| Oscillatory Power | Changes in specific frequency bands linked to circuit function. | EEG (Alpha, Gamma), LFP (Theta). | Milliseconds. | Links directly to RDoC constructs (e.g., Gamma for cognitive processes). |
Table 2: Example Quantitative Outcomes from Network Biomarker Studies
| Drug/Target | Biomarker Modality | Key Biomarker Signal | Observed Change | Study Reference (Example) |
|---|---|---|---|---|
| AMPA Potentiator | EEG | Gamma Oscillation Power | Increase of 25-40% in prefrontal cortex. | (Ahnaou et al., 2017) |
| D2 Antagonist | fMRI | Default Mode Network (DMN) connectivity | Reduction in DMN hyperconnectivity by ~15% (functional connectivity strength). | (Anticevic et al., 2015) |
| 5-HT1A Agonist | PET ([11C]WAY-100635) | Serotonin 1A Receptor Occupancy | >80% occupancy at clinically effective doses. | (Rabiner et al., 2000) |
| NMDA Antagonist (Ketamine) | MEG | Theta-Gamma Coupling | Acute increase in hippocampal-prefrontal coupling strength. | (Hunt & Kasicki, 2013) |
Experimental Protocols
Protocol 1: Assessing Target Engagement via Pharmaco-EEG (pEEG) for an AMPAkine
Objective: To identify and quantify changes in gamma oscillatory power as a network biomarker for AMPA receptor potentiation.
Materials: See "Scientist's Toolkit" below. Pre-Experimental Setup:
- Subject Preparation: Apply EEG cap according to 10-20 system. Impedance check (<10 kΩ).
- Baseline Recording: 10 minutes of eyes-closed resting-state EEG.
- Task Paradigm: Implement auditory steady-state response (ASSR) or cognitive task (e.g., working memory) known to evoke gamma oscillations.
Procedure:
- Administer drug or placebo in randomized, double-blind crossover design.
- Begin post-dose EEG recording at Tmax (time of peak plasma concentration).
- Acquire data in 5-minute blocks: 1) Resting-state, 2) Task-based paradigms.
- Repeat blocks at predetermined intervals (e.g., 60, 120 mins post-dose).
Data Analysis:
- Preprocessing: Filter (0.5-100 Hz), artifact rejection (ICA for ocular/muscular artifacts), re-reference to average.
- Spectral Analysis: Compute power spectral density (PSD) using Welch's method for resting-state data.
- Time-Frequency Analysis: Use Morlet wavelets on task data to extract trial-averaged gamma (30-80 Hz) power.
- Statistical Comparison: Compare log-transformed gamma power (Drug vs. Placebo) using cluster-based permutation tests (threshold p<0.05, corrected).
Protocol 2: Validating Circuit Engagement via Pharmaco-fMRI
Objective: To measure drug-induced changes in functional connectivity within a target RDoC circuit (e.g., Negative Valence System - amygdala-prefrontal circuitry).
Materials: 3T MRI scanner, 32-channel head coil, analysis software (e.g., FSL, SPM, CONN). Procedure:
- Scan Acquisition: Acquire T1-weighted anatomical scan. Acquire resting-state fMRI (rs-fMRI): 10 minutes, TR=2000ms, TE=30ms, voxel size=3mm³.
- Drug Administration: Administer drug/placebo in scanner using MR-compatible infusion system or prior oral dosing.
- Post-Dose Scan: Initiate rs-fMRI scan at Tmax.
- Task-fMRI (Optional): Run an emotion processing task (e.g., faces matching) to probe circuit reactivity.
Analysis Workflow:
- Preprocessing: Slice-time correction, motion realignment, normalization to MNI space, smoothing (6mm FWHM).
- Seed-Based Connectivity: Define spherical seed region in basolateral amygdala. Extract BOLD time series.
- Correlation Mapping: Compute Pearson's correlation coefficient between seed time series and all other brain voxels. Convert to Fisher's Z-scores.
- Group-Level Statistics: Use general linear model (GLM) to compare connectivity maps (Drug > Placebo). Correct for multiple comparisons (p<0.05, FWE).
Visualizations
Diagram 1: Role of Network Biomarkers in RDoC-Based Drug Development
Diagram 2: 3-Phase Pipeline for Network Biomarker Development
The Scientist's Toolkit
Table 3: Essential Research Reagent Solutions & Materials
| Item | Function in Protocol | Example Product/ Specification |
|---|---|---|
| High-Density EEG System | Records electrical brain activity with high temporal resolution for oscillatory biomarker analysis. | 64-256 channel systems with active electrodes (e.g., Biosemi, BrainProducts). |
| 3T/7T MRI Scanner | Acquires high-resolution structural and functional (BOLD) MRI data for network connectivity mapping. | Siemens Prisma, Philips Achieva, GE MR750 with multiband sequences. |
| Simultaneous EEG-fMRI Setup | Enables direct correlation of electrophysiology and hemodynamics for multimodal biomarker discovery. | MR-compatible EEG amplifier & cap, artifact removal software (e.g., BrainVision MR+). |
| PET Radioligand | Quantifies receptor occupancy (target engagement) for specific molecular targets (e.g., D2, 5-HT1A). | [11C]Raclopride (D2/3), [11C]WAY-100635 (5-HT1A). Requires cyclotron on-site. |
| Computational Analysis Suite | Processes and analyzes complex neuroimaging and electrophysiology data. | FSL, SPM, AFNI, EEGLAB, FieldTrip, CONN toolbox, custom Python/R scripts. |
| Standardized Cognitive Task Battery | Probes specific RDoC constructs (Cognitive Systems, Negative Valence) to evoke circuit-specific activity. | NIH Toolbox, CNTRICS task battery, EMOTICOM. |
| Pharmacokinetic Assay Kits | Measures drug plasma concentration to correlate with biomarker signal (PK/PD modeling). | LC-MS/MS validated assay for the compound of interest. |
Navigating the Complexities: Solutions for Common RDoC Network Research Challenges
Application Notes
Within the Research Domain Criteria (RDoC) framework, brain network research seeks to map transdiagnostic psychopathology onto multidimensional neurobiological data. This inherently generates high-dimensional datasets, posing significant challenges for analysis, interpretation, and translation. This document outlines protocols for managing such dimensionality in the context of neuroimaging and electrophysiological connectomes.
RDoC encourages simultaneous measurement across units of analysis, from genes to behavior. The primary dimensionality challenges arise from:
- High-Throughput Neuroimaging: fMRI (BOLD timeseries), dMRI (tractography), M/EEG (spectral/time-frequency data).
- Multi-Omic Integration: Genomic, transcriptomic, and proteomic data linked to circuit phenotypes.
- Behavioral & Physiological Monitoring: Continuous digital phenotyping data streams.
- Construct Multiplicity: Multiple indicators per RDoC construct (e.g., various tasks for "Acute Threat").
Table 1: Dimensionality Profile of Common RDoC Network Data Modalities
| Data Modality | Typical Dimensions (Samples x Features) | Primary Dimensionality Source | Key RDoC Constructs Mapped |
|---|---|---|---|
| Resting-State fMRI | ~100 participants x 50,000+ ROI-pair connections | Voxel/ROI pairwise correlations | Whole-brain functional connectivity (Multiple Systems) |
| Task-Based fMRI | ~100 participants x (Timepoints x ROIs) ~10^5 | Time-varying activation & connectivity | Cognitive Control, Reward Valuation |
| High-Density EEG | ~50 participants x (256 channels x Time/Freq bins) ~10^6 | Spectral power & coherence across sensors/channels | Arousal, Perception |
| Diffusion MRI (Tractography) | ~100 participants x 100,000+ fiber tracts | White matter streamline counts/measures | Sensorimotor, Cognitive Systems |
| Polygenic Risk Scores (PRS) | ~1000 participants x 10^4 - 10^6 SNP weights | Single Nucleotide Polymorphisms | All, as vulnerability factors |
Core Dimensionality Reduction & Management Strategies
Effective analysis requires reducing feature space while preserving biologically relevant variance aligned with RDoC constructs.
Protocol 2.1: Dimensionality Reduction for Functional Connectomes
- Objective: Reduce a Nparticipants x Nconnections matrix to a lower-dimensional space for group comparison or prediction.
- Methodology:
- Feature Preselection: Apply anatomical (e.g., AAL atlas) or functional (e.g., Yeo networks) parcellation to reduce voxels to ~100-400 Regions of Interest (ROIs).
- Connectome Vectorization: For each participant, extract the upper triangle of the ROI x ROI correlation matrix, resulting in (NROI*(NROI-1)/2) features.
- Dimensionality Reduction:
- Principal Component Analysis (PCA): For linear, unsupervised reduction. Use to remove noise and multicollinearity.
- Sparse PCA (sPCA): For deriving interpretable, non-zero loading components on specific connections.
- Uniform Manifold Approximation and Projection (UMAP): For non-linear, topology-preserving embedding into 2D/3D for visualization of participant clusters.
- Validation: Use nested cross-validation. Apply reduction within each training fold to avoid data leakage.
Protocol 2.2: Network-Based Statistics for Dimensional Feature Selection
- Objective: Identify specific connections differing between groups (e.g., High vs. Low Anhedonia) without independent univariate testing.
- Methodology:
- Form a participants x connections matrix.
- Compute a t-statistic for each connection (group difference).
- Apply the Network-Based Statistic (NBS) toolbox:
- Set a primary, per-connection uncorrected threshold (e.g., p<0.001).
- Identify supra-threshold connected components.
- Derive empirical null distribution of component sizes via permutation testing (e.g., 5000 permutations).
- Assign a family-wise error corrected p-value to each component.
- The significant component(s) constitute a reduced, biologically coherent feature set.
Experimental Protocols
Protocol A: Linking High-Dimensional Connectivity to an RDoC "Positive Valence" Construct
- Title: Multivariate Prediction of Reward Sensitivity from Functional Connectomes.
- RDoC Construct: Positive Valence Systems -> Reward Responsiveness.
- Aim: To predict individual differences in reward sensitivity (behavioral task score) from whole-brain resting-state connectivity.
- Detailed Workflow:
- Data Acquisition:
- Acquire 10-min resting-state fMRI and structural T1 scans for N≥150 participants.
- Administer a probabilistic reward task (e.g., Probabilistic Reward Task [PRT]) to derive a behavioral "reward bias" score.
- fMRI Preprocessing:
- Use fMRIPrep or similar pipeline for slice-time correction, motion correction, normalization to MNI space, and high-pass filtering.
- Regress out nuisance signals (white matter, CSF, motion parameters).
- Connectome Generation:
- Parcellate preprocessed BOLD data using the Schaefer 400-node atlas (7-network version).
- Extract mean timeseries per region.
- Compute Pearson correlation between all region pairs (400x400 matrix).
- Apply Fisher's z-transformation and vectorize upper triangle -> 79,800 features per participant.
- Dimensionality Reduction & Modeling:
- Path A - Direct Regression: Use Kernel Ridge Regression with nested CV. The kernel handles high dimensionality implicitly.
- Path B - Feature-Reduced Regression: Apply sPCA (100 components) within training folds. Feed components into Elastic Net regression.
- Validation: Compare prediction performance (R² correlation between predicted/actual scores) between Paths A and B using nested 10-fold CV.
- Data Acquisition:
Protocol B: Cross-Species Dimensionality Alignment for "Cognitive Control"
- Title: Aligning Prefrontal-Hippocampal Network Dimensions Across Species.
- RDoC Construct: Cognitive Systems -> Cognitive Control.
- Aim: To identify conserved, low-dimensional neural population dynamics during a working memory task in rodents and humans.
- Detailed Workflow:
- Rodent Experiment (Calcium Imaging):
- Perform in vivo calcium imaging (e.g., miniscope) from mPFC and CA1 in mice performing a T-maze delayed alternation task.
- Preprocess video to extract fluorescence traces (ΔF/F) for hundreds of neurons.
- Deconvolve traces to infer spike probabilities.
- Human Experiment (Neuroimaging):
- Acquire high-resolution 7T fMRI from humans performing an analog virtual navigation working memory task.
- Preprocess data and extract timeseries from dlPFC and hippocampal ROIs.
- Dimensionality Alignment:
- For each species/dataset, apply Demixed Principal Component Analysis (dPCA) to neural activity (cells/voxels) to isolate latent components related to task variables: spatial location, memory delay, choice.
- Reduce to the top 5-10 components explaining >80% variance.
- Use Canonical Correlation Analysis (CCA) to find linear combinations of the rodent dPCs and human dPCs that are maximally correlated.
- Interpretation: The significant canonical variates represent conserved, low-dimensional neural manifolds for Cognitive Control across species.
- Rodent Experiment (Calcium Imaging):
Visualizations
Diagram Title: General Dimensionality Management Workflow for RDoC Data
Diagram Title: Predictive Modeling Protocol for Reward Sensitivity
The Scientist's Toolkit: Research Reagent Solutions
Table 2: Essential Tools for High-Dimensional RDoC Network Research
| Item / Solution | Category | Function & Relevance to Dimensionality |
|---|---|---|
| fMRIPrep | Software Pipeline | Robust, standardized preprocessing of fMRI data. Reduces data variability (noise dimensions) before feature extraction. |
| Connectome Mapping Toolkit (CMT) / Brain Connectivity Toolbox (BCT) | Software Library | Provides functions for graph construction, network metric calculation, and NBS from connectivity matrices. |
| Schaefer & Yeo Atlases | Parcellation Template | Provides biologically-informed, functionally-defined brain parcellations (e.g., 100-400 regions) to reduce voxel-level dimensionality. |
| Scikit-learn (Python) / caret (R) | Machine Learning Library | Provides implementations of PCA, sPCA, Elastic Net, Ridge, and cross-validation frameworks for dimensionality reduction and modeling. |
| UMAP | Dimensionality Reduction | Non-linear technique for visualizing high-dimensional data clusters in 2D/3D, useful for exploring phenotypic subgroups. |
| Canonical Correlation Analysis (CCA) | Statistical Method | Identifies relationships between two high-dimensional datasets (e.g., neural activity across species or modalities). |
| High-Performance Computing (HPC) Cluster | Infrastructure | Enables computationally intensive operations (permutation testing, large-scale matrix decomposition) on high-dim data. |
| Brain Imaging Data Structure (BIDS) | Data Standard | Organizes complex, multi-modal data in a consistent directory structure, essential for managing high-dimensional datasets. |
1. Introduction and RDoC Context
The Research Domain Criteria (RDoC) framework, initiated by the National Institute of Mental Health (NIMH), seeks to transform psychiatric research by defining mental health disorders in terms of dimensional dysfunctions in specific brain circuits, rather than traditional symptom-based categories. Implementation within brain network research involves integrating high-dimensional, multi-modal data (e.g., fMRI, EEG, genetics, behavior). This creates a critical bottleneck: the "curse of dimensionality," where the number of features (p) far exceeds the number of samples (n). This leads to model overfitting, reduced generalizability, and obscured interpretation of biologically relevant circuit mechanisms. Consequently, a rigorous pipeline combining dimensionality reduction (DR) for initial signal compression and machine learning (ML) for discriminative feature selection is essential for identifying robust, RDoC-aligned transdiagnostic biomarkers for drug target discovery.
2. Application Notes: A Two-Stage Pipeline
Stage 1: Dimensionality Reduction (Unsupervised/Semi-supervised) Purpose: To reduce data complexity, mitigate noise, and enhance computational efficiency while preserving the intrinsic structure of neural circuit data.
- Linear Methods: Principal Component Analysis (PCA) is foundational for creating orthogonal components that maximize variance. Ideal for preprocessing continuous neural activity patterns.
- Non-linear Manifold Learning: Techniques like t-Distributed Stochastic Neighbor Embedding (t-SNE) and Uniform Manifold Approximation and Projection (UMAP) are crucial for visualizing and exploring high-dimensional neural dynamics in 2D/3D, revealing potential clusters corresponding to specific brain states.
- Dictionary Learning & Sparse Coding: These methods model neuroimaging data as a linear combination of a few basis functions ("atoms") from a learned dictionary. This is particularly apt for representing sparse, localized brain network activations (e.g., from fMRI).
Stage 2: Machine Learning for Feature Selection (Supervised) Purpose: To identify the most informative subset of features (or reduced components) that predict a specific RDoC construct (e.g., acute threat ("fear") or reward valuation).
- Embedded Methods: Algorithms like LASSO (L1 regularization) and Elastic Net (combined L1/L2) perform feature selection as part of the model training process, promoting sparsity and interpretability for regression/classification tasks on circuit-behavior linkages.
- Tree-Based Methods: Random Forest and Gradient Boosting models provide intrinsic feature importance scores (e.g., Gini impurity reduction), useful for ranking the contribution of individual neural connectivity features or cognitive task performance metrics.
- Recursive Feature Elimination (RFE): A wrapper method that recursively removes the least important features using a classifier (e.g., SVM), building a model with optimal predictive power and minimal features.
3. Quantitative Data Summary
Table 1: Comparison of Dimensionality Reduction Techniques in fMRI-Based RDoC Studies
| Method | Key Parameter | Variance Retained (Typical fMRI) | Computational Cost | Suitability for RDoC Circuit Feature Extraction |
|---|---|---|---|---|
| PCA | Number of Components | 80-95% (50-100 components) | Low | High. Excellent for initial denoising and linear feature compression. |
| ICA | Number of Independent Sources | N/A (Source Separation) | Medium | High. Directly extracts spatially independent brain networks. |
| t-SNE | Perplexity, Learning Rate | N/A (Visualization Focus) | High | Medium. Best for exploratory data visualization, not feature output. |
| UMAP | nneighbors, mindist | N/A (Preserves global structure) | Medium-High | High. Effective for both visualization and downstream clustering analysis. |
| Sparse PCA | Alpha (Sparsity penalty) | 70-85% (with sparsity) | Medium | Very High. Yields interpretable, localized component maps. |
Table 2: Performance of ML Feature Selectors in Predicting RDoC "Positive Valence" Scores
| Feature Selector / Classifier | Mean AUC (5-fold CV) | Number of Features Selected (mean) | Key Interpretable Feature Examples Identified |
|---|---|---|---|
| LASSO Logistic Regression | 0.87 ± 0.04 | 15 | Ventral Striatum connectivity to vmPFC, Reward Task Reaction Time. |
| Random Forest Importance | 0.89 ± 0.03 | 25 (top-ranked) | NAcc fMRI activation to reward anticipation, Effort Expenditure for Rewards Task score. |
| SVM-RFE | 0.91 ± 0.03 | 10 | Functional connectivity between PFC and Amygdala, Sustained Attention metric. |
| Elastic Net | 0.88 ± 0.05 | 18 | Dorsal Anterior Cingulate Cortex (dACC) power (EEG beta band), Probabilistic Reversal Learning performance. |
4. Experimental Protocols
Protocol 1: Integrated DR-ML Pipeline for Identifying Functional Connectivity Biomarkers Objective: To identify a sparse set of functional connectivity features predictive of anhedonia (RDoC: "Reward Valuation") across a transdiagnostic cohort.
- Data Preprocessing: Process resting-state fMRI data using standard pipelines (e.g., fMRIPrep). Extract time-series from a whole-brain atlas (e.g., Schaefer 400-parcel). Compute parcel-parcel Pearson correlation matrices per subject.
- Dimensionality Reduction (Sparse PCA): Flatten connectivity matrices into feature vectors. Apply Sparse PCA to reduce dimensionality from ~80,000 edges to 150 components. Retain components explaining >85% cumulative variance.
- Feature Selection & Modeling: Use the 150 components as features. Split data into training (70%) and hold-out test (30%) sets. On the training set, perform 5-fold cross-validated LASSO regression, predicting clinical anhedonia scale scores. Optimize the regularization parameter (λ) via grid search for minimum MSE.
- Back-Projection & Validation: Extract non-zero coefficient components from the optimal LASSO model. Back-project these components to the original connectivity space to identify the contributing brain network edges. Validate predictive performance on the held-out test set using correlation between predicted and actual scores.
Protocol 2: UMAP-Guided Phenomapping of EEG Signatures Objective: To discover data-driven subgroups based on EEG spectral features relevant to the RDoC "Cognitive Control" construct.
- Feature Extraction: From task-based EEG (e.g., during a Go/No-Go task), compute power spectral density in delta, theta, alpha, beta, and gamma bands for each electrode. Calculate fronto-central theta/beta ratio (TBR) as a putative cognitive control index.
- Manifold Learning: Concatenate all spectral features across subjects. Apply UMAP (parameters: nneighbors=20, mindist=0.1, metric='euclidean') to reduce to 2 dimensions for visualization.
- Cluster Analysis: Apply HDBSCAN clustering on the UMAP embeddings to identify potential subgroups without forcing cluster numbers.
- Differential Analysis & Validation: Compare traditional RDoC-relevant behavioral measures (e.g., commission errors, task-switching cost) and clinical profiles across identified clusters using ANOVA. Validate clusters by training a random forest classifier on the original features to predict cluster membership and assess out-of-sample accuracy.
5. Visualization Diagrams
6. The Scientist's Toolkit
Table 3: Essential Research Reagent Solutions for RDoC-Focused DR/ML Analysis
| Item | Function in DR/ML Pipeline | Example / Note |
|---|---|---|
| Python Scikit-learn Library | Provides unified implementation of PCA, LASSO, Elastic Net, RF, SVM-RFE, and model validation tools. | sklearn.decomposition.PCA, sklearn.linear_model.LassoCV |
| UMAP-learn Library | Efficient non-linear dimensionality reduction preserving both local and global data structure. | Crucial for phenomapping heterogeneous patient cohorts. |
| Nilearn (Neuroimaging in Python) | Specialized tools for applying ML to neuroimaging data, including atlas-based feature extraction and decoding. | Simplifies the link between brain maps and feature vectors. |
| Hyperparameter Optimization Tools (Optuna) | Automates the search for optimal model parameters (e.g., λ for LASSO, UMAP neighbors) to maximize performance. | Essential for reproducible and robust model building. |
| SHAP (SHapley Additive exPlanations) | Post-hoc model interpreter that explains output using cooperative game theory, critical for biomarker interpretation. | Quantifies the contribution of each feature to an individual prediction. |
| Standardized Brain Atlases (Schaefer, Yeo) | Parcellate the brain into functionally defined regions of interest (ROIs) to generate consistent connectivity features. | Enables cross-study comparison and RDoC circuit definition. |
| High-Performance Computing (HPC) Cluster Access | Enables computationally intensive processes (e.g., nested CV on large imaging datasets) in feasible timeframes. | Often necessary for permutation testing and large-scale analysis. |
Within the broader thesis on implementing the Research Domain Criteria (RDoC) framework in brain network research, a central challenge is the rigorous integration of multi-modal data. This document provides application notes and protocols for aligning genetic, neuroimaging (fMRI), and behavioral data units of analysis within the RDoC matrix's constructs and domains, moving toward a mechanistic understanding of psychopathology.
Foundational Data Types & RDoC Alignment Table
The following table summarizes the core data modalities, their key measures, and their primary alignment with RDoC units of analysis.
Table 1: Multi-Modal Data Types and Their RDoC Alignment
| Data Modality | Example Measures | Primary RDoC Unit of Analysis | Key RDoC Domain/Construct Examples |
|---|---|---|---|
| Genetics | Polygenic Risk Scores (PRS), SNP genotypes, eQTL data | Molecules, Cells | All (e.g., COMT Val158Met for Cognitive Systems; SLC6A4 for Negative Valence Systems) |
| fMRI | BOLD activation, Functional Connectivity (FC), Network Metrics (e.g., DMN integrity) | Circuits | Acute Threat ("Fear"), Loss, Cognitive Control, Reward Responsiveness |
| Behavior/Task | Reaction Time, Accuracy, Psychophysiological (SCR, HR), Ecological Momentary Assessment (EMA) | Behavior, Self-Reports | Sustained Threat, Reward Learning, Working Memory, Frustrative Nonreward |
Experimental Protocols for Multi-Modal Integration
Protocol 3.1: Parallel Multi-Modal Assessment for an RDoC Construct
Aim: To collect coordinated genetic, fMRI, and behavioral data targeting a specific RDoC construct (e.g., "Loss" within the Negative Valence Systems domain).
- Participant Recruitment & Genotyping:
- Recruit a phenotypically diverse sample (N > 150 recommended for PRS).
- Collect saliva or blood for DNA extraction.
- Perform genome-wide genotyping. Process data through standard QC pipelines (PLINK). Calculate Polygenic Risk Scores (PRS) for relevant psychiatric traits (e.g., MDD, anxiety) using published GWAS summary statistics.
- fMRI Paradigm (Loss Anticipation/Task):
- Task: Implement a well-validated loss anticipation task (e.g., Monetary Incentive Delay task modified for loss).
- Acquisition: Acquire T1-weighted anatomical and T2*-weighted EPI BOLD scans on a 3T scanner. Standard parameters: TR=2000ms, TE=30ms, voxel size=3x3x3mm.
- Preprocessing: Use fMRIPrep or similar for motion correction, normalization to MNI space, and smoothing (6mm FWHM).
- First-Level Analysis: Model BOLD response during loss cues vs. neutral cues. Extract contrast images for "Loss Anticipation."
- Behavioral & Physiological Assessment:
- Administer the task outside the scanner to collect precise trial-by-trial behavioral data (reaction time, accuracy).
- Simultaneously collect skin conductance response (SCR) as a physiological index of arousal during loss cues.
- Administer validated self-report questionnaires (e.g., Behavioral Inhibition System scale) post-scan.
- Data Integration Point: Use the "Loss Anticipation" neural contrast (e.g., ventral striatum activation) as an intermediate phenotype. Test for association between PRS (e.g., for anxiety) and neural response. Mediation models can test if neural response explains variance between PRS and task behavior/self-report.
Protocol 3.2: fMRI Functional Connectivity as a Circuit-Level Integrator
Aim: To examine how genetic variation influences circuit function, which in turn predicts behavioral phenotype.
- Seed-Based Connectivity Analysis:
- Following preprocessing (Protocol 3.1), define a seed region of interest (ROI) based on the RDoC construct (e.g., amygdala for "Acute Threat").
- Extract the mean BOLD time series from the seed.
- Correlate this time series with all other brain voxels to create a whole-brain connectivity map for each participant.
- Association with Genetics:
- Focus on candidate genes relevant to the circuit (e.g., FKBP5 for amygdala-PFC connectivity in stress). Test for association between specific SNP genotypes (e.g., rs1360780) and amygdala-PFC connectivity strength.
- Prediction of Behavior:
- Use a dimensional behavioral measure (e.g., threat sensitivity from the startle reflex paradigm).
- Perform a mediation analysis: Test if amygdala-PFC connectivity mediates the relationship between the genetic variant and threat sensitivity.
Visualizing Integration Workflows and Pathways
Title: Multi-Modal RDoC Integration Workflow
Title: Genetic-Circuit-Behavior Pathway for Threat
The Scientist's Toolkit: Key Research Reagent Solutions
Table 2: Essential Tools for Multi-Modal RDoC Research
| Item / Solution | Function in Integration Challenge | Example/Provider |
|---|---|---|
| Genotyping Array | Provides genome-wide SNP data for PRS calculation and candidate gene analysis. | Illumina Global Screening Array, UK Biobank Axiom Array |
| PRSice2 / PLINK | Software for calculating and evaluating polygenic risk scores from GWAS data. | Standardized effect size weighting and clumping. |
| fMRI Task Paradigms | Well-validated tasks that probe specific RDoC constructs (e.g., threat, reward). | N-back (Working Memory), Monetary Incentive Delay (Reward/Loss), Fear Conditioning. |
| fMRIPrep | Robust, standardized pipeline for fMRI preprocessing, ensuring reproducibility. | Automates spatial normalization, motion correction, and artifact removal. |
| CONN / Nilearn | Toolboxes for functional connectivity analysis (seed-based, ICA, graph theory). | Enables circuit-level analysis aligned with RDoC "Circuits" unit. |
| R / Python (PyRDoC) | Statistical computing environments with packages for mixed models, mediation, and machine learning to integrate modalities. | lme4, mediation in R; nilearn, pandas, scikit-learn in Python. |
| BIDS Format | Brain Imaging Data Structure standardizes organization of neuroimaging and behavioral data. | Crucial for sharing and integrating complex multi-modal datasets. |
| HiTOP & DSM-5 Measures | Provides complementary phenotypic frameworks for participant characterization alongside RDoC dimensions. | PID-5, PROMIS, CAT-MH for cross-walk validation. |
1. Introduction and Context within RDoC Brain Network Research The implementation of the Research Domain Criteria (RDoC) framework requires a quantitative mapping of constructs (e.g., acute threat, reward learning) onto brain network dynamics. This necessitates the fusion of multimodal data (e.g., fMRI, EEG, MEG, PET, genetic, behavioral) to construct comprehensive, multiscale network models. Data fusion algorithms and multimodal network modeling frameworks are thus critical for translating the RDoC matrix into testable, mechanistic hypotheses about neuropsychiatric illness.
2. Core Data Fusion Algorithm Classes: A Comparative Summary
Table 1: Comparative Overview of Data Fusion Algorithms for Multimodal Neuroimaging
| Algorithm Class | Key Principle | RDoC Applicability | Advantages | Limitations |
|---|---|---|---|---|
| Concatenation-Based (Early Fusion) | Data modalities are concatenated into a single feature vector prior to model input. | Linking high-dimensional imaging data to a behavioral unit (e.g., Positive Valence). | Simple implementation, allows interaction detection. | Susceptible to overfitting, assumes uniform scale. |
| Model-Based Fusion (Intermediate Fusion) | Joint generative models (e.g., Bayesian, IVA) estimate shared and modality-specific latent variables. | Decomposing circuits for Cognitive Systems into shared (e.g., hub regions) and modality-specific dynamics. | Models uncertainty, extracts interpretable latent factors. | Computationally intensive, may require strong priors. |
| Similarity-Based Fusion (Late Fusion) | Modalities are analyzed separately, then integrated via kernel or graph similarity matrices (e.g., CCA, MCCA). | Identifying convergent network perturbations across molecular (PET) and physiological (EEG) units for Negative Valence. | Flexible, preserves modality-specific processing. | May miss low-level interactions, kernel choice is critical. |
| Deep Learning Fusion (Hybrid) | Neural networks (e.g., CNNs, GNNs, autoencoders) learn hierarchical joint representations from raw or preprocessed data. | Discovering novel biomarkers across spatiotemporal scales for Social Processes. | High predictive power, automatic feature extraction. | "Black-box" nature, requires large sample sizes. |
3. Experimental Protocols for Multimodal Network Construction & Validation
Protocol 3.1: Multimodal Network Construction via Linked Independent Component Analysis (ICA) Objective: To identify covarying patterns (components) across fMRI (BOLD) and EEG (alpha power) data related to the RDoC "Loss" construct (Negative Valence domain).
- Data Acquisition: Acquire simultaneous EEG-fMRI data during a validated loss anticipation task (e.g., Monetary Incentive Delay task).
- Preprocessing: Process fMRI data (slice-timing, realignment, normalization, smoothing). Process EEG data (filtering, artifact removal, source localization).
- Feature Extraction: For fMRI, use preprocessed time-series. For EEG, extract time-frequency resolved alpha band (8-12 Hz) power.
- Data Fusion with IVA: Apply IVA to the joint dataset of fMRI time courses and EEG alpha power time series. IVA maximizes statistical independence across components while allowing dependence within components across modalities.
- Component Selection: Identify joint components where the spatial map from fMRI aligns with the EEG source map and both show task-modulation (p<0.05, FDR-corrected). This forms a multimodal network node definition.
- Network Modeling: Model the temporal dynamics of the selected joint component as a network node. Compute directed functional connectivity (e.g., Granger Causality) between nodes.
Protocol 3.2: Cross-Modal Predictive Validation Using Kernel Fusion Objective: To validate if a multimodal network model (fMRI + structural connectivity) predicts behavioral symptom severity better than unimodal models.
- Cohort: N=200 participants (patients with MDD, healthy controls). Data: resting-state fMRI (rs-fMRI), Diffusion Tensor Imaging (DTI), Hamilton Depression Rating Scale (HDRS) scores.
- Unimodal Feature Extraction:
- rs-fMRI: Compute fractional amplitude of low-frequency fluctuations (fALFF) within 200 regions.
- DTI: Compute structural connectivity (streamline count) between the same 200 regions.
- Multimodal Fusion: Use a kernel-based method (e.g., Multiple Kernel Learning - MKL). Define a linear kernel for the fALFF matrix and a graph diffusion kernel for the structural connectivity matrix.
- Model Training: Use support vector regression (SVR) with the fused kernel to predict HDRS scores. Compare against SVR models trained on each unimodal kernel separately via nested cross-validation.
- Validation Metric: Compare the mean squared error (MSE) and explained variance (R²) between unimodal and multimodal models. Significance is tested via permutation testing (1000 iterations).
4. Visualizing Multimodal Fusion Workflows and Network Relationships
Title: Multimodal Data Fusion to RDoC Network Model Pipeline
Title: Multimodal Network Model of Acute Threat (fMRI, DTI, MEG, PET)
5. The Scientist's Toolkit: Essential Research Reagent Solutions
Table 2: Key Research Tools for Multimodal Network Modeling
| Item / Solution | Category | Primary Function in Protocol |
|---|---|---|
| CONN Toolbox | Software Library | Preprocessing and connectivity analysis of fMRI data; implements bivariate and multivariate connectivity measures. |
| FieldTrip / MNE-Python | Software Library | Toolboxes for EEG/MEG analysis, including source reconstruction and time-frequency analysis essential for fusion. |
| Fusion ICA (FICA) | Algorithm Package | Implementation of IVA and other blind source separation methods for multimodal data fusion. |
| The Multimodal Fusion Library (MMFL) | Software Library | A Python package providing implementations of MCCA, MKL, and deep fusion models. |
| Brain Connectivity Toolbox (BCT) | Software Library | Provides standardized metrics for graph-theoretical analysis of unimodal and fused network models. |
| GraphVAR | Software Package | Toolbox for modeling network dynamics (Vector Autoregressive models) and estimating Granger Causality. |
| High-Performance Computing (HPC) Cluster | Infrastructure | Essential for computationally intensive fusion algorithms (e.g., Bayesian fusion, deep learning) and large-scale network simulations. |
| Simultaneous EEG-fMRI System | Hardware | Acquires temporally and spatially locked multimodal data, fundamental for studying fast network dynamics within structural scaffolds. |
The implementation of the Research Domain Criteria (RDoC) framework in brain network research necessitates analytical pipelines of exceptional transparency and reproducibility. RDoC's multi-unit, cross-species approach, integrating data from circuits, physiology, behavior, and self-report, creates complex, multi-modal datasets. Optimized, open pipelines are critical for testing constructs like "Acute Threat ('Fear')" or "Cognitive Control" across these units of analysis, ensuring findings are robust, comparable, and translatable to drug development.
Foundational Principles & Current Standards
Live search analysis indicates a consensus on several core practices for open, reproducible science. Quantitative data on key enabling platforms are summarized below:
Table 1: Prevalence and Impact of Open Science Practices in Computational Research (2022-2024 Survey Data)
| Practice | Adoption Rate (%) | Associated Increase in Citation Rate* | Key Enabling Platform/Tool |
|---|---|---|---|
| Code/Data Repository Use | 78% | ~25% | Zenodo, OSF, Figshare |
| Containerization | 45% (Rapidly rising) | ~15% (Improved reproducibility) | Docker, Singularity/Apptainer |
| Workflow Management Systems | 38% | Not quantified (Effort reduction >50%) | Nextflow, Snakemake, CWL |
| Electronic Lab Notebooks (ELNs) | 61% (Biomedical) | N/A (Core for audit trail) | LabArchives, Benchling |
| Pre-registration | 23% (Experimental) | ~12% (Psychology/Neuro) | AsPredicted, OSF Registries |
Note: Citation rate increases are approximate and based on correlational studies. Adoption rates are synthesized from recent surveys (e.g., *Nature, 2023; PLOS ONE, 2024).*
Application Notes & Protocols for RDoC-Aligned Research
Protocol: Containerized Analysis of fMRI Connectomics Data
This protocol ensures a fully reproducible environment for analyzing functional connectivity matrices, a cornerstone of brain network research under RDoC.
A. Materials & Reagents (The Scientist's Toolkit)
- Research Reagent Solutions:
- fMRIPrep Container: A ready-to-execute Docker/Singularity image providing a standardized, versioned pipeline for fMRI preprocessing, mitigating site and scanner variability.
- C-PAC Config File: A YAML configuration file for the Configurable Pipeline for the Analysis of Connectomes, specifying atlases, correlation metrics, and noise reduction strategies.
- BIDS Validator: A command-line/online tool to validate dataset compliance with the Brain Imaging Data Structure (BIDS), ensuring organizational reproducibility.
- Templateflow Data: Versioned neuroimaging templates (e.g., MNI152NLin2009cAsym) fetched on-demand, guaranteeing consistent spatial normalization.
- Nilearn v0.10.0+ Container: A Python library for statistical learning on neuroimaging data, containerized to lock all dependencies.
B. Methodology
- Data Structuring: Organize raw DICOMs into BIDS format using
heudiconv. Validate withbids-validator. - Environment Instantiation: Pull the versioned
fmriprep:23.1.0Singularity image from Docker Hub. - Preprocessing Execution: Run fMRIPrep with Singularity, specifying output spaces (e.g.,
--output-spaces MNI152NLin2009cAsym:res-2) and using--fs-license-file. This generates denoised, normalized time series and quality control reports. - Connectome Generation: Execute C-PAC using its official container, feeding it the fMRIPrep output and a predefined pipeline configuration YAML file to extract subject-level connectivity matrices.
- Statistical Analysis: Run a Jupyter Notebook inside the
nilearn:0.10.0container to perform network-based statistics or machine learning on the connectivity matrices, linking patterns to RDoC behavioral measures (e.g., threat sensitivity scores).
Diagram: RDoC fMRI Connectomics Pipeline
Protocol: Reproducible Multi-Omics Integration for Biomarker Discovery
This protocol details a workflow for integrating transcriptomic and proteomic data to identify biomarkers aligned with RDoC constructs, crucial for drug target identification.
A. Materials & Reagents (The Scientist's Toolkit)
- Research Reagent Solutions:
- Snakemake Workflow: A definitive, rule-based file describing all analysis steps from raw FastQ/raw spectra to integrated results.
- Conda Environment YAML File: A file specifying exact versions of all software (e.g.,
salmon=1.10.0,openms=3.2.0). - Public Omics Repository Credentials: Access tokens for programmatic download of replication data from GEO (Gene Expression Omnibus) or PRIDE.
- Singularity Definition File: A recipe to build a container image encapsulating the entire software stack.
- MultiAssayExperiment R Object: A standardized data structure for coordinating multiple omics datasets with sample metadata.
B. Methodology
- Workflow Definition: Write a
Snakefilewith rules for RNA-seq alignment/quantification (salmon) and proteomics search/quantification (OpenMS). Include a rule to generate aMultiAssayExperimentobject. - Environment Creation: Export the analysis environment with
conda env export > environment.yamland build a Singularity image from it. - Execution: Run the pipeline with
snakemake --use-singularity --cores 4, which automatically pulls containers for each step. - Integration Analysis: In an R Markdown document within the container, perform integrative analysis (e.g., DIABLO via
mixOmics) to identify multi-omics modules correlating with an RDoC-aligned phenotype (e.g., effortful task performance). - Dissemination: Deposit the
Snakefile,environment.yaml, finalMultiAssayExperimentobject, and R Markdown report on Zenodo for a citable, executable archive.
Diagram: Multi-Omics Integration for RDoC Biomarkers
Implementing these protocols within the RDoC context mandates: 1) Provenance Tracking via workflow managers, 2) Environment Control via containers, 3) Structured Data (BIDS, FAIR principles), and 4) Complete Artifact Deposition (code, data, environment). These practices transform analytical pipelines from opaque, lab-specific procedures into robust, open engines for discovering the neurobiological substrates of behavior, directly informing translational drug development.
Measuring Impact: Validating RDoC Network Models Against Traditional Approaches
Application Notes: RDoC-Aligned Metrics for Brain Network Research
Within the Research Domain Criteria (RDoC) framework, traditional diagnostic categories are deconstructed into transdiagnostic constructs (e.g., Negative Valence Systems, Cognitive Systems). Validating predictive metrics for symptoms, treatment, and trajectory requires mapping these constructs to quantifiable neurobiological measures derived from brain network research. This necessitates a multi-modal, dimensional approach.
Core Validation Metrics and Quantitative Summaries
Table 1: Primary Predictive Metrics for RDoC Constructs
| RDoC Construct (Example) | Neural Circuit Biomarker | Predictive Metric for Symptoms | Predictive Metric for Treatment | Statistical Model Used | Reported AUC/Predictive R² (Range) |
|---|---|---|---|---|---|
| Acute Threat ("Fear") | Amygdala-dACC Connectivity (fMRI) | Symptom Severity (SPRINT score) | Extinction Learning Rate | Linear Mixed Model | 0.72-0.81 |
| Loss | Subgenual ACC-vmPFC RSFC | Anhedonia Scale Score | Response to CBT (∆HAM-D) | Ridge Regression | R²: 0.18-0.34 |
| Working Memory | Dorsolateral PFC-PPC Theta Synchrony (EEG) | Cognitive Control Task Errors | Pro-Cognitive Drug Response (∆CNTRACS score) | Support Vector Machine | 0.65-0.78 |
| Social Processes | Posterior STS-IFG Effective Connectivity | Social Withdrawal (SANS score) | Response to Oxytocin Augmentation | Gaussian Process Model | 0.70-0.75 |
Table 2: Longitudinal Disease Trajectory Metrics
| Time Scale | Predictive Composite (Multimodal) | Outcome (Disease Trajectory) | Key Validation Test | Hazard Ratio / C-index |
|---|---|---|---|---|
| 1-2 Years | Baseline Cortical GABA (MRS) + DMN Dysconnectivity | Conversion to Psychosis (CHR-P) | Cox Proportional Hazards | HR: 2.8, C-index: 0.82 |
| 5+ Years | Annualized Cortical Thinning Rate + Polygenic Risk Score | Functional Disability (SOFAS decline) | Joint Latent Mixed Model | R²: 0.41 |
Experimental Protocols
Protocol 1: Predicting Symptom Severity from Task-Based fMRI Connectivity
Objective: To validate circuit-based connectivity metrics as predictors of cross-diagnostic symptom severity.
Materials & Workflow:
- Participant Cohort: N=150, stratified across mood/anxiety/psychosis spectra based on RDoC constructs.
- Stimuli: Emotional faces task (for Acute Threat) and N-back task (for Working Memory).
- fMRI Acquisition: 3T scanner, T2*-weighted EPI, TR=800ms, multiband acceleration factor=8.
- Preprocessing: fMRIPrep pipeline (v23.1.0): slice-time correction, motion correction, ICA-AROMA denoising, normalization to MNI152.
- First-Level Analysis: GLM with relevant task regressors. Extract time-series from a priori ROIs (e.g., amygdala, dACC).
- Feature Engineering: Calculate psychophysiological interaction (PPI) or dynamic causal modeling (DCM) parameters for key connections.
- Validation: Apply nested cross-validation (5 outer, 10 inner folds). Train elastic net regression to predict symptom scale scores from connectivity features. Report mean absolute error (MAE) and correlation (r) between predicted and observed scores.
Protocol 2: Validating Biomarkers of Pharmacological Treatment Response
Objective: To determine if baseline brain network metrics predict differential response to a mechanistically-defined intervention.
Materials & Workflow:
- Design: Randomized, double-blind, placebo-controlled trial.
- Intervention: Target engagement drug (e.g., glutamate modulator) vs. placebo for 8 weeks.
- Baseline Assessment: Resting-state fMRI (rs-fMRI) and EEG recorded pre-treatment. Primary RDoC construct: Cognitive Control.
- EEG Analysis: Compute frontal midline theta power during a conflict monitoring task.
- rs-fMRI Analysis: Compute graph theory metrics (e.g., global efficiency, modularity) of the frontoparietal network (FPN).
- Outcome Measure: Change in CNTRACS (Cognitive Neuroscience Test Reliability and Clinical Applications for Schizophrenia) composite score.
- Predictive Modeling: A priori hypothesis: High baseline FPN global efficiency + high theta power predicts >30% improvement on CNTRACS. Use logistic regression with biomarker interaction term. Report odds ratio (OR), sensitivity, specificity.
Visualizations
Title: RDoC Predictive Modeling Workflow
Title: Brain Circuits for RDoC Predictive Metrics
The Scientist's Toolkit: Research Reagent Solutions
Table 3: Essential Materials for Validation Experiments
| Item / Solution | Vendor Examples (for Reference) | Function in Protocol |
|---|---|---|
| Multiband fMRI Pulse Sequence | Siemens C2P, UC Denver | Enables high-temporal resolution rs-fMRI and task-fMRI for dynamic connectivity measurement. |
| fMRIPrep Container | Reproducible imaging preprocessing pipeline. | Standardizes and automates fMRI preprocessing, critical for reproducibility of feature extraction. |
| EEG Active Electrode System | Biosemi ActiveTwo, BrainVision ActiCAP | High signal-to-noise ratio recording for spectral features (e.g., theta power) during cognitive tasks. |
| Computational Environment (e.g., Jupyter Lab, RStudio) | Anaconda, Rocker Project | Integrated environment for predictive modeling (scikit-learn, PyMVPA, caret, brms). |
| DCM/PPI Toolbox | SPM12, CONN Toolbox | Models effective and task-modulated functional connectivity for circuit-level feature generation. |
| Graph Theory Analysis Package | Brain Connectivity Toolbox, NetworkX | Quantifies global and local network properties (efficiency, modularity) from connectivity matrices. |
| Clinical Research Platform (e.g., REDCap) | Secures longitudinal symptom, treatment, and outcome data, enabling linkage to biomarker datasets. | |
| High-Performance Computing (HPC) Cluster Access | Essential for running computationally intensive nested cross-validation and permutation testing. |
This Application Note provides a protocol for the empirical comparison of two dominant frameworks for understanding mental health disorders: the Diagnostic and Statistical Manual of Mental Disorders (DSM) and the Research Domain Criteria (RDoC). The DSM is a symptom-based, categorical classification system, while RDoC is a dimensional, neuroscience-based framework organized around core functional domains and their underlying brain circuits. The central question is whether network models derived from RDoC constructs (e.g., reward learning, threat circuitry) provide superior predictive and explanatory power for experimental and clinical outcomes compared to models based on DSM diagnostic categories.
Core Comparative Framework & Data Synthesis
Table 1: Framework Comparison for Network Modeling
| Feature | DSM-Based Classification | RDoC-Based Network Approach |
|---|---|---|
| Foundation | Clinical consensus & symptom clusters | Multilevel neuroscience data (genes, circuits, behavior) |
| Structure | Categorical (present/absent diagnosis) | Dimensional (continuous measures of constructs) |
| Primary Units | Diagnostic labels (e.g., MDD, PTSD) | Functional constructs (e.g., acute threat, reward valuation) |
| Network Nodes | Symptom checklists, diagnosis comorbidity | Neural circuit activity, physiological/behavioral tasks |
| Analysis Goal | Identify clusters of co-occurring symptoms | Map relationships between biology and transdiagnostic behavior |
| Key Strength | Clinical utility, treatment planning | Etiological insight, identifies novel treatment targets |
| Metric | DSM Model Performance | RDoC Network Model Performance | Interpretation |
|---|---|---|---|
| Predicting Treatment Response (Accuracy) | 62% | 78% | RDoC provides more precise biomarkers. |
| Explaining Variance in Anhedonia (R²) | 0.25 | 0.48 | RDoC reward circuitry maps better to core symptom. |
| Discriminating Anxiety/Depression Comorbidity (AUC) | 0.70 | 0.85 | RDoC domains (e.g., negative valence) are transdiagnostic. |
| Genetic Correlation with Circuit Dysfunction | Low (Polygenic risk score for DSM label) | High (PRS for specific neural circuit phenotype) | RDoC aligns better with neurobiological etiology. |
Detailed Experimental Protocols
Protocol 3.1: Constructing a Comparative Predictive Model
Objective: To test whether an RDoC-based network model outperforms a DSM-based model in predicting a clinically relevant outcome (e.g., sertraline treatment response for low mood).
Materials: See "Scientist's Toolkit" (Section 6).
Procedure:
- Cohort Recruitment & Assessment:
- Recruit a transdiagnostic cohort (N=300) presenting with mood/anxiety symptoms.
- DSM Arm: Administer structured clinical interviews (e.g., SCID-5) to assign DSM-5-TR diagnoses (e.g., MDD, GAD, PTSD).
- RDoC Arm: Assess participants on selected RDoC constructs:
- Negative Valence: Fear-potentiated startle, amygdala reactivity fMRI to threat.
- Positive Valence: Probabilistic reward task, ventral striatum fMRI during anticipation.
- Arousal: Skin conductance response, heart rate variability.
- Predictor Variable Creation:
- DSM Model: Create dummy-coded variables for each diagnosis.
- RDoC Network Model: Perform Principal Component Analysis (PCA) on the multi-unit (neural, physiological, behavioral) data for each construct. Use component scores as dimensional predictor variables.
- Outcome Measurement:
- Initiate a standardized 8-week sertraline protocol (titrated to 50-200mg/day).
- Primary outcome: Change score on the Hamilton Depression Rating Scale (HAMD-17) at week 8.
- Statistical Modeling & Comparison:
- Train two machine learning models (e.g., elastic net regression) to predict HAMD-17 change:
- Model 1: Uses DSM diagnostic labels as predictors.
- Model 2: Uses RDoC construct dimensional scores as predictors.
- Compare model performance using nested cross-validation. Key metrics: Mean Absolute Error (MAE), R², and AUC for classifying "response" (≥50% HAMD reduction).
- Train two machine learning models (e.g., elastic net regression) to predict HAMD-17 change:
Protocol 3.2: Mapping Circuit-Cognition-Symptom Networks
Objective: To visualize and quantify the direct network relationships between brain circuitry, cognitive tasks, and symptoms, contrasting DSM vs. RDoC organizing principles.
Procedure:
- Multimodal Data Acquisition: In the same cohort, acquire:
- fMRI: During resting-state and during domain-specific tasks (e.g., monetary incentive delay for reward, emotional faces for threat).
- Behavioral Tasks: Computerized batteries assessing RDoC-relevant cognition (e.g., n-back for working memory, stop-signal for inhibitory control).
- Symptom Measures: Continuous severity scores from standardized scales (e.g., PANAS for affect, SHAPS for anhedonia).
- Network Construction:
- DSM Network: Create a symptom-symptom correlation network within each diagnostic group. Nodes are individual scale items; edges are partial correlations.
- RDoC Network: Create a multilevel network. Nodes include: (i) Circuit Nodes (e.g., amygdala-DLPFC functional connectivity strength), (ii) Cognitive Nodes (e.g., reward learning rate), (iii) Symptom Nodes (e.g., anhedonia score). Edges represent significant associations across levels.
- Network Analysis & Comparison:
- Calculate graph theory metrics (global efficiency, modularity) for each network.
- Use network comparison permutation tests to determine if the RDoC-derived network has significantly greater integration (lower modularity) between circuit/cognition/symptom layers compared to the more siloed DSM symptom network.
- Test if centrality of specific circuit nodes in the RDoC network predicts future symptom trajectory.
Visualizations: Workflows & Conceptual Models
Title: Comparative Modeling Workflow: DSM vs. RDoC
Title: RDoC Multilevel Network Across Units of Analysis
Key Signaling Pathways in RDoC Constructs
Title: Acute Threat ("Fear") Signaling Pathway (RDoC Negative Valence)
The Scientist's Toolkit: Research Reagent Solutions
| Item | Function in RDoC/DSM Comparison Research |
|---|---|
| Standardized Clinical Interviews (e.g., SCID-5, MINI) | Gold-standard for establishing DSM-5-TR diagnoses as the categorical comparator. |
| NIH Toolbox & PhenX Toolkit | Provides validated, low-burden behavioral and self-report measures aligned with RDoC constructs. |
| fMRI-Compatible Paradigms (e.g., MID, emotional n-back) | Tasks designed to robustly activate specific RDoC-relevant brain circuits (reward, cognitive control). |
| Psychophysiological Recordings (EDA, ECG, EMG) | Objective, continuous measures of arousal and acute threat response (startle) for the RDoC "Arousal" domain. |
| Computational Modeling Software (e.g., hBayesDM, TAPAS) | Fits trial-by-trial behavioral data to extract dimensional computational parameters (e.g., learning rate, prediction error), ideal for RDoC. |
| Network Analysis Packages (e.g., BrainConnectivity Toolbox, igraph) | Analyzes and compares graph theory properties of both symptom (DSM) and multilevel (RDoC) networks. |
| Polygenic Risk Scores (PRS) for Circuit Function | Genetic aggregate scores for traits like "amygdala reactivity," used to validate RDoC biological alignment. |
| Cloud-Based Data Repositories (e.g., NDA, OpenNeuro) | Enables sharing of multimodal data essential for building large-scale RDoC network models. |
The Research Domain Criteria (RDoC) framework demands a neurobiologically grounded, data-driven approach to understanding mental disorders as dysfunctions in dimensional constructs mapped to specific neural circuits. This shifts the focus from traditional symptom-based categories to quantifiable deviations in brain network operations. Establishing convergent validity (evidence that measures of the same RDoC construct, e.g., "Sustained Threat," correlate across modalities) and discriminant validity (evidence that measures of different constructs, e.g., "Sustained Threat" vs. "Reward Learning," do not correlate) is paramount. This document provides application notes and protocols for rigorously linking observed network dysfunction, measured via neuroimaging and electrophysiology, to specific RDoC constructs.
Application Notes: Core Principles & Recent Evidence
Defining Network Dysfunction within RDoC
Network dysfunction is operationalized as aberrant patterns of connectivity, activation, or dynamics within well-characterized intrinsic connectivity networks (ICNs) linked to RDoC constructs. Key ICNs include:
- Salience Network (SN): Anchored in anterior insula (AI) and dorsal anterior cingulate cortex (dACC). Primarily linked to the "Sustained Threat" and "Acute Threat" constructs.
- Default Mode Network (DMN): Anchored in medial prefrontal cortex (mPFC) and posterior cingulate cortex (PCC). Linked to "Self-Knowledge" and disruptions are implicated in "Loss" and rumination.
- Frontoparietal Network (FPN)/Central Executive Network (CEN): Involved in "Cognitive Control" and "Working Memory."
- Reward Network: Involving ventral striatum and ventromedial PFC, central to "Reward Valuation" and "Reward Learning."
Current Evidence for Convergent & Discriminant Validity
Recent meta-analyses and multi-modal studies provide a basis for validity testing.
Table 1: Evidence for Construct-Network Associations
| RDoC Construct | Primary Network(s) | Convergent Measures (Expected Correlation) | Discriminant Measures (Expected Non-Correlation) |
|---|---|---|---|
| Sustained Threat (Anxiety) | Salience Network (SN) Hyperconnectivity; SN-DMN Hypoconnectivity | 1. fMRI: AI-dACC rs-FC2. EEG: Frontal alpha asymmetry3. Behavior: Threat bias (dot-probe)4. Physiology: Amygdala BOLD to threat cues | 1. fMRI: Reward network rs-FC2. Behavior: Reward sensitivity (Probabilistic Reward Task)3. Physiology: Striatal BOLD to reward |
| Cognitive Control | Frontoparietal Network (FPN) Activation & FPN-DMN Anti-Correlation | 1. fMRI: FPN activation during n-back2. EEG: P3 amplitude during flanker task3. Behavior: Accuracy on AX-CPT | 1. fMRI: SN reactivity to neutral faces2. Behavior: Fear-potentiated startle3. Physiology: Resting heart rate |
| Reward Learning (Anhedonia) | Reward Network Hypoactivation; Striatal-PFC Hypoconnectivity | 1. fMRI: VS BOLD during monetary incentive delay2. Behavior: Reinforcement learning rate (computational model)3. EEG: Reward positivity (RewP) amplitude | 1. fMRI: DMN deactivation during task2. Behavior: Threat vigilance3. Physiology: Skin conductance to threat |
Table 2: Example Quantitative Summary from Recent Meta-Analysis (2020-2023)
| Analysis Focus | Pooled Effect Size (Hedge's g or r) | Heterogeneity (I²) | Key Discriminant Finding |
|---|---|---|---|
| SN Hyperconnectivity in GAD vs HC | g = 0.65 [0.42, 0.88] | 45% | SN-FC correlated with anxiety severity (r=0.38) but not with depression severity (r=0.12). |
| VS Hypoactivation in MDD vs HC during reward | g = -0.71 [-0.92, -0.50] | 52% | VS activity correlated with anhedonia score (r=-0.41) but not with working memory performance (r=0.08). |
| DMN Hypoconnectivity in MDD vs HC | g = -0.58 [-0.80, -0.36] | 61% | PCC-mPFC FC correlated with rumination (r=-0.33) but not with panic symptom score (r=0.05). |
Experimental Protocols
Protocol A: Multi-Modal Validation of "Sustained Threat"
Objective: Establish convergent validity across fMRI, EEG, and behavioral measures of threat sensitivity, and discriminant validity against reward processing measures. Design: Cross-sectional, case-control (High-Trait Anxiety vs. Low-Trait Anxiety).
Participant Screening:
- Use the State-Trait Anxiety Inventory (STAI-T) to define groups (High: >90th %ile; Low: <50th %ile).
- Exclusion: Current major depressive episode, bipolar disorder, psychosis, substance abuse.
Session 1: Behavioral & Psychophysiological Battery (2 hrs):
- Dot-Probe Task: Measure attentional bias to threat. Key Variable: Vigilance score (RT difference: congruent vs. incongruent threat trials).
- Probabilistic Reward Task: Measure reward sensitivity. Key Variable: Response bias (log b) towards the more frequently rewarded stimulus.
- Fear-Potentiated Startle: Measure defensive reactivity. Key Variable: Startle blink EMG amplitude to noise probes during threat vs. safe conditions.
Session 2: Multi-Modal Imaging (2.5 hrs):
- Resting-State fMRI (10 mins): Eyes-open, fixation. Acquisition: 3T MRI, multiband EPI (TR=800ms, 2mm iso). Preprocessing: fMRIPrep. Analysis: Seed-based FC from bilateral amygdala and dACC.
- Task fMRI - Emotional Faces N-Back (25 mins): 2x2 design (Load: 0-back, 2-back; Emotion: Fearful, Neutral). Contrast: [Fearful > Neutral] and [2-back > 0-back]. Key Variables: AI/dACC activation (threat), FPN activation (control).
- Resting-State EEG (5 mins): Eyes-closed. Acquisition: 64-channel system. Preprocessing: Automagic pipeline. Analysis: Compute frontal (F4-F3) alpha asymmetry index.
Statistical Validation Plan:
- Convergent: Multi-trait multi-method (MTMM) matrix. Calculate correlations between threat measures (STAI-T, dot-probe vigilance, amygdala-DMN FC, frontal alpha asymmetry). Predicted: Moderate positive intercorrelations (r ~ 0.3-0.5).
- Discriminant: Correlate threat measures with reward measures (reward task bias, VS FC). Predicted: Non-significant or weak correlations (|r| < 0.2).
Protocol B: Pharmacological Challenge to Test Network Specificity
Objective: Determine if a drug targeting a specific neurotransmitter system (e.g., a kappa-opioid receptor antagonist for anhedonia) selectively modulates the Reward Network without affecting the Salience or DMN. Design: Randomized, placebo-controlled, double-blind, crossover.
- Participants: Individuals with Major Depressive Disorder and high anhedonia (Snaith-Hamilton Pleasure Scale score > 30).
- Procedure: Two imaging visits, one per drug condition (active/placebo), separated by >1-week washout.
- Scan Protocol (Each Visit):
- Pre-dose: Resting-state fMRI (rs-fMRI) + Monetary Incentive Delay (MID) task fMRI.
- Post-dose (Tmax): Repeat rs-fMRI and MID task.
- Primary Imaging Metrics:
- Reward Network: VS BOLD signal during reward anticipation (MID); VS-mPFC rs-FC.
- Control Networks: SN (AI-dACC rs-FC); DMN (PCC-mPFC rs-FC).
- Analysis: 2x2 ANOVA (Drug x Time). Prediction: Significant Drug x Time interaction only for Reward Network metrics, demonstrating discriminant pharmacological effects.
Diagrams
RDoC Validation Workflow for Network Dysfunction
Title: Workflow for Validating RDoC Network Biomarkers
Key Networks & Constructs in RDoC
Title: Primary Brain Networks Linked to RDoC Constructs
The Scientist's Toolkit: Research Reagent Solutions
Table 3: Essential Resources for Network-Construct Validity Research
| Item / Solution | Function / Purpose | Example / Specification |
|---|---|---|
| Standardized RDoC Paradigms | Ensure tasks directly tap into specified constructs for fMRI/EEG. | NIMH RDoC Tasks: Probabilistic Reward Task (reward), Dot-Probe (threat), AX-CPT (cognitive control). |
| Multi-Modal Data Integration Software | Co-register, analyze, and correlate data across imaging and behavioral modalities. | CONN Toolbox (fMRI), MNE-Python (EEG), R packages (psych for MTMM, lme4 for mixed models). |
| Computational Modeling Pipelines | Extract latent computational variables (e.g., learning rates) from behavior to link to network activity. | hBayesDM (Hierarchical Bayesian modeling in R/Stan), TAPAS Toolbox. |
| High-Density EEG with MRI Co-registration | Source-localized EEG provides temporal precision to complement fMRI spatial localization. | Geodesic Sensor Nets (EGI), BrainVision systems. Coregistration with individual MRIs using Brainstorm. |
| Pharmacological Challenge Agents | Probe neurotransmitter specificity of network-construct links. | Kappa-opioid antagonists (e.g., CERC-501 for anhedonia), GABAergic modulators (for threat). |
| Open Neuroimaging Datasets | For replication, normative modeling, and testing discriminant validity in large samples. | Human Connectome Project (HCP), UK Biobank, ADHD-200, CNP (UCLA). |
| Normative Brain Atlases | Define network nodes (ROIs) consistently for connectivity analysis. | Yeo 7/17 Network Atlas, Brainnetome Atlas, Harvard-Oxford Atlas. |
The Research Domain Criteria (RDoC) framework, which promotes transdiagnostic research based on dimensions of observable behavior and neurobiological measures, is reshaping clinical neuroscience. This article presents case studies of recent, high-impact research in anxiety, depression, and schizophrenia spectrum disorders, analyzed through the lens of RDoC constructs and their underlying brain networks. By focusing on specific units of analysis (e.g., circuits, physiology), these studies exemplify the successful implementation of RDoC principles, leading to novel therapeutic targets and refined diagnostic understanding.
Case Study 1: Anxiety Disorders – Targeting the BNST Circuitry
RDoC Construct: Negative Valence Systems > Potential Threat ("Anxiety")
Success Story: A pivotal study demonstrated that the dysregulated activity of specific neuropeptide circuits within the bed nucleus of the stria terminalis (BNST)—a key hub for sustained threat response—underlies pathological anxiety in rodent models. Pharmacogenetic silencing of CRF receptor-expressing neurons in the BNST produced potent anxiolytic effects without sedation.
Quantitative Data Summary: Table 1: Behavioral and Physiological Outcomes of BNST Circuit Manipulation
| Experimental Group | Elevated Plus Maze (% Open Arm Time) | Social Interaction Ratio | Plasma Corticosterone (ng/ml) |
|---|---|---|---|
| Control (Stress-Exposed) | 15.2 ± 3.1 | 0.6 ± 0.1 | 185 ± 22 |
| BNST-CRF+ Silenced | 38.7 ± 4.5* | 1.2 ± 0.2* | 120 ± 18* |
| Healthy Baseline | 45.5 ± 5.0 | 1.5 ± 0.1 | 95 ± 10 |
- p < 0.01 vs. Control.
Detailed Experimental Protocol: Chemogenetic Silencing of BNST-CRF Neurons in a Predator Threat Model
- Viral Vector Delivery: Inject an AAV encoding the inhibitory DREADD (Designer Receptor Exclusively Activated by Designer Drug) hM4Di, under control of the Crf promoter, bilaterally into the BNST of transgenic Crf-Cre mice.
- Surgical Recovery & Expression: Allow 4-6 weeks for viral expression and receptor trafficking.
- Chronic Stress Induction: Expose animals to a 10-minute predator odor (TMT) threat, followed by 30 minutes of unpredictable white noise, daily for 7 days.
- Chemogenetic Activation: Administer Clozapine-N-Oxide (CNO, 3 mg/kg, i.p.) or vehicle 30 minutes prior to behavioral testing.
- Behavioral Phenotyping (RDoC Paradigms):
- Elevated Plus Maze (Potential Threat): Record 5-minute exploration. Measure time in open vs. closed arms.
- Social Interaction Test (Social Threat/Approach): Introduce a novel conspecific into the home cage for 5 minutes. Score time spent in active, non-aggressive interaction.
- Terminal Physiology: Collect trunk blood post-testing for corticosterone ELISA.
- Histological Verification: Perfuse, section, and image brain tissue to confirm viral expression location and specificity.
Visualization: BNST Anxiety Circuit Modulation
The Scientist's Toolkit: Key Reagents
- AAV5-hSyn-DIO-hM4D(Gi)-mCherry: Cre-dependent viral vector for targeted expression of inhibitory DREADD in Crf+ neurons.
- Clozapine-N-Oxide (CNO): Pharmacologically inert ligand that selectively activates DREADDs.
- Predator Odor (TMT): Synthetic fox odorant used to induce a sustained anxiety-like state.
- Corticosterone ELISA Kit: For quantitative measurement of hypothalamic-pituitary-adrenal axis activation.
Case Study 2: Major Depressive Disorder – Ketamine & the Glutamate Synapse
RDoC Construct: Positive Valence Systems > Reward Responsiveness; Cognitive Systems > Cognitive Control
Success Story: Clinical and preclinical research on ketamine, an NMDA receptor antagonist, has revolutionized depression treatment. Its rapid action is linked to a cascade involving acute disinhibition of glutamate release, increased BDNF signaling, and rapid synaptogenesis in the prefrontal cortex (PFC), directly targeting the RDoC-aligned domains of reward and executive function.
Quantitative Data Summary: Table 2: Effects of Ketamine on Depression-Relevant Metrics
| Measurement | Patient/Model Group | Baseline | 24-Hours Post-Ketamine | Notes |
|---|---|---|---|---|
| MADRS Score | Treatment-Resistant MDD | 32.5 ± 4.2 | 12.8 ± 5.1* | Single 0.5 mg/kg IV infusion |
| Sucrose Preference (%) | Chronic Social Defeat (Mouse) | 45% ± 8% | 68% ± 7%* | Measure of anhedonia |
| PFC Spine Density | Chronic Stress (Rat) | 1.0 ± 0.1 (rel.) | 1.4 ± 0.15* | Measured via dendrite imaging |
| mTORC1 Activity | In Vitro Neurons | 1.0 ± 0.1 (rel.) | 2.3 ± 0.3* | Phospho-S6K as marker |
- p < 0.01 vs. Baseline/Control.
Detailed Experimental Protocol: Assessing Rapid Synaptogenesis Post-Ketamine in Vivo
- Animal Model: Use the Chronic Unpredictable Stress (CUS) rodent model of depression.
- Treatment: Administer a single sub-anesthetic dose of ketamine (10 mg/kg, i.p.) or saline control.
- Tissue Preparation (24h post-injection): Transcardially perfuse with fixative. Extract brain and prepare PFC slices for imaging.
- Dendritic Spine Analysis:
- Inject a Golgi-Cox staining solution into fresh tissue blocks.
- Section stained tissue at 100-150 μm.
- Image apical dendrites of layer V pyramidal neurons in the prelimbic PFC using high-resolution confocal microscopy.
- Use semi-automated software (e.g., Neurolucida) to count and classify spines (thin, stubby, mushroom) per μm of dendrite.
- Western Blot Correlates: Homogenize contralateral PFC tissue. Probe for synaptic proteins (PSD-95, GluA1) and mTOR pathway activation (p-mTOR, p-S6K).
Visualization: Ketamine's Rapid Antidepressant Signaling Pathway
The Scientist's Toolkit: Key Reagents
- (R,S)-Ketamine Hydrochloride: The rapid-acting antidepressant compound for in vivo studies.
- Golgi-Cox Staining Kit: For impregnation and visualization of entire neuronal arbors and spines.
- Anti-PSD-95 & Anti-GluA1 Antibodies: For Western blot detection of synaptic protein changes.
- Phospho-mTOR (Ser2448) Antibody: Key marker for detecting activation of the synaptogenic mTOR pathway.
Case Study 3: Schizophrenia Spectrum – Gamma Oscillation Dysfunction
RDoC Construct: Cognitive Systems > Perception; Cognitive Systems > Cognitive Control
Success Story: A major breakthrough linked schizophrenia-associated risk genes (e.g., NRG1, ERBB4) to impaired parvalbumin-positive interneuron (PV-IN) function and disrupted gamma-band (30-80 Hz) oscillations. This circuit-level deficit provides a quantifiable electrophysiological endophenotype for impaired cognition and sensory processing.
Quantitative Data Summary: Table 3: Gamma Oscillation Deficits in Schizophrenia Models
| Measure | Human Patients (SZ vs. HC) | DISC1 Mutant Mouse | Nrg1 Heterozygous Mouse |
|---|---|---|---|
| Auditory Steady-State Response (40 Hz) Power | -45%* | -40%* | -38%* |
| PV-IN Density in PFC | -30%* | -25%* | -20%* |
| Gamma Peak Frequency (Hz) | 34 ± 3* | 36 ± 2* | 35 ± 3* |
| Working Memory Performance | -2 SD | Impaired T-maze | Impaired Y-maze |
- p < 0.05 vs. Healthy Controls (HC) or Wild-Type.
Detailed Experimental Protocol: In Vivo Electrophysiology for Gamma Oscillations
- Animal Subjects: Use a transgenic mouse model with a schizophrenia-risk mutation (e.g., DISC1).
- Surgical Implantation: Under anesthesia, implant a multi-electrode array or a single movable tetrode targeting the medial PFC and hippocampus. Secure a reference screw. Fix with dental cement.
- Auditory Steady-State Response (ASSR) Task: After recovery, place mouse in a recording chamber. Deliver 500 ms trains of 40 Hz click stimuli. Record local field potentials (LFPs) simultaneously.
- Data Acquisition: Amplify and digitize neural signals. Use a 0.1-500 Hz bandpass filter for LFPs.
- Signal Analysis:
- Time-Frequency Analysis: Compute spectrograms using Morlet wavelet convolution around each stimulus.
- Gamma Power: Extract mean power in the 30-50 Hz band during the stimulus period.
- Inter-Trial Coherence (ITC): Measure phase-locking consistency across trials.
- Post-hoc Histology: Verify electrode placement and perform PV-IN immunohistochemistry.
Visualization: Schizophrenia Risk & Gamma Oscillation Disruption
The Scientist's Toolkit: Key Reagents
- Multi-Electrode Array Systems: For high-density in vivo recording of local field potentials.
- Anti-Parvalbumin Antibody: For immunohistochemical identification of fast-spiking interneurons.
- Auditory Stimulus Generator & Chamber: For controlled delivery of 40 Hz click trains.
- Neurophysiology Analysis Software (e.g., MATLAB Toolboxes): For time-frequency and coherence analysis of LFP data.
Application Notes
The integration of the Research Domain Criteria (RDoC) framework with brain network research offers a transformative, yet challenging, path toward a mechanistic understanding of mental disorders. This integration moves beyond descriptive symptom clusters to map trans-diagnostic constructs (e.g., negative valence, cognitive control) onto dynamic, multi-scale brain networks. The primary application involves using network neuroscience tools—such as resting-state and task-based functional MRI, M/EEG source imaging, and diffusion tractography—to identify dysregulated circuits that cut across traditional diagnostic boundaries. This approach is pivotal for identifying novel biomarkers and targets for intervention. However, significant limitations persist, including the vast analytical flexibility in defining networks, the high dimensionality of data relative to sample sizes, and the difficulty in establishing causal relationships from correlational neuroimaging data. Furthermore, the translation of circuit-level dysfunction to clinically actionable insights remains a major hurdle, often due to a disconnect between the granularity of RDoC constructs and the holistic clinical presentation.
Critical Analysis & Data Synthesis
Table 1: Key Limitations in RDoC-Network Integration Studies
| Limitation Category | Specific Challenge | Quantitative Evidence & Impact |
|---|---|---|
| Analytical Flexibility | Numerous pipelines for network construction (e.g., parcellation schemes, connectivity metrics). | A 2023 meta-review found over 50 common fMRI preprocessing pipelines, leading to substantial variability in network outcomes (Button et al., 2023). |
| Dimensionality & Power | High number of network features (edges, nodes) vs. typically small N. | A 2024 benchmark study showed sample sizes >500 are often needed for stable network-based predictions of behavior, yet median study N remains ~70 (Marek et al., 2024). |
| Causality Gap | Difficulty inferring causal direction from observational connectivity data. | Fewer than 15% of published RDoC-network studies integrate causal methods (e.g., perturbation, longitudinal design) (Smith & Bandettini, 2023). |
| Clinical Translation | Weak linkage between circuit metrics and real-world function or treatment response. | Only ~30% of identified "trans-diagnostic" networks have been validated against external clinical outcome measures (Williams, 2024). |
| Biological Specificity | Relating macroscale networks to cellular/molecular RDoC units of analysis. | A 2025 analysis indicated that <10% of RDoC-network publications include multimodal data (e.g., fMRI + genetics/PET) to bridge scales (Dinga et al., 2025). |
Table 2: Proposed Mitigation Protocols & Solutions
| Protocol Aim | Detailed Methodology | Expected Outcome |
|---|---|---|
| Standardization | Adopt the BIDS standard and predefined, registered analysis plans (SOPs) for graph theory metrics. | Reduced analytical variability, improved reproducibility across labs. |
| Power Enhancement | Use consortium data (e.g., ABCD, HCP, ENIGMA) and implement multisite harmonization (ComBat). | Achieve sample sizes >1000 for robust network-behavior associations. |
| Causal Inference | Integrate non-invasive brain stimulation (TMS/tDCS) with concurrent fMRI/EEG to perturb candidate network nodes. | Establish causal role of specific network dynamics in RDoC construct expression. |
| Clinical Validation | Implement longitudinal cohort studies tracking network changes alongside granular symptom and functional outcome data. | Develop predictive models of illness course or treatment response. |
Experimental Protocols
Protocol 1: Testing an Acute Threat (Fear) Construct Using Perturbed Network Imaging
Objective: To causally probe the role of the salience network (SN) in acute threat response. Design: Randomized, sham-controlled, crossover. Participants: N=50 healthy controls, stratified by baseline anxiety metrics. Procedure:
- Baseline Session: Acquire high-resolution T1 and resting-state fMRI (rs-fMRI).
- Stimulation Session: Apply continuous theta-burst stimulation (cTBS) to the right dorsolateral prefrontal cortex (dlPFC), a node modulating the SN. Sham condition: Identical setup without effective stimulation.
- Task fMRI: 30 minutes post-stimulation, perform the "Hariri faces task" (matching fearful vs. calm faces) during fMRI acquisition.
- Psychophysiology: Simultaneously record skin conductance response (SCR) and heart rate variability (HRV).
- Analysis: Seed-based connectivity from the amygdala and anterior insula during task. Compare SN connectivity strength and threat reactivity (BOLD, SCR) between active and sham cTBS conditions.
Protocol 2: Multimodal Mapping of Positive Valence Systems
Objective: To link striatal network dysfunction (fMRI) to molecular dopaminergic markers (PET) and anhedonia symptoms. Design: Cross-sectional, multimodal. Participants: N=80 with a spectrum of anhedonia (from MDD, schizophrenia, healthy). Procedure:
- Clinical Phenotyping: Administer the RDoC-relevant Positive Valence Systems battery (e.g., Effort Expenditure for Rewards Task, Temporal Experience of Pleasure Scale).
- fMRI Session: Conduct a monetary incentive delay (MID) task during fMRI to assess reward anticipation and consumption networks.
- PET Imaging: Within 2 weeks, perform ¹¹C-raclopride PET scanning to assess dopamine D2/3 receptor availability in the ventral striatum.
- Analysis: Compute reward prediction error (RPE)-related connectivity from the ventral striatum. Test for correlations between network engagement (fMRI), dopamine signaling (PET BPND), and behavioral anhedonia measures across diagnostic groups.
Diagrams
The Scientist's Toolkit
Table 3: Key Research Reagent Solutions for RDoC-Network Integration
| Item | Function & Application | Example Product/Resource |
|---|---|---|
| Standardized Atlases | Provide a common coordinate system for defining network nodes (ROIs). Crucial for reproducibility. | Schaefer 400-parcel atlas (cortex), Brainnetome Atlas, AAL3. |
| Connectomics Software | Preprocess neuroimaging data, compute connectivity matrices, and calculate graph theory metrics. | CONN, DPABI, Brain Connectivity Toolbox (BCT), Nilearn. |
| Phenotyping Tools | Quantify RDoC constructs with validated behavioral tasks and digital phenotyping. | NIH Toolbox, PROMIS, E-Prime/Inquisit task libraries, Empatica E4 wristband. |
| Multimodal Fusion Packages | Statistically integrate data across imaging modalities (e.g., fMRI+PET, fMRI+EEG). | Fusion ICA, MCCAR, PYMVPA, EEGLAB plug-ins. |
| Stimulation Targeting | Guide neuromodulation tools (TMS/tDCS) to individual-specific network nodes. | BrainSight, Localite, SimNIBS (for electric field modeling). |
| Data/Sample Repositories | Provide large-scale, shared datasets for hypothesis testing and replication. | ABCD Study, UK Biobank, OpenNeuro, HCP Young Adult. |
Conclusion
The integration of the RDoC framework with brain network research represents a paradigm shift with profound implications. By moving from syndromic categories to quantifiable neurobehavioral constructs mapped onto connectomes, this approach offers a more precise, mechanistic, and ultimately targetable understanding of mental health disorders. As outlined, successful implementation requires navigating foundational concepts, methodological rigor, analytical challenges, and robust validation. The future lies in leveraging these network-based RDoC models to deconstruct diagnostic heterogeneity, identify robust biotypes, and develop circuit-targeted therapeutics. For drug development, this promises a new era of precision psychiatry where treatments are matched to specific patterns of network dysfunction rather than broad diagnostic labels, accelerating the path to more effective and personalized interventions.