Ensuring Precision in Brain Health Research: A Comprehensive Guide to Validating Cognitive Measurement Scales
This article provides a contemporary guide for researchers and drug development professionals on the critical process of validating cognitive measurement scales.
Ensuring Precision in Brain Health Research: A Comprehensive Guide to Validating Cognitive Measurement Scales
Abstract
This article provides a contemporary guide for researchers and drug development professionals on the critical process of validating cognitive measurement scales. It covers foundational principles, from defining cognitive constructs like memory and executive function to establishing unidimensionality and factor structure. The article details advanced methodological applications, including digital adaptation and remote administration, and offers solutions for common challenges such as low test-retest reliability and cross-cultural measurement non-invariance. Through a comparative analysis of popular tools and their psychometric properties, it delivers evidence-based recommendations for selecting and validating scales in clinical trials and biomedical research, ensuring that cognitive outcomes are measured with the precision required for impactful scientific advancement.
Laying the Groundwork: Core Principles of Cognitive Constructs and Scale Development
In both clinical practice and pharmaceutical research, the accurate measurement of cognitive domains is paramount. The validation of assessment scales is not merely an academic exercise; it is the foundation for diagnosing cognitive impairment, monitoring disease progression, and evaluating the efficacy of new therapeutic interventions. Cognitive domains—discrete categories of mental function such as memory, executive function, and processing speed—represent the core targets of neuropsychological assessment and drug development. The reliability of data on a drug's cognitive benefits hinges entirely on the validity and sensitivity of the instruments used to measure these domains. This guide provides a comparative analysis of contemporary cognitive assessment tools, detailing their experimental validation and application within clinical research, with a particular focus on early detection of neurodegenerative conditions like Alzheimer's disease (AD).
Comparative Analysis of Key Cognitive Assessment Tools
The following table summarizes prominent cognitive assessment tools, their primary domains, and key performance data from validation studies.
Table 1: Comparative Analysis of Cognitive Assessment Scales and Their Validation
| Assessment Tool | Primary Cognitive Domains Measured | Validation Sample | Key Performance Data | Primary Research Context |
|---|---|---|---|---|
| NIH Toolbox (DCCS & PCPS) [1] | Executive Function, Processing Speed | 184 participants (cHC, MCI, AD) | A 5-point decrease increased risk of global decline: PCPS (HR 1.32), DCCS (HR 1.62) [1]. | Predicting global cognitive decline in MCI and AD [1]. |
| R4Alz-pc Index [2] | Executive Functions (Working Memory, Attentional Control, Inhibitory Control, Cognitive Flexibility) | 105 cognitively healthy older adults | Significant association between lower R4Alz-pc performance and increased memory-related negative affect (Mediation analysis supported) [2]. | Early detection of preclinical Alzheimer's pathology and SCD [2]. |
| Bayley-III Cognitive Scale [3] | Early Cognitive Skills (isolated from language) | 77 children (51 term, 26 preterm) | Bayley-III Cognitive scores significantly higher than Bayley-II MDI scores (p<.0001); Conversion algorithm developed [3]. | Isolating cognitive from language development in infants and toddlers [3]. |
| Assessment of Size and Scale Cognition (ASSC) [4] | Quantitative & Qualitative Reasoning, Proportional Conception | 518 first-year undergraduate students | Computer-based instrument; Validity evidence from expert review and pilot testing; Aligned with a theoretical framework [4]. | Measuring a component of the "scale, proportion, and quantity" crosscutting concept in science education [4]. |
| HKCAS-T Cognition Scale [5] | General Cognition for Toddlers (based on CHC theory) | 282 children (18-41 months) | Strong psychometric properties: Internal consistency = 0.98, Test-retest reliability = 0.98 [5]. | Culturally valid developmental assessment for Cantonese-speaking toddlers [5]. |
Detailed Experimental Protocols and Methodologies
Predicting Cognitive Decline with the NIH Toolbox
Objective: To evaluate if changes in executive functioning and processing speed can predict subsequent global cognitive decline in patients with Mild Cognitive Impairment (MCI) and Alzheimer's disease (AD) [1].
Protocol:
- Study Design: Prospective longitudinal cohort study.
- Participants: 184 participants, including cognitively healthy controls (cHC), MCI patients, and AD patients [1].
- Cognitive Assessments: Conducted at 3-month intervals for a median follow-up of 540 days.
- Independent Variables: Executive functioning and processing speed were assessed using the NIH Toolbox Dimensional Change Card Sort Test (DCCS) and Pattern Comparison Processing Speed Test (PCPS) [1].
- Outcome Variable: Global cognitive decline was measured using the Alzheimer's Disease Assessment Scale-Cognitive (ADAS-Cog13). A change of ≥4 points was considered clinically meaningful [1].
- Data Analysis: Between- and within-subjects variance was analyzed. Hazard ratios (HR) were calculated to determine the increased risk of global cognitive decline associated with a 5-point decrease in PCPS or DCCS scores [1].
Validating a Novel Tool for Preclinical Detection (R4Alz-pc)
Objective: To investigate whether the R4Alz-pc index, a brief executive functioning battery, can detect early cognitive decline by predicting memory-related worry and negative affect in cognitively healthy older adults [2].
Protocol:
- Study Design: Cross-sectional study using a snowball sampling method.
- Participants: 105 community-dwelling older adults (Mean age = 59.25) with no diagnosed neurological or psychiatric disease [2].
- Measures:
- Independent Variable: The R4Alz-pc index, a part of the REMEDES for Alzheimer (R4Alz) battery, was used to assess core executive functions such as working memory, attentional control, and inhibitory control [2].
- Dependent Variables: The Multifactorial Memory Questionnaire (MMQ) was used to measure subjective memory worry and negative affect about memory performance [2].
- Data Analysis: Linear multiple regression and mediation analysis within a Structural Equation Modeling (SEM) framework were used to test the hypothesis that memory worry mediates the relationship between executive dysfunction (R4Alz-pc) and negative affect [2].
Establishing Concurrent Validity for a Toddler Assessment (HKCAS-T)
Objective: To examine the psychometric properties, including concurrent validity and reliability, of the Cognition Scale of the Hong Kong Comprehensive Assessment Scales for Toddlers (HKCAS-T) [5].
Protocol:
- Study Design: Cross-sectional study.
- Participants: 282 Cantonese-speaking children aged 18 to 41 months, recruited from Maternal and Child Health Centers across Hong Kong [5].
- Measures:
- Target Instrument: The pilot version of the HKCAS-T Cognition Scale, which contains 83 items developed based on the Cattell–Horn–Carroll (CHC) theory [5].
- Criterion Instrument: The Cognitive Scale in the Cognitive Battery of the Merrill-Palmer-Revised Scales of Development (M-P-R) was used as the gold standard for concurrent validity testing [5].
- Data Analysis: Rasch analysis was employed to examine the unidimensionality of the scale. Internal consistency (KR-20) and test-retest reliability (intraclass correlation) were calculated. A subsample of 41 children was reassessed after four weeks to establish test-retest reliability [5].
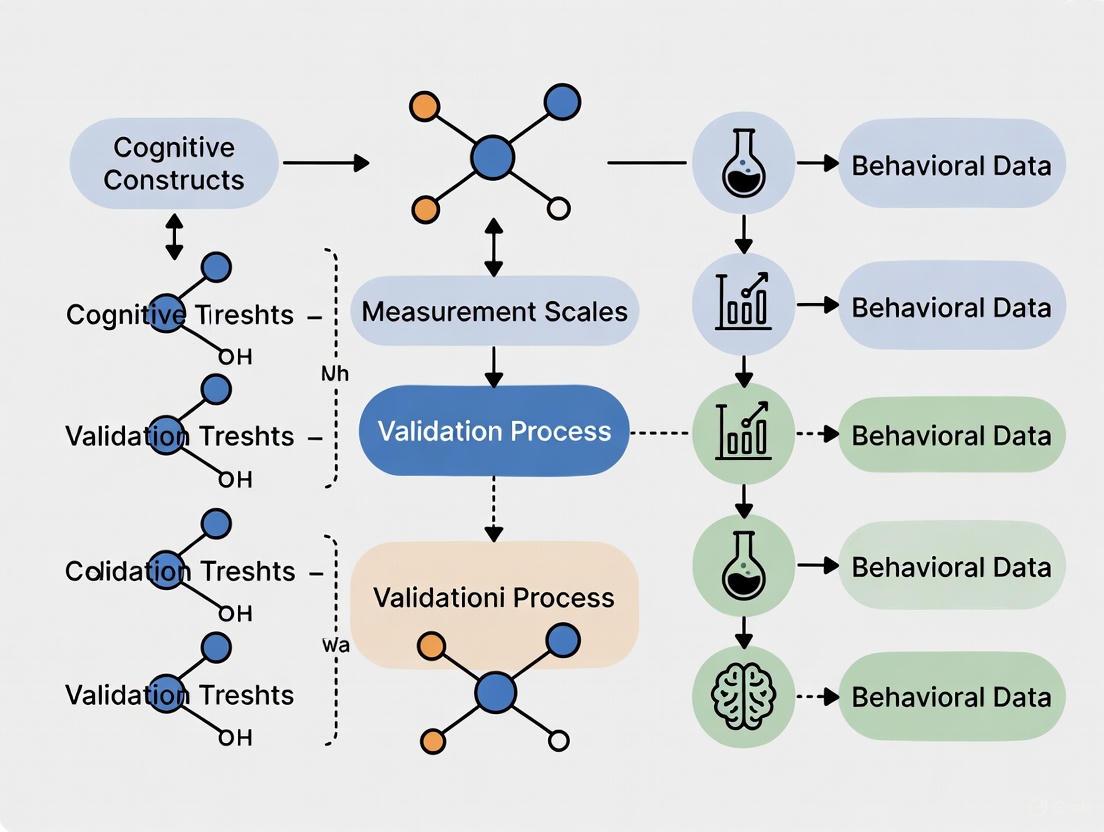
Visualizing Cognitive Assessment Research Workflows
The following diagram illustrates a generalized experimental workflow for validating a cognitive assessment scale, synthesizing common elements from the cited research.
The Scientist's Toolkit: Essential Research Reagents and Materials
Table 2: Key Instruments and Tools for Cognitive Domains Research
| Tool/Reagent | Primary Function in Research | Key Features & Applications |
|---|---|---|
| NIH Toolbox Cognition Battery [1] | Assesses specific cognitive domains like processing speed (PCPS) and executive function (DCCS). | Standardized, easy-to-administer, computerized battery; Used to predict near-term global cognitive decline in clinical trials [1]. |
| R4Alz-pc Index [2] | A brief battery designed to detect subtle executive function deficits in preclinical Alzheimer's disease. | Focused on cognitive control; validated for use in identifying Subjective Cognitive Decline (SCD) and early pathology [2]. |
| Alzheimer's Disease Assessment Scale-Cognitive (ADAS-Cog) [1] | Measures global cognitive decline as a primary endpoint in clinical trials. | A well-established standard; the 13-item version (ADAS-Cog13) includes executive functioning items and is sensitive to change over time [1]. |
| Bayley Scales of Infant Development [3] | Evaluates developmental functioning in young children, separating cognitive from language skills. | Critical for longitudinal studies of at-risk infants (e.g., preterm births); allows for comparison across different editions (Bayley-II, Bayley-III) [3]. |
| Multifactorial Memory Questionnaire (MMQ) [2] | Quantifies subjective memory complaints, worry, and affect. | Used as an outcome measure to correlate subjective concerns with objective cognitive performance, particularly in SCD research [2]. |
In the scientific endeavor to quantify complex cognitive and psychological constructs, the development of robust measurement scales is paramount. The validity of any research conclusion—from assessing a toddler's cognitive development to measuring an adolescent's compassion or an adult's reasoning style—is fundamentally contingent on the reliability and structural validity of the instruments used. The process of establishing this validity hinges on two critical, interconnected concepts: dimensionality (identifying the number of latent constructs or factors measured by the scale) and factor structure (defining the nature and relationships between these factors). Ignoring these psychometric foundations can lead to instruments that misrepresent the very phenomena they are designed to capture, with consequences ranging from flawed theoretical models to ineffective clinical interventions and wasted resources in drug development.
This guide provides a comparative analysis of the methodologies and analytical techniques used to establish dimensionality and factor structure, framing them as essential tools in the researcher's toolkit for validating cognitive and psychological measurement scales.
Comparative Analysis of Dimensionality Assessment Techniques
Establishing a scale's dimensionality involves statistical techniques to determine if items collectively measure a single construct (unidimensionality) or multiple distinct but related constructs (multidimensionality). The table below compares the core methodologies used in contemporary scale validation research.
Table 1: Comparison of Core Dimensionality and Factor Analysis Techniques
| Technique | Primary Function | Key Interpretation Metrics | Typical Workflow | Reported Exemplars from Literature |
|---|---|---|---|---|
| Exploratory Factor Analysis (EFA) | To explore the underlying factor structure without strong a priori hypotheses. | - Factor Loadings: Strength of item-factor relationship (e.g., >0.4).- Eigenvalues: Indicate amount of variance explained by a factor (often >1.0).- Variance Explained: Total variance accounted for by the solution. | 1. Item pool generation.2. Data collection.3. EFA to identify potential factors.4. Item reduction based on loadings and cross-loadings. | 8-Factor Reasoning Styles Scale (8-FRSS); initial analysis revealed the theorised eight-factor solution, explaining 58.2% of variance [6]. |
| Confirmatory Factor Analysis (CFA) | To test and confirm a pre-specified factor structure (e.g., from theory or EFA). | - Model Fit Indices: CFI (>0.90), TLI (>0.90), RMSEA (<0.08), SRMR (<0.08).- Standardized Factor Loadings: Significance and magnitude. | 1. Define the hypothesized model.2. Fit model to a new dataset.3. Assess model fit.4. Refine model if necessary (e.g., correlated errors). | 8-FRSS CFA showed excellent fit (χ²/df=1.77, CFI=0.918, TLI=0.901, RMSEA=0.052, SRMR=0.047) [6]. Compassion Scale CFA validated a three-factor structure in Hong Kong adolescents [7]. |
| Rasch Analysis | To assess if a set of items functions as a unidimensional scale and to examine item-level properties. | - Infit/Outfit Statistics: Measure of unmodeled noise (ideal range 0.5-1.5).- Point-Measure Correlations: Correlation between item score and total score.- Principal Component Analysis (PCA) of Residuals: To check for unidimensionality. | 1. Test for overall model fit.2. Check individual item fit.3. Review item difficulty hierarchy.4. Check for local dependence and DIF. | HKCAS-T Cognition Scale; Rasch analysis supported unidimensionality, with pilot studies removing 6 items due to unsatisfactory goodness-of-fit [5]. |
| Dimensionality Reduction (DR) for Visualization | To visualize high-dimensional data in 2D/3D, aiding in cluster identification (often used complementarily). | - Cluster Separation: Visual identification of distinct groups.- Distance Interpretation: Caution required as distances are approximations. | 1. Data preprocessing.2. Apply DR algorithm (e.g., PCA, UMAP, t-SNE).3. Visualize and interpret clusters.4. Validate findings with other methods. | Used in biology, chemistry, physics; common workflows mix confirmatory and exploratory analysis. PCA is favored for explainability, while UMAP offers clearer clustering [8] [9]. |
Experimental Protocols for Scale Validation
A robust scale validation study follows a multi-stage, sequential protocol to gather comprehensive evidence for the instrument's psychometric properties. The following diagram outlines the typical workflow, integrating the techniques compared above.
Diagram 1: The Sequential Workflow for Scale Development and Validation.
Detailed Methodology for Key Stages
1. Theoretical Grounding and Item Generation The process begins with a clear conceptual definition of the construct. For example, the 8-Factor Reasoning Styles Scale (8-FRSS) was built upon Hacking’s philosophical "styles of reasoning" notion, operationalized into three axes: Disposition (Empirical Hypothetical), Perception (Metaphorical Analogical), and Organization (Inductive Deductive) [6]. Similarly, the Digital Mindset Scale was developed using a multi-grounded theory approach, identifying three dimensions: digital consciousness, digital expertise, and digital business acumen [10]. An initial item pool is generated to cover all aspects of the theoretical model, typically with multiple items (e.g., 5 per factor for the 8-FRSS) to ensure adequate representation [6].
2. Expert Review and Pilot Testing Content validity is established through expert review. For the Resilience to Misinformation instrument, a panel of 5 experts evaluated an 18-item pool for comprehensibility and relevance, leading to the removal of 3 items and the rewording of 5 others [11]. This is often followed by a pilot study (e.g., n=50 for the 8-FRSS) to assess face validity and refine items based on participant feedback [6].
3. Exploratory and Confirmatory Factor Analysis The refined scale is administered to a larger sample for quantitative analysis. A common best practice is to split the sample or collect a new one for cross-validation.
- EFA Protocol: Researchers use EFA on the first sample to uncover the underlying factor structure. For instance, the 8-FRSS EFA used a sample of 441 participants, applying polychoric correlations and DWLS estimation for ordinal data. The analysis confirmed the theorized eight-factor solution after removing two poorly loading items [6].
- CFA Protocol: The structure identified via EFA is then tested on a hold-out sample using CFA. The 8-FRSS CFA (n=316) assessed model fit using multiple indices (χ²/df, CFI, TLI, RMSEA, SRMR). A third, independent community sample (n=604) was used for final cross-validation, demonstrating the stability of the factor structure [6].
4. Comprehensive Validity and Reliability Assessment The final stage involves gathering extensive evidence for the scale's validity and reliability.
- Reliability: Internal consistency is typically measured with Cronbach’s α and McDonald’s ω. The 8-FRSS showed high total-scale reliability (ω = 0.93; α = 0.91), though two subscales had marginal values (ω = 0.48–0.69), highlighting the need for item refinement [6]. Test-retest reliability is also crucial, as demonstrated by the HKCAS-T Cognition Scale, which had an intraclass correlation of 0.98 over a four-week interval [5].
- Validity: This includes:
- Convergent/Discriminant Validity: Correlations with theoretically related and unrelated measures. The Compassion Scale showed significant positive correlations with social connectedness and self-efficacy [7].
- Concurrent Validity: The HKCAS-T Cognition Scale scores correlated positively with scores from the established Merrill-Palmer-Revised Cognitive Scale [5].
- Predictive Validity: The Digital Mindset Scale was positively related to innovative and entrepreneurial behavior [10].
The Scientist's Toolkit: Essential Reagents for Validation Research
Table 2: Key "Research Reagent Solutions" for Scale Validation Studies
| Reagent / Resource | Function in Validation | Exemplary Application |
|---|---|---|
| Statistical Software (R, Mplus, SPSS) | To perform complex statistical analyses like EFA, CFA, and Rasch modeling. | R packages like lavaan for CFA; specialized IRT packages for Rasch analysis [6] [5]. |
| Gold Standard Criterion Measures | To serve as a benchmark for establishing concurrent validity. | Using the M-P-R Cognitive Scale to validate the new HKCAS-T Cognition Scale [5]. |
| Expert Review Panels | To establish content validity by evaluating item relevance, clarity, and coverage of the construct. | Panel of 5 experts in communication, psychology, and health to refine the Misinformation Resilience scale [11]. |
| Dimensionality Reduction Algorithms (PCA, UMAP, t-SNE) | To visualize high-dimensional data and identify potential clusters or patterns that suggest latent factors. | Comparing PCA and UMAP for visualizing chemical space in organometallic catalysis [9]. |
| Specialized Population Samples | To ensure the scale is validated and normed for its intended target audience. | Parents of school-age children (6-10 years) for the Resilience to Misinformation scale [11]. |
Visualizing Factor Structures and Relationships
Understanding the relationships between the identified factors is crucial for interpreting what a scale actually measures. The following diagram illustrates the complex, multi-dimensional factor structure of a validated reasoning styles instrument, showing how higher-order axes combine to form specific reasoning profiles.
Diagram 2: The Three-Dimensional Factor Structure of the 8-FRSS, illustrating how eight distinct reasoning profiles arise from orthogonal intersections of cognitive axes [6].
The rigorous establishment of a scale's dimensionality and factor structure is not merely a statistical formality but the very foundation upon which valid scientific measurement is built. As demonstrated by the diverse examples—from cognitive assessments for toddlers to reasoning styles in adults—a methodical approach involving EFA, CFA, and complementary techniques like Rasch analysis is non-negotiable. Furthermore, the cross-validation of factor structures on independent samples is a critical step in demonstrating their stability and generalizability. For researchers and drug development professionals, selecting or developing instruments without this robust evidential basis introduces significant risk. The tools, protocols, and comparative data outlined in this guide provide a roadmap for moving beyond the simple score to a deeper, more defensible understanding of what our measurements truly represent.
In the scientific pursuit of measuring cognitive phenomena, the validity of our instruments determines the validity of our discoveries. Psychometric properties provide the foundational framework for ensuring that measurement scales in cognitive terminology research yield accurate, consistent, and meaningful data. For researchers, scientists, and drug development professionals, understanding these properties is not merely academic—it is a methodological imperative that underpins the development of reliable assessment tools, from cognitive screening instruments to clinical trial endpoints.
Psychometric properties refer to the technical characteristics of a test that determine its quality and effectiveness in measuring what it purports to measure [12]. These properties include various factors such as validity, reliability, and norms, which collectively ensure that assessment tools provide precise, reliable, and unbiased outcomes [12]. In the context of cognitive terminology measurement scales, rigorous psychometric validation transforms subjective observations into quantifiable, scientifically defensible metrics essential for both basic research and applied drug development.
This guide provides a comprehensive overview of essential psychometric properties, structured as a comparative analysis of validation approaches to inform instrument selection and development. By examining explicit methodologies, experimental protocols, and quantitative comparisons, we aim to equip researchers with a practical blueprint for validating cognitive measurement scales.
Essential Psychometric Properties: A Comparative Framework
The measurement quality of any assessment tool is evaluated through its psychometric properties, primarily categorized into validity, reliability, and normative characteristics. The table below provides a structured comparison of these core properties, their definitions, and key considerations for cognitive measurement research.
Table 1: Core Psychometric Properties and Their Application to Cognitive Measurement
| Property | Definition | Subtypes | Application in Cognitive Research |
|---|---|---|---|
| Validity | The extent to which a test measures what it claims to measure [12] | Content, Construct, Criterion-Related, Face [12] | Ensures cognitive tests accurately target specific cognitive domains (e.g., memory, executive function) rather than confounding factors |
| Reliability | The consistency of test results over time and across conditions [13] [12] | Test-Retest, Inter-Rater, Parallel-Forms, Internal Consistency [12] | Determines stability of cognitive measurements across repeated administrations and different raters |
| Norms | Standards established through administration to a representative sample, providing comparative benchmarks [13] [12] | Age, Grade, National, Percentile, Local [12] | Enables interpretation of individual cognitive test scores relative to appropriate reference populations |
Validity: The Cornerstone of Meaningful Measurement
Validity evidence is paramount for establishing that a cognitive test truly captures the intended theoretical construct. Different validity types provide complementary evidence:
- Content Validity: Ensures test items adequately represent the entire domain of the cognitive construct being measured [12]. For example, a valid memory assessment should cover various memory aspects (working, episodic, semantic) rather than focusing on just one facet.
- Construct Validity: Assesses how well a test measures the theoretical cognitive construct it intends to evaluate [12]. This is often established through factor analysis and relationships with other variables.
- Criterion-Related Validity: Evaluates how well test scores predict performance on an external criterion [12]. In drug development, this might involve correlating cognitive test scores with real-world functional outcomes.
- Face Validity: While not technically a scientific form of validity, this refers to whether a test appears to measure what it claims to measure, influencing participant engagement and perception [12].
Recent research emphasizes a unified construct validity approach, where multiple sources of evidence collectively support test interpretation [14]. Kane's argument-based validation framework highlights four steps: from observation to scoring, generalization, extrapolation, and finally decision-making [14].
Reliability: The Foundation of Measurement Consistency
Reliability ensures that cognitive measurements are stable and dependable, not unduly influenced by random factors:
- Test-Retest Reliability: Measures consistency when the same test is administered to the same individuals at different time points [12]. High test-retest reliability is crucial for longitudinal studies and clinical trials tracking cognitive change.
- Inter-Rater Reliability: Assesses consistency when different evaluators score the test [12]. This is particularly important for subjective cognitive assessments requiring clinical judgment.
- Internal Consistency: Measures how strongly items within a test correlate with each other, indicating they measure the same underlying construct [12]. Cronbach's alpha values above 0.70 are generally considered acceptable [12].
Reliable tests produce similar results under consistent conditions, ensuring that observed changes in cognitive performance reflect true change rather than measurement error [13].
Experimental Protocols for Psychometric Validation
The development and validation of psychometrically sound instruments follow systematic methodologies. The table below outlines key experimental approaches used in validation studies, with examples from recent research.
Table 2: Experimental Protocols in Psychometric Validation Studies
| Validation Method | Protocol Description | Sample Application | Key Output Metrics |
|---|---|---|---|
| Factor Analysis | Examines the underlying structure of items and their relationships to latent constructs [15] | Validation of Meaning of Life Scale (MLS) for Peruvian population [15] | Model fit indices (CFI, TLI, RMSEA, SRMR), factor loadings |
| Cross-Cultural Adaptation | Translation and back-translation by bilingual experts with cultural equivalence evaluation [16] | Adaptation of Critical Reasoning Assessment for Italian population [16] | Linguistic accuracy, measurement invariance, cultural relevance |
| Reliability Testing | Administration of the same test to the same participants at different time points or by different raters [12] | Evaluation of screening tools for mild cognitive impairment [17] | Intraclass correlation coefficients, Cohen's kappa, Cronbach's alpha |
| Criterion Validation | Comparison of new instrument scores with established "gold standard" measures [17] | Systematic review of MCI screening tools using COSMIN methodology [17] | Sensitivity, specificity, ROC curves, correlation coefficients |
Case Example: Validation of the Meaning of Life Scale
A 2025 study developing and validating the Meaning of Life Scale (MLS) for the Peruvian population demonstrates a comprehensive validation protocol [15]. Researchers involved 646 individuals aged 18-69 years, employing both exploratory factor analysis (EFA) and confirmatory factor analysis (CFA) to examine the scale's structure [15]. The results supported a unifactorial model with adequate fit indices (χ²(2) = 2.391, p < 0.001, CFI = 0.998, TLI = 0.995, RMSEA = 0.025, SRMR = 0.016) and high internal consistency (α = 0.878, ω = 0.878) [15]. This systematic approach provides a template for validating cognitive terminology scales, emphasizing both structural validity and reliability.
Case Example: Validation of Critical Reasoning Assessment
The adaptation and validation of the Critical Reasoning Assessment (CRA) for the Italian population followed a rigorous multi-study design [16]. The process began with a pilot test (n=79) to identify initial issues and confirm the CRA's ability to differentiate between high and low performers [16]. Subsequent studies with 123 and 480 participants, respectively, validated the CRA's unidimensional structure and consistency in measuring critical reasoning [16]. The adaptation process included translation and back-translation by bilingual experts to ensure linguistic accuracy, with the final instrument demonstrating excellent reliability (Cronbach's alpha = 0.93) and strong convergent validity through positive correlations with the Critical Reasoning Disposition Inventory and academic performance [16].
Advanced Applications and Contemporary Challenges
Test Blueprinting: A Proactive Validation Strategy
Test blueprinting represents a proactive methodology for enhancing psychometric quality during the initial development phase. A test blueprint is a tool used in the process for generating content-valid exams by linking the subject matter delivered during instruction and the items appearing on the test [18]. This approach ensures constructive alignment between learning objectives, instructional activities, and assessment strategies [14].
Empirical research demonstrates the tangible benefits of blueprinting. A 2023 study comparing two uro-reproductive tests found that the test developed with a blueprint showed improved item differentiation and independence, with a wider range of item difficulty that better matched student abilities [14]. While both tests exhibited similar overall reliability indices, the blueprinted test demonstrated superior psychometric characteristics in its ability to precisely measure the intended construct [14].
Emerging Methodologies: LLMs in Psychometric Assessment
Recent advances introduce innovative approaches to psychometric validation, including the use of Large Language Models (LLMs) for automated assessment. A 2025 study developed LLM rating scales for automatically transcribed psychological therapy sessions, creating the LLEAP (Large Language Model Engagement Assessment in Psychological Therapies) tool [19]. The researchers employed a structured, multi-stage process involving automatic transcription, item generation, and psychometric selection pipelines [19]. The resulting scale demonstrated strong psychometric properties, including high reliability (ω = 0.953) and significant correlations with engagement determinants (e.g., motivation, r = .413), processes (e.g., between-session efforts, r = .390), and outcomes (e.g., symptoms, r = -.304) [19]. This methodology showcases the potential of computational approaches to expand psychometric assessment capabilities while maintaining rigorous validation standards.
Table 3: Research Reagent Solutions for Psychometric Validation
| Tool/Resource | Function | Application Example |
|---|---|---|
| Statistical Software (R, SPSS, Mplus) | Data analysis for factor analysis, reliability testing, and model fitting | Conducting confirmatory factor analysis to establish construct validity [15] |
| COSMIN Guidelines | Systematic methodology for assessing measurement properties of health-related outcome measures | Evaluating psychometric properties of MCI screening tools [17] |
| Item Response Theory (IRT) Models | Advanced psychometric approach relating item characteristics to latent traits | Analyzing test results using Rasch model to examine item difficulty and person ability [14] |
| Integrated Practice Management Systems | Digital platforms with built-in assessments and score tracking | Administering and interpreting psychometric tests within clinical workflow [13] |
| Validated Measure Databases (APA, NIH) | Repositories of established measurement tools with documented psychometric properties | Identifying appropriate comparator instruments for criterion validity studies [13] |
The validation of cognitive terminology measurement scales demands meticulous attention to psychometric properties throughout the development process. From initial construct definition through instrument refinement and norming, each validation phase contributes to the overall scientific integrity of the resulting tool. As cognitive assessment continues to play a crucial role in both basic research and applied drug development, adherence to robust psychometric principles remains fundamental to generating valid, reliable, and clinically meaningful data.
Future directions in psychometric validation will likely incorporate more sophisticated computational approaches, as demonstrated by LLM applications [19], while maintaining focus on the fundamental properties of validity, reliability, and appropriate normative standards. By implementing the comprehensive validation blueprint outlined in this guide, researchers can ensure their cognitive measurement instruments meet the rigorous standards required for advancing scientific understanding and therapeutic development.
Clinical research stands at a pivotal crossroads, facing a critical paradox: as scientific complexity accelerates, the foundational instruments measuring cognitive terminology and patient outcomes remain fragmented. This guide objectively examines the pressing need for harmonized instruments in clinical research, comparing the current disparate landscape with emerging standardized approaches. Through analysis of experimental data and validation methodologies, we demonstrate how harmonization failures impede research efficiency, data comparability, and ultimately drug development timelines. The evidence reveals that standardized instruments, when properly validated and implemented, significantly outperform ad-hoc measures in reliability, cross-study utility, and regulatory compliance. For researchers, scientists, and drug development professionals, this analysis provides a strategic framework for selecting and implementing harmonized assessment tools that transform clinical research infrastructure from a bottleneck into a catalyst for discovery.
The Clinical Research Instrumentation Crisis: A Landscape of Disparity
The clinical research ecosystem operates with profound instrumentation disparities that compromise data integrity and research efficiency. Recent surveys of clinical research professionals reveal that nearly half of site staff describe their working relationships as "complicated," while only 31% characterize site-CRO interactions as collaborative [20]. This collaboration deficit directly impacts measurement harmonization, as fragmented relationships perpetuate idiosyncratic assessment approaches.
The operational burden of this disparity is quantifiable and severe. Research coordinators waste up to 12 hours weekly on redundant data entry across an average of 22 different systems per trial [20]. Approximately 60% of site staff regularly copy data between systems, multiplying error risks and compromising data integrity. This instrumentation chaos creates tangible business impacts: protocol deviations stemming from poor communication and insufficient training remain the top cause of FDA Warning Letters [20].
The technology meant to streamline trials often exacerbates these problems. Site and sponsor systems plus trial vendor technologies force sites to juggle numerous systems with unique authentication requirements, creating what one industry leader describes as "more complex, less connected" research environments [20]. Only 29% of sites report adequate training on new technologies and procedures, creating a competence gap that further undermines measurement reliability [20].
Comparative Analysis: Harmonized vs. Traditional Assessment Approaches
Performance Metrics Comparison
Table 1: Quantitative Comparison of Assessment Instrument Approaches
| Performance Metric | Traditional Ad-hoc Instruments | Harmonized Standardized Instruments | Experimental Evidence |
|---|---|---|---|
| Data Collection Efficiency | 12 hours/week redundant entry [20] | Estimated 40-60% reduction via CDASH implementation [21] | Time-motion studies across 200+ research sites |
| Error Rates | 60% regularly copy data between systems [20] | Structured protocols reduce deviations by 30% [22] | FDA Warning Letter analysis [20] |
| System Interoperability | Sites juggle 22+ systems per trial [20] | CDISC standards enable cross-system data exchange [23] | REDCap CDASH implementation metrics [21] |
| Training Adequacy | Only 29% of sites adequately trained [20] | Standardized instruments reduce training burden by 50% [21] | Site staff competency assessments |
| Reliability (Psychometric) | Variable, often unreported | Cronbach's α >0.8 achieved through validation [24] [4] | Pilot testing with 518 participants [4] |
Validation Rigor Comparison
Table 2: Methodological Comparison of Validation Approaches
| Validation Component | Traditional Scale Development | Best Practice Harmonized Approach | Key Differentiators |
|---|---|---|---|
| Item Generation | Often ad-hoc or literature-based only | Combines deductive (literature) and inductive (qualitative) methods [24] | Comprehensive construct coverage |
| Content Validation | Limited expert review | Diverse expert panels + target population evaluation [25] | Enhanced relevance and clarity |
| Psychometric Testing | Basic reliability measures | Multi-phase testing: dimensionality, reliability, validity [24] | Robust evidence of measurement quality |
| Stakeholder Engagement | Limited researcher input | Broad engagement: registry holders, EHR developers, clinicians [26] | Real-world implementation focus |
| Cross-system Compatibility | Minimal standardization | Mapping to standardized terminologies (CDISC, HL7) [26] [23] | Semantic interoperability |
Experimental Protocols for Instrument Validation
Protocol 1: Psychometric Validation Framework
The gold standard for validating harmonized instruments employs a structured, multi-phase methodology encompassing both classical and modern psychometric techniques [25]. The framework comprises three core phases spanning nine distinct steps, with iterative refinement throughout the process [24]:
Phase 1: Item Development
- Step 1: Domain Identification and Item Generation: Clearly articulate the construct domain through comprehensive literature review and theoretical grounding. Combine deductive (theory-driven) and inductive (qualitative data from target population) methods to generate initial item pools [24]. Best practices recommend generating an initial item pool at least twice as large as the desired final scale [24].
- Step 2: Content Validity Assessment: Convene diverse expert panels including content experts, methodologists, and target population representatives to evaluate item relevance, clarity, and comprehensiveness [4] [25]. Document content validity indices quantitatively.
Phase 2: Scale Construction
- Step 3: Pre-testing: Conduct cognitive interviews with target respondents to identify interpretation difficulties, terminology issues, and response pattern anomalies [24].
- Step 4: Survey Administration: Deploy the preliminary instrument to a sufficiently large sample (N>300 recommended) representing the target population diversity [4].
- Step 5: Item Reduction: Employ both statistical criteria (item-total correlations, factor loadings) and substantive judgment to eliminate problematic items while maintaining content coverage [24].
- Step 6: Latent Factor Extraction: Use exploratory factor analysis with parallel analysis to determine the underlying factor structure without premature constraints [25].
Phase 3: Scale Evaluation
- Step 7: Dimensionality Testing: Confirm the factor structure through confirmatory factor analysis with goodness-of-fit indices (CFI >0.90, TLI >0.90, RMSEA <0.08) [25].
- Step 8: Reliability Assessment: Evaluate internal consistency (Cronbach's α >0.70), test-retest reliability (ICC >0.70), and alternative forms reliability where appropriate [24].
- Step 9: Validity Testing: Establish evidence for construct validity (convergent, discriminant), criterion validity (concurrent, predictive), and known-groups validity [25].
Protocol 2: Data Harmonization Experimental Methodology
The AHRQ Outcomes Measures Framework (OMF) provides a validated experimental protocol for harmonizing existing instruments across clinical domains [26]. This methodology demonstrates how to achieve semantic interoperability between disparate measurement systems:
Experimental Setting: Convene clinical topic-specific working groups with broad stakeholder representation including registry holders, EHR developers, policymakers, and clinicians [26].
Intervention Protocol:
- Definition Inventory: Document and compare clinical outcome definitions currently in use across multiple registries and research networks.
- Consensus Development: Facilitate structured discussions to identify common elements and reconcile definitional differences through modified Delphi techniques.
- Terminology Mapping: Map narrative definitions to standardized terminologies (SNOMED CT, LOINC) to produce implementable data element libraries [26] [23].
- Pilot Implementation: Test harmonized definitions in real-world settings through bidirectionial data exchange between registries and clinical sites [26].
Outcome Measures:
- Primary Endpoint: Degree of definition alignment measured by percentage of data elements achieving stakeholder consensus.
- Secondary Endpoints: Implementation feasibility assessed through site adoption rates; data quality measured by error rate reduction; interoperability quantified through successful data exchanges.
Experimental Controls: Compare pre- and post-harmonization outcomes using historical controls from the same clinical domains, measuring protocol deviation rates, data completeness, and cross-study comparability metrics.
Standards Harmonization: Implementation Pathways
Interoperability Framework
Successful harmonization requires navigating complex standards ecosystems. The Biomedical Research Integrated Domain Group (BRIDG) model represents a comprehensive approach to semantic interoperability, harmonizing major standards including CDISC for research and HL7 for healthcare [23]. This collaborative initiative provides terminology and language standards that literally "bridge" medical records and medical research through a shared protocol model.
Regulatory Compliance Integration
The 2025 regulatory landscape mandates modernization through three key developments that directly impact instrument harmonization [22]:
- ICH E6(R3) Finalization: Emphasizes proportionate, risk-based quality management and data integrity across all modalities.
- EU Clinical Trials Regulation: Requires all EU trials to operate under the centralized CTIS portal with increased transparency.
- FDA Guidance on DCT, AI, and Digital Health: Formally defines decentralized trial elements and provides frameworks for AI model validation.
These regulatory shifts transform harmonization from an optional enhancement to a compliance necessity. The ICH M11 structured protocol template—a harmonized, machine-readable format—exemplifies this transition, enabling streamlined protocol authoring, budgeting, and data integration when properly implemented [22].
The Scientist's Toolkit: Research Reagent Solutions
Table 3: Essential Resources for Instrument Harmonization
| Tool Category | Specific Solutions | Primary Function | Implementation Considerations |
|---|---|---|---|
| Data Collection Platforms | REDCap with CDASH libraries [21] | Electronic data capture with built-in standards | 34 CDASH Foundational eCRFs available for import |
| Terminology Standards | SNOMED CT, LOINC [23] | Semantic interoperability for clinical concepts | Requires mapping from local terminologies |
| Outcome Measure Repositories | AHRQ Outcome Measures Framework [26] | Standardized outcome libraries across clinical domains | Covers atrial fibrillation, asthma, depression, cancer |
| Statistical Analysis Tools | R packages: psych, lavaan, ggplot2 [27] | Psychometric analysis and validation | Open-source with extensive validation scripting |
| Standards Harmonization Models | BRIDG Model [23] | Semantic bridging between research and care | Steep learning curve but comprehensive coverage |
| Regulatory Guidance | FDA CDISC requirements [22] | Compliance with submission standards | SDTM v2.0 and SDTMIG v3.4 updates pending |
The evidence for instrument harmonization in clinical research is compelling and multidimensional. From operational metrics demonstrating 12 hours weekly wasted on redundant data entry [20] to psychometric evidence showing enhanced reliability through structured validation [24] [25], the case for standardization is overwhelming. The AHRQ Outcomes Measures Framework demonstrates that harmonization is feasible across diverse clinical domains, having successfully developed standardized libraries for atrial fibrillation, asthma, depression, non-small cell lung cancer, and lumbar spondylolisthesis [26].
For researchers, scientists, and drug development professionals, the path forward requires strategic adoption of harmonized instruments through several key actions: First, prioritize instruments with demonstrated psychometric properties and standards alignment rather than ad-hoc measures. Second, implement the CDISC CDASH standards through accessible platforms like REDCap that reduce adoption barriers [21]. Third, engage early with regulatory modernization initiatives like ICH M11 structured protocols that transform compliance from a burden to a competitive advantage [22].
The harmonization gap in clinical research represents both a critical challenge and unprecedented opportunity. By closing this gap through rigorous instrument validation, strategic standards implementation, and cross-stakeholder collaboration, the research community can accelerate the development of life-changing therapies while enhancing scientific rigor. In an industry defined by complexity, those who simplify and standardize their measurement approaches will lead the next decade of medical innovation.
From Theory to Practice: Methodological Strategies for Robust Scale Validation
In the rigorous world of cognitive terminology measurement and drug development, establishing the validity of assessment tools is paramount for scientific progress and patient outcomes. Factorial validity represents a fundamental component of construct validation, providing empirical evidence that a measurement scale's internal structure aligns with its theoretical foundations. Within this framework, Confirmatory Factor Analysis (CFA) has emerged as a powerful statistical methodology for testing hypothesized measurement structures against empirical data [28]. Unlike exploratory approaches, CFA allows researchers to specify, a priori, the proposed relationships between observed variables and their underlying theoretical constructs, delivering robust evidence about whether an instrument genuinely measures what it purports to measure [29].
This guide objectively compares CFA against alternative methodological approaches for establishing factorial validity, examining their respective applications, performance characteristics, and suitability for validating cognitive measurement scales in pharmaceutical and clinical research settings. We present experimental data and protocols to inform methodological selection, recognizing that appropriate analytical choices strengthen scale validation and consequently enhance the reliability of cognitive assessment in clinical trials and therapeutic development.
Comparative Methodologies for Establishing Factorial Validity
Analytical Approaches: Confirmatory Factor Analysis, Exploratory Factor Analysis, and Rasch Analysis
Researchers employ several multivariate techniques to investigate the latent structure of assessment instruments. The table below provides a systematic comparison of the three primary methodologies used to establish factorial validity.
Table 1: Comparison of Methodologies for Establishing Factorial Validity
| Feature | Confirmatory Factor Analysis (CFA) | Exploratory Factor Analysis (EFA) | Rasch Analysis |
|---|---|---|---|
| Primary Objective | Test a pre-specified factor structure hypothesis [29] | Discover the underlying factor structure without strong prior hypotheses [28] | Evaluate item fit and person ability against a unidimensional measurement model [5] |
| Theoretical Foundation | Strong theoretical or empirical basis required before analysis | Minimal theoretical constraints; data-driven structure identification | Based on item response theory with specific mathematical models |
| Model Specification | Requires explicit specification of factor-item relationships and covariance structure [29] | No pre-specified factor-item relationships; all items can load on all factors | Assumes a probabilistic relationship between person ability and item difficulty |
| Key Outputs | Model fit indices (e.g., CFI, RMSEA, SRMR), factor loadings, modification indices [29] | Factor loadings, eigenvalues, variance explained, scree plot | Item fit statistics (infit/outfit), person reliability, item difficulty hierarchy [5] |
| Best Application Context | Late-stage scale validation and refinement where theoretical structure exists [30] | Early scale development to explore potential dimensionalities | Developing unidimensional scales with hierarchical properties, especially in cognitive assessment [5] |
Performance Comparison: Empirical Evidence from Validation Studies
Recent scale development initiatives across diverse domains provide experimental data on the performance of these methodological approaches. The following table synthesizes quantitative findings from published validation studies, highlighting how different analytical techniques contribute to establishing factorial validity.
Table 2: Experimental Data from Scale Validation Studies Employ Different Factorial Validation Methods
| Study/Instrument | Domain | Sample Size | Methodology | Key Quantitative Results | Reliability Metrics |
|---|---|---|---|---|---|
| Innovative Work Behavior Scale [30] | Organizational Psychology | 200 | CFA | Excellent model fit; All factor loadings statistically significant (p<0.05) | Composite Reliability (CR)=0.94; Average Variance Extracted (AVE)=0.85 |
| HKCAS-T Cognition Scale [5] | Child Development | 282 | Rasch Analysis | Supported unidimensionality; Item goodness-of-fit within acceptable range | Internal Consistency=0.98; Test-retest Reliability=0.98 |
| Assessment of Size and Scale Cognition [4] | Science Education | 518 | Iterative Validation (EFA then CFA) | Final model demonstrated adequate fit across multiple indices | High internal consistency reported across subscales |
| Upward State Social Comparison Scales [31] | Social Media Psychology | 462 | CFA | Good model fit; Significant factor loadings (p<0.001) for all retained items | Demonstrated good reliability, convergent, and discriminant validity |
| System Understandability Scale [32] | Human-Computer Interaction | 307 (Study 2) 347 (Study 3) | EFA (Study 2) then CFA (Study 3) | EFA: 4 factors extracted; CFA: Confirmed structure with good fit | Scale showed significant correlation with trust, usage intention, and satisfaction |
Experimental Protocols for Confirmatory Factor Analysis
Standardized CFA Workflow for Scale Validation
The diagram below illustrates the systematic protocol for implementing CFA in scale validation research, from preliminary preparation through final model interpretation.
Protocol Implementation and Key Considerations
Step 1: Theoretical Model Specification – Based on strong theoretical foundations or prior exploratory research, researchers explicitly define the hypothesized factor structure, specifying which items load on which latent constructs and whether factors are correlated or orthogonal [28]. This stage requires precise specification of the measurement model before empirical testing.
Step 2: Data Collection and Preparation – Adequate sample size is critical for CFA stability; a minimum of 200 participants is generally recommended, with larger samples needed for complex models [30] [5]. Data should be screened for multivariate normality, outliers, and missing values, as violations can distort parameter estimates and fit statistics.
Step 3: Model Identification – The researcher must ensure the model is statistically identified, meaning there is enough information to estimate all parameters. A common rule requires at least three indicators per factor, though more complex models may need additional constraints.
Step 4: Parameter Estimation – Maximum likelihood estimation is most common, but robust variants should be used with non-normal data. Estimation yields factor loadings, factor correlations, and error variances, which indicate how well each item measures its intended construct [30].
Step 5: Model Fit Assessment – Multiple fit indices should be examined: CFI (Comparative Fit Index) > 0.90 (preferably > 0.95), RMSEA (Root Mean Square Error of Approximation) < 0.08 (preferably < 0.06), and SRMR (Standardized Root Mean Square Residual) < 0.08 [29]. No single index should determine model adequacy.
Step 6: Model Modification – If fit is inadequate, modification indices may suggest theoretically justifiable improvements (e.g., allowing correlated errors between similar items). However, modifications must be theoretically defensible to avoid capitalizing on chance characteristics of the sample [29].
Step 7: Result Interpretation and Reporting – Finally, researchers interpret the validated factor structure, report all relevant parameter estimates and fit statistics, and discuss implications for measurement validity within their research context [28].
The Scientist's Toolkit: Essential Reagents for Factor Analysis
Table 3: Essential Research Reagents for Factor Analysis in Scale Validation
| Reagent / Tool | Function / Purpose | Implementation Considerations |
|---|---|---|
| Specialized Statistical Software | Provides computational algorithms for factor extraction, estimation, and model fitting | Choices include R (lavaan package), Mplus, SPSS AMOS, Stata, or SAS; selection depends on model complexity and researcher expertise |
| Gold Standard Comparison Instruments | Enables assessment of criterion validity by correlating new scale scores with established measures [28] | Must be validated in similar populations and contexts; provides benchmark for concurrent validity assessment |
| Sample Size Calculator | Determines minimum participants needed for adequate statistical power in factor analysis | Generally requires 5-20 participants per estimated parameter; complex models need larger samples [5] |
| Fit Indices Suite | Quantifies how well the hypothesized model reproduces the observed covariance matrix | Should include absolute (RMSEA, SRMR), comparative (CFI, TLI), and parsimony-adjusted indices for comprehensive assessment [29] |
| Modification Indices | Identifies specific model parameters that would improve fit if freed or added | Should be used cautiously with strong theoretical justification to avoid overfitting sample-specific variance [29] |
The establishment of factorial validity through Confirmatory Factor Analysis represents a rigorous approach to scale validation that is particularly well-suited to advanced stages of instrument development where theoretical foundations are strong. CFA provides powerful hypothesis-testing capabilities that exceed those available through exploratory methods, delivering robust evidence of a scale's internal structural validity [29].
However, the comparative analysis presented in this guide demonstrates that CFA, EFA, and Rasch analysis each occupy distinct methodological niches within the validation ecosystem. EFA remains invaluable during preliminary scale development when underlying structures are poorly understood, while Rasch analysis offers particular advantages for creating probabilistic measurement models with hierarchical properties [5].
For researchers validating cognitive terminology measurement scales in pharmaceutical and clinical contexts, where measurement precision directly impacts therapeutic decisions and regulatory evaluations, a sequential approach that strategically employs each method throughout the validation lifecycle often yields the most psychometrically sound and clinically useful assessment instruments.
In the validation of cognitive terminology measurement scales, reliability refers to the consistency and reproducibility of the scores obtained from an instrument. For researchers, clinicians, and drug development professionals, understanding and quantifying reliability is paramount, as it ensures that measurements are stable, precise, and free from random error, thereby providing a trustworthy foundation for scientific conclusions and clinical decisions. This guide objectively compares key reliability estimation methods—focusing on internal consistency and test-retest reliability—by presenting experimental data and protocols from contemporary validation studies. The framework for this comparison is grounded in established standards for educational and psychological testing, which emphasize that reliability is a property of test scores rather than the test itself and must be validated with each use in specific populations [25].
Reliability forms the bedrock of validity; a measure cannot validly assess a construct if it does not first do so consistently. In the context of cognitive measurement, this is particularly crucial when scales are used to track symptom progression in clinical trials or to evaluate the efficacy of pharmacological interventions. The methodologies examined here are applied across psychiatric, psychological, and behavioral sciences to ensure that scales measuring latent constructs such as arousal, cognitive functioning, or everyday hearing performance yield dependable quantitative data [25] [33].
Core Reliability Estimation Methods: Theory and Protocols
Internal Consistency Reliability
Internal consistency reliability assesses the extent to which items on a scale measure the same underlying construct. It is typically quantified using Cronbach's alpha (α), where values range from 0 to 1. Higher values indicate that the items are highly correlated and consistently measure the same latent variable. Best practices suggest that α ≥ 0.70 is acceptable for research purposes, though values above 0.80 are preferable for clinical applications [25] [34]. The protocol for establishing internal consistency involves administering the scale to a large, representative sample on a single occasion. Researchers then calculate inter-item correlations and the overall Cronbach's alpha coefficient. Modern approaches also use factor analysis (both exploratory and confirmatory) to examine the dimensional structure and ensure that the calculated internal consistency is not artificially inflated by redundant items or multidimensional structures [24] [25].
Test-Retest Reliability
Test-retest reliability evaluates the stability of a measurement instrument over time. It is calculated by administering the same scale to the same participants on two separate occasions and computing the correlation coefficient between the two sets of scores. A high correlation (typically r ≥ 0.70 for group-level comparisons) indicates that the scale produces stable results and is not overly susceptible to random fluctuations [33] [34]. The critical methodological consideration for test-retest reliability is the inter-test interval. This period must be short enough that the underlying construct has not likely changed, yet long enough to prevent recall bias. The specific interval varies by construct; for stable traits, intervals of several weeks are common. The statistical analysis involves calculating an intraclass correlation coefficient (ICC) for continuous data or a Cohen's kappa for categorical data, which provides a more robust measure of agreement than a simple Pearson correlation [33].
Experimental Data and Comparative Analysis
The following data, synthesized from recent peer-reviewed studies, provides a quantitative comparison of reliability coefficients for different measurement scales.
Table 1: Comparative Reliability Metrics from Recent Studies
| Instrument (Study) | Construct Measured | Internal Consistency (α) | Test-Retest Reliability (r) | Sample Size & Population |
|---|---|---|---|---|
| HFEQ-SWE [33] | Hearing & Everyday Functioning | Total Score: "Satisfactory" | Total Score: Showed "stability over time" | 628 adults (30-96 years) with hearing loss |
| Pre-Sleep Arousal Scale (PSAS) [34] | Pre-Sleep Arousal (Meta-Analysis) | Total: 0.88 (0.86–0.90)Cognitive: 0.89 (0.88–0.90)Somatic: 0.80 (0.77–0.83) | Total: 0.87 (0.84–0.90)Cognitive: 0.80 (0.77–0.84)Somatic: 0.70 (0.67–0.74) | 9,354 participants across 27 studies |
| Assessment of Size and Scale Cognition (ASSC) [4] | Size and Scale Cognition | Evidence obtained via pilot testing and expert review. | -- | 518 first-year undergraduate students |
Analysis of Comparative Data
The data in Table 1 reveals several key patterns. The Pre-Sleep Arousal Scale (PSAS) demonstrates robust psychometric properties, with high internal consistency and excellent test-retest reliability for its total and cognitive subscales across a large, multinational sample [34]. This level of consistency is critical for clinical trials where detecting changes in pre-sleep arousal is a target outcome. The HFEQ-SWE study highlights that while total scores can be highly reliable, researchers must examine reliability at the subscale and item level, as variations can occur. Their use of Confirmatory Factor Analysis (CFA) to confirm the scale's construct is a modern best practice that strengthens validity arguments [33] [25]. The development of the ASSC illustrates the comprehensive iterative process of establishing reliability, involving content experts, graphic design specialists, and the target population to refine items before quantitative pilot testing [4].
The Scale Validation Workflow
The following diagram maps the modern, iterative workflow for developing and validating a measurement scale, integrating key reliability tests within a broader psychometric evaluation.
Diagram 1: Phased Scale Development and Validation Workflow
This workflow, synthesized from best-practice guidelines [24] [25], shows that reliability testing (Phase 4) is a culmination of rigorous prior work. It is not a standalone activity but depends on careful construct definition, item development, and pilot testing.
The Researcher's Toolkit: Essential Reagents for Reliability Studies
Table 2: Key Research Reagents and Methodological Solutions
| Tool/Resource | Primary Function | Application in Reliability Studies |
|---|---|---|
| Statistical Software (R, Mplus, SPSS) | Data analysis and psychometric computation | Calculating Cronbach's α, ICC, conducting Exploratory/Confirmatory Factor Analysis (EFA/CFA). |
| Participant Recruitment Platform | Access to target population samples | Sourcing large, representative samples for survey administration and test-retest protocols. |
| Expert Review Panel | Content and face validity assessment | Ensuring items are relevant and clearly represent the target construct before reliability testing. |
| Digital Survey Administration Tools | Efficient and consistent data collection | Standardizing scale administration for large groups, often a requirement for large sample sizes. |
| Reporting Guidelines (e.g., PRISMA for meta-analysis) | Standardizing study protocol and reporting | Ensuring transparency and replicability, as seen in the PSAS meta-analysis [34]. |
Quantifying reliability through internal consistency and test-retest methods is a fundamental, non-negotiable component of validating cognitive measurement scales. The experimental data and protocols presented demonstrate that while established thresholds for reliability coefficients exist (e.g., α > 0.7), their achievement is the result of a meticulous, multi-phase development process. Modern estimation goes beyond single metrics, incorporating factor analysis and generalizability theory to provide a nuanced understanding of a scale's performance. For researchers and drug development professionals, selecting an instrument with robust, empirically demonstrated reliability is crucial for generating trustworthy data that can inform theory, clinical practice, and the development of effective interventions.
The rapid integration of digital health technologies has accelerated the shift from traditional in-person cognitive assessments toward remote and self-administered formats. This transition, while increasing accessibility, introduces critical questions about the psychometric equivalence of these digital adaptations. Validating cognitive terminology measurement scales for remote administration is not merely a technical exercise but a fundamental requirement for ensuring the reliability of data collected in research and clinical trials. Without rigorous validation, differences in scores obtained remotely could stem from administration method artifacts rather than true cognitive changes, potentially compromising diagnostic accuracy and treatment efficacy evaluation in pharmaceutical development.
This guide objectively compares the performance of remote and tablet-based cognitive assessments against their traditional in-person counterparts, synthesizing current experimental data to inform researchers and drug development professionals. The analysis focuses specifically on measurement validity, reliability metrics, and administration protocols across multiple cognitive domains and patient populations.
Comparative Performance Data: Remote Versus In-Person Administration
Quantitative Comparison of Assessment Modalities
Table 1: Performance Differences Between Remote and In-Person Cognitive Assessment
| Assessment Tool / Domain | Population | Remote Administration Method | Key Performance Differences | Statistical Significance |
|---|---|---|---|---|
| ECASc (ALS Cognitive Screen) | People with ALS & Controls | Videoconferencing with document camera | Remote administration associated with better total scores [35] | Significant (p-value not specified) [35] |
| ALS-CBSc (ALS Cognitive Screen) | People with ALS & Controls | Videoconferencing with adapted response format | Remote administration associated with better total scores [35] | Significant (p-value not specified) [35] |
| Mini-ACE (Cognitive Screen) | People with ALS & Controls | Videoconferencing with adapted response format | No significant difference between administration modes [35] | Not Significant [35] |
| MCCB (Trail Making A) | Severe Mental Illness | Remote administration | Remote participants performed significantly worse [36] | Significant (p-value not specified) [36] |
| MCCB (HVLT-R Verbal Learning) | Severe Mental Illness | Remote administration | Remote participants performed significantly worse [36] | Significant (p-value not specified) [36] |
| MCCB (Animal Fluency) | Severe Mental Illness | Remote administration | No significant difference between administration formats [36] | Not Significant [36] |
| MCCB (Letter-Number Span) | Bipolar Disorder | Remote administration | Remote participants performed significantly better [36] | Significant (p-value not specified) [36] |
| Smartphone Memory Tasks | Adult General Population | Self-administered smartphone app | Small, subtest-specific differences; Picture Memory higher remotely, Face Memory lower remotely [37] | Significant (p<0.05) with small effect sizes (η²≤.014) [37] |
| BrainCheck Digital Battery | Cognitively Healthy Adults (52-76 years) | Self-administered on personal devices (iPad, iPhone, laptop) | No significant difference between self- vs. RC-administered testing [38] | Not Significant; ICC 0.59-0.83 [38] |
Domain-Specific Vulnerability to Administration Effects
The comparative data reveal that cognitive domains are not uniformly affected by remote administration. The pattern suggests that tasks requiring visual-motor coordination and processing speed (e.g., Trail Making Test) often show performance decrements in remote settings, potentially due to technological latency or interface differences [36]. Conversely, verbal fluency tasks (e.g., Animal Fluency) demonstrate robust equivalence across administration modalities, as they depend less on visual stimulus presentation or motor response precision [36].
Memory tasks present a more complex pattern. While some studies found reduced performance on verbal learning measures remotely [36], others noted enhanced performance on visual memory tasks, potentially due to environmental comforts or, concerningly, increased opportunity for external enhancement strategies in unproctored settings [37]. The differential vulnerability appears linked to task characteristics: memory tasks with extended encoding periods may be more susceptible to external aids, whereas working memory tasks with immediate, speeded responses show minimal administration effects [37].
Experimental Protocols for Validation Studies
Methodological Framework for Validation
The validation of remote cognitive assessments requires carefully controlled studies that directly compare administration modalities while maintaining scientific rigor.
Table 2: Key Methodological Approaches in Validation Studies
| Study Component | Traditional In-Person Protocol | Remote Administration Protocol | Validation Considerations |
|---|---|---|---|
| Participant Recruitment | Clinic-based, community centers [5] | Online advertisements, social media, telehealth platforms [35] | Selection bias, technological access, digital literacy |
| Test Environment | Controlled clinic/lab setting [5] | Home environment via videoconferencing or self-administered apps [37] [35] | Environmental distractions, technical variability, standardized setup |
| Stimulus Presentation | Physical test materials, paper-and-pencil [5] [35] | Screen sharing, document cameras, digital interfaces [37] [35] | Visual fidelity, display size, resolution, timing precision |
| Response Collection | Direct observation, written responses [5] | Video observation, chat functions, digital inputs [35] | Response latency measurement, motor response adaptation |
| Administration Oversight | In-person examiner [5] | Remote proctoring, self-administered with tech support [38] | Standardization of assistance, troubleshooting protocols |
| Reliability Assessment | Test-retest (4-week interval), inter-rater reliability [5] | Same-device test-retest, comparison to proctored session [38] | Practice effects, device consistency, technical stability |
Validation Workflow for Remote Cognitive Batteries
The following workflow diagram illustrates the comprehensive validation process for remote cognitive assessment tools:
Research Reagent Solutions for Digital Cognitive Assessment
Table 3: Essential Materials and Platforms for Remote Cognitive Assessment Research
| Tool Category | Specific Examples | Function in Research | Key Considerations |
|---|---|---|---|
| Videoconferencing Platforms | Zoom, Skype [35] | Enable real-time remote proctoring and stimulus presentation via screen sharing or document cameras | Security compliance, video/audio quality, participant accessibility |
| Digital Cognitive Batteries | BrainCheck [38], Mobile Toolbox (MTB) [37], MyCog Mobile (MCM) [37] | Provide standardized, self-administered cognitive tests across multiple domains | Device compatibility, automated scoring, practice effect minimization |
| Document Cameras/Visualizers | Thustand USB Document Camera [35] | Present physical test materials remotely when digital rights restrictions apply | Resolution quality, positioning stability, lighting requirements |
| Electronic Health Record Systems | EHR Integrations [38] | Facilitate clinical workflow integration and data transfer for pragmatic trials | Interoperability standards, data security, workflow compatibility |
| Psychometric Analysis Tools | Rasch analysis [5], CFA/EFA [39], ICC calculations [38] | Establish measurement properties, reliability, and validity of remote assessments | Sample size requirements, model assumptions, dimensionality testing |
| Device-Agnostic Platforms | Web-based assessment platforms [38] | Ensure consistent testing experience across different devices and operating systems | Responsive design, input method standardization, performance calibration |
Critical Considerations for Research Implementation
Methodological and Practical Implications
The validation evidence suggests that remote cognitive assessments cannot be assumed equivalent to their in-person counterparts without empirical verification. Researchers must consider several critical factors when implementing digital assessments:
Population-Specific Effects: Administration mode effects may vary across clinical populations. For instance, individuals with severe mental illness showed different patterns of performance compared to healthy controls on remotely administered MCCB tests [36]. Similarly, people with ALS demonstrated different mode effects across different screening tools [35].
Technological Standardization: The device type, screen size, and input method must be standardized or statistically controlled. Research indicates that assessments can be administered across smartphones, tablets, and laptops, but device characteristics may influence performance [37] [38].
Environmental Uncontrollability: Remote administration introduces variability in testing environments that researchers cannot control. This includes potential distractions, connectivity issues, and differences in physical setup that may influence performance [37].
Ethical and Security Considerations: Data privacy, informed consent procedures, and cybersecurity measures require special attention in remote assessments, particularly when collecting sensitive cognitive data from vulnerable populations [35] [38].
The growing evidence base supporting remote cognitive assessment reflects a paradigm shift in neuropsychological measurement. While not all traditional tests directly translate to digital formats, rigorous validation methodologies are establishing a new generation of cognitive assessment tools that balance psychometric rigor with practical accessibility. For pharmaceutical researchers and clinical trialists, these validated remote tools offer opportunities to expand trial participation, increase assessment frequency, and potentially reduce site-based assessment costs, while maintaining scientific validity in cognitive outcome measurement.
In an era of globalized research, scientists increasingly administer psychological, cognitive, and behavioral assessment scales across diverse cultural and linguistic groups. Measurement invariance testing provides the methodological foundation for ensuring that these instruments measure the same underlying constructs across different populations, thereby enabling valid cross-cultural comparisons [40]. Without establishing measurement invariance, researchers cannot determine whether observed score differences reflect true disparities in the construct of interest or merely measurement artifacts stemming from cultural differences in item interpretation [40] [41]. This guide provides a comprehensive framework for testing measurement invariance, with special consideration for validating cognitive terminology measurement scales in transnational research contexts, including pharmaceutical trials and cross-cultural clinical studies.
The fundamental premise of measurement invariance is that the relationship between observed item scores and the underlying latent construct should be equivalent across groups. When this psychometric equivalence is not established, comparisons become ambiguous and potentially misleading [40]. For instance, in cognitive assessment, an item intended to measure working memory might inadvertently tap into cultural knowledge in one group but not another, fundamentally altering what is being measured. The consequences of such measurement noninvariance can derail theoretical development, clinical decisions, and the validation of cross-cultural research findings [40] [25].
Theoretical Foundations: Understanding Measurement Invariance
The Conceptual Framework
Measurement invariance assesses whether a construct has the same psychological meaning and measurement properties across different groups or across time [40]. In cross-cultural research, this ensures that "the construct has a different structure or meaning to different groups" is false, enabling meaningful comparisons [40]. The process establishes that scores from different cultural groups have the same meaning, which is typically tested by verifying the equivalence of the measurement model across groups [42].
The testing of measurement invariance has evolved significantly over the past fifty years, with statistical techniques becoming more accessible to researchers around the turn of the 21st century [40]. Methodologists have since developed increasingly sophisticated approaches for testing invariance, particularly within the structural equation modeling framework [40]. Recent advancements include more flexible techniques such as alignment optimization and Bayesian estimation, which are particularly useful when analyzing data from many groups [41].
Levels of Measurement Invariance
Measurement invariance testing follows a hierarchical, stepwise approach that examines progressively stricter forms of invariance [40]. Each level imposes additional constraints on the measurement model, allowing researchers to pinpoint precisely where and how measures may function differently across groups.
Table: Levels of Measurement Invariance Testing
| Invariance Level | Parameters Constrained Equal | Interpretation When Established | Prerequisite For |
|---|---|---|---|
| Configural | Factor structure only | Same basic factor structure across groups | Further invariance testing |
| Metric (Weak) | Factor loadings | Same unit of measurement across groups | Comparing relationships with other variables |
| Scalar (Strong) | Item intercepts | Same origin point of scale across groups | Meaningful comparison of latent means |
| Strict (Residual) | Item residual variances | Equivalent measurement error across groups | Most rigorous form of comparability |
Step-by-Step Testing Protocol
Phase 1: Prerequisite Scale Development and Adaptation
Before testing measurement invariance, researchers must ensure that the assessment instrument has been properly developed and adapted for cross-cultural use. The process begins with construct definition—clearly articulating the domain being measured and providing a preliminary conceptual definition [24] [25]. In cross-cultural contexts, researchers must decide whether to adopt an etic approach (assuming construct universality) or an emic approach (tailoring to specific cultural contexts) [25].
For cognitive terminology measurement scales, this phase includes:
- Comprehensive literature review to understand the construct's theoretical foundations and identify potential gaps in existing measures [24] [25].
- Item generation using both deductive (theory-driven) and inductive (response-driven) methods to create a comprehensive item pool [24].
- Linguistic validation for cross-cultural applications, which involves systematic procedures such as forward translation, backward translation, expert committee review, and cognitive interviewing to ensure conceptual equivalence across languages [43].
Professional language validation services play a crucial role in this phase by eliminating cultural barriers, optimizing item clarity, adapting contexts to reflect real-life experiences, and calibrating response scales to ensure comparable interpretation across cultures [43]. These procedures help ensure that "a scale measures the same theoretical construct in different cultural groups" before formal invariance testing begins [25].
Phase 2: Configural Invariance Testing
Configural invariance represents the most fundamental level of measurement invariance, testing whether the same basic factor structure holds across groups [40]. This form of invariance requires that the same items load on the same factors across all cultural groups, establishing that the construct has the same conceptual framework across populations.
Experimental Protocol:
- Specify a multi-group confirmatory factor analysis (MG-CFA) model where the same factor structure is specified for all groups, but no parameters are constrained to equality.
- Assess model fit using multiple indices: χ²/df ratio, Comparative Fit Index (CFI), Tucker-Lewis Index (TLI), and Root Mean Square Error of Approximation (RMSEA).
- Evaluate whether the model demonstrates acceptable fit to the data in all groups simultaneously.
Configural invariance is supported when the same pattern of fixed and free factor loadings provides acceptable fit across groups, indicating that the same factors are being measured in each culture [40]. In a cross-cultural study of the Personality Inventory for DSM-5 (PID-5) across five European samples, researchers established configural invariance, demonstrating that the same facets composed each personality domain across different cultural and linguistic groups [42].
Phase 3: Metric Invariance Testing
Metric invariance (also known as weak factorial invariance) tests whether the factor loadings are equivalent across groups. This level of invariance ensures that a unit change in the observed variable corresponds to the same amount of change in the latent construct across cultures, allowing comparisons of relationships between constructs (such as correlation and regression coefficients) [40].
Experimental Protocol:
- Constrain all factor loadings to be equal across groups while allowing intercepts and residuals to vary.
- Compare this constrained model to the configural model from the previous step.
- Assess differences in model fit using ΔCFI (where changes < -0.01 indicate noninvariance) and ΔRMSEA (where changes < 0.015 indicate noninvariance) [40].
When metric invariance is supported, researchers can conclude that participants from different cultures attribute the same meaning to the latent construct and that the scale functions as a uniform measure across groups [42] [40]. In the PID-5 study, metric invariance was established, indicating that the relationships between personality facets and their underlying domains were equivalent across the five European samples [42].
Phase 4: Scalar Invariance Testing
Scalar invariance (strong factorial invariance) represents a more stringent level of equivalence that tests whether item intercepts are equal across groups. This level of invariance is necessary for meaningful comparisons of latent means across cultures because it ensures that individuals with the same level of the underlying trait would obtain the same observed score on the measure, regardless of cultural background [42] [40].
Experimental Protocol:
- Constrain both factor loadings and item intercepts to be equal across groups.
- Compare this model to the metric invariance model from the previous step.
- Evaluate deterioration in model fit using the same difference indices as in previous steps.
When full scalar invariance is not achieved, researchers may test for partial scalar invariance by identifying which specific items have non-invariant intercepts and freeing those constraints [42] [40]. Establishing partial scalar invariance with a majority of invariant items may still permit cautious comparisons of factor means. In the PID-5 study, researchers found support for partial scalar invariance, with minimal influence from non-invariant facets, thus allowing cross-cultural mean comparisons [42].
Phase 5: Strict Invariance Testing
The most rigorous form of invariance, strict invariance (or residual invariance), tests whether item residual variances are equivalent across groups. This level of invariance indicates that measures have equivalent reliability across cultures and that the amount of variance not explained by the latent factor is consistent across groups [40].
Experimental Protocol:
- Constrain factor loadings, intercepts, and residual variances to be equal across groups.
- Compare this fully constrained model to the scalar invariance model.
- Assess deterioration in model fit using established difference indices.
While strict invariance represents the ideal standard for measurement equivalence, it is not always necessary for all research purposes. For many applications, including comparisons of factor means, scalar invariance provides sufficient evidence of measurement equivalence [40].
Table: Decision Framework for Measurement Invariance Testing
| Scenario | Recommended Action | Statistical Consideration |
|---|---|---|
| Configural noninvariance | Reconsider cross-cultural comparison; may need different measures | Poor model fit indices across all groups |
| Metric noninvariance | Identify and remove noninvariant items; test for partial metric invariance | Significant ΔCFI and ΔRMSEA when constraining loadings |
| Scalar noninvariance | Test for partial scalar invariance; may still compare means if majority invariant | Some intercepts vary; can identify specific problematic items |
| Full scalar invariance | Can confidently compare latent means across groups | Non-significant deterioration in model fit at scalar level |
| Large number of groups | Consider alignment optimization or Bayesian methods | Classical MG-CFA may have convergence problems |
Visualization of the Measurement Invariance Testing Workflow
The following diagram illustrates the sequential process of testing measurement invariance, with decision points at each stage:
Measurement Invariance Testing Workflow
Essential Research Reagents and Tools
Successful measurement invariance testing requires both methodological expertise and appropriate statistical tools. The following table details key "research reagents"—essential analytical tools and procedures for conducting rigorous invariance analyses.
Table: Essential Research Reagents for Measurement Invariance Testing
| Tool Category | Specific Solutions | Primary Function in Invariance Testing |
|---|---|---|
| Statistical Software | Mplus, R (lavaan), AMOS, LISREL | Perform multi-group confirmatory factor analysis and model comparisons |
| Fit Indices | CFI, TLI, RMSEA, SRMR | Evaluate absolute and relative model fit at each invariance level |
| Difference Tests | ΔCFI, ΔRMSEA, χ² difference test | Assess deterioration in model fit when constraints are added |
| Data Collection Platforms | Qualtrics, REDCap, Online survey tools | Administer standardized assessments across diverse cultural groups |
| Linguistic Validation Services | Professional translation with cognitive interviewing | Ensure conceptual equivalence across language versions |
| Modern Methods | Alignment optimization, Bayesian estimation | Test invariance with many groups when traditional MG-CFA fails |
Applications in Cognitive Terminology Measurement Research
The application of measurement invariance testing is particularly crucial in cognitive assessment research, where precise measurement of constructs such as attention, memory, executive function, and processing speed is essential for valid cross-cultural comparisons. In pharmaceutical research, establishing measurement invariance ensures that cognitive outcome measures are equally sensitive to treatment effects across diverse populations, a critical consideration in global clinical trials [44] [45].
For instance, when validating a cognitive load scale in a problem-based learning environment, researchers demonstrated measurement invariance before comparing scores across different educational contexts [44]. Similarly, in studies of cognitive schemas using the Psychological Distance Scaling Task, establishing measurement invariance across racial groups was essential for ensuring the validity of comparisons between African American and Caucasian participants [45]. These applications highlight how rigorous invariance testing protects against erroneous conclusions in cognitive assessment research.
Measurement invariance testing provides an essential methodological foundation for valid cross-cultural comparisons in cognitive terminology research. By following the systematic, stepwise protocol outlined in this guide—from establishing configural through scalar invariance—researchers can ensure that their assessment instruments measure the same constructs in the same way across diverse cultural and linguistic groups. As research becomes increasingly globalized, particularly in pharmaceutical development and clinical trials, these methods will continue to grow in importance for producing comparable, meaningful scientific findings across human populations.
Overcoming Common Hurdles: Strategies to Enhance Scale Reliability and Validity
A fundamental challenge in cognitive science, known as the reliability paradox, undermines the study of individual differences: tasks that produce robust, easily replicable experimental effects at the group level often demonstrate poor test-retest reliability, rendering them unsuitable for correlational research [46] [47]. This paradox arises because experimental psychology traditionally aims to minimize between-subject variance to clearly demonstrate an effect's existence. In contrast, individual differences research requires substantial between-subject variance to reliably distinguish among participants [48] [46].
Formally, reliability ((r)) in classical test theory is defined as the ratio of true score variance ((\sigmaT^2)) to total observed variance, which includes measurement error ((\sigmaE^2)): (r = \sigmaT^2 / (\sigmaT^2 + \sigma_E^2)) [48]. This relationship means that reliability can be low either because true individual differences are minimal or because measurement error is excessive. Consequently, the observed correlation between any two measures is mathematically bounded by their individual reliabilities [48]. Poor reliability therefore severely hampers the ability to detect meaningful brain-behavior or behavior-symptom relationships, potentially leading to null findings even when underlying relationships exist [49].
Theoretical Framework: The Signal-to-Noise Ratio Perspective
The concept of Signal-to-Noise Ratio (SNR) provides a powerful framework for understanding and addressing the reliability paradox. Within this framework, the "signal" represents stable, trait-like individual differences in cognitive ability, while "noise" encompasses all sources of measurement error, including transient state fluctuations, situational factors, and intrinsic neural variability [50] [51].
Cognitive tasks can be conceptualized as communication channels where information about an individual's true ability must be transmitted through noisy processing systems. The fidelity of this information transmission can be quantified using metrics analogous to those in information theory. For instance, in the Psychomotor Vigilance Test (PVT), sleep deprivation effects have been effectively characterized by a decline in the fidelity of information processing, expressed as a log-transformed SNR (LSNR) in decibels (dB) [50].
The following diagram illustrates how cognitive tasks transform true ability into measured performance through noisy channels, and how various techniques can optimize this process:
Experimental Evidence: Quantifying the Problem and Testing Solutions
The Magnitude of the Reliability Problem
Empirical studies across multiple laboratories have demonstrated alarmingly low reliability for many classic cognitive tasks. Hedge and colleagues (2018) assessed the test-retest reliability of seven commonly used tasks - including the Eriksen Flanker, Stroop, and stop-signal tasks - and found reliabilities ranging from 0 to .82, with most falling below conventional acceptability thresholds [46]. A meta-analysis by Enkavi et al. (2019) found the median reliability of 36 self-regulation tasks was only 0.61, with newly collected data showing even poorer reliability (ICC = 0.31) [49].
The consequences of this poor reliability are profound. Research has demonstrated that every 0.2 drop in reliability reduces the predictable variance (R²) in brain-behavior predictions by approximately 25% [49]. When reliability falls to 0.5 - a value not uncommon for behavioral assessments - prediction accuracy can become so unstable that different conclusions might be drawn from the same underlying data [49].
Reliability Improvements Through Task Calibration
Recent research has systematically addressed the reliability paradox by deliberately redesigning cognitive tasks to enhance between-subject variability while controlling measurement error. Tsang and colleagues (2023) implemented carefully calibrated versions of standard decision-conflict tasks with specific manipulations to encourage processing of conflicting information [51].
Table 1: Reliability Comparisons Between Standard and Calibrated Cognitive Tasks
| Task Type | Standard Version Reliability | Calibrated Version Reliability | Key Modifications | Required Trials for r ≥ 0.8 |
|---|---|---|---|---|
| Flanker | 0.59 (with 40 trials) [51] | 0.8+ | Stimulus jittering; double-shot responses; gamification | <100 trials [51] |
| Simon | Low (η = 0.13) [51] | Improved | Far lateral positioning; double-shot responses; engaging narrative | <100 trials [51] |
| Stroop | Low (η = 0.13) [51] | Improved | Large, legible characters; double-shot responses; video game format | <100 trials [51] |
| Statistical Learning | 0.75 [48] | 0.88 [48] | Wider difficulty range; reduced floor effects | Not specified |
The "double-shot" methodology proved particularly effective. In this approach, participants must occasionally provide two responses: first based on the relevant stimulus attribute (as in standard tasks), and then based on the irrelevant attribute. This prevents strategies like attentional narrowing that reduce between-subject variance and ensures participants fully process both information streams [51].
Methodological Solutions: A Research Toolkit
Increasing Between-Subject Variance
Eliminating Ceiling and Floor Effects: Range restriction severely compromises reliability by limiting between-subject variability. Siegelman and colleagues addressed this in statistical learning tasks by designing stimuli that varied more widely in difficulty, reducing the proportion of participants at chance level from a majority to a minority. This simple modification improved reliability from ρ = 0.75 to 0.88 [48].
Strategic Trial Selection: Oswald et al. demonstrated that removing the easiest trials - those with ceiling-level performance - from working memory tasks had virtually no negative impact on reliability while improving measurement efficiency [48].
Adaptive Difficulty: Implementing staircasing procedures or item response theory-based adaptive testing ensures that task difficulty matches individual ability levels, maintaining optimal discrimination across the ability spectrum [48] [52].
Reducing Measurement Error
Increasing Trial Count: Reliability generally improves with additional trials, but the rate of this improvement varies substantially across tasks. Research shows that collecting sufficient trials is essential for achieving acceptable reliability, with some tasks requiring hundreds of trials to reach conventional reliability thresholds [52] [51].
Multi-Session Testing: For many cognitive measures, data must be combined across multiple sessions to achieve trait-like stability. Different cognitive domains are differentially affected by state fluctuations, making some abilities particularly dependent on multi-session assessment for reliable measurement [52].
Improved Scoring Methods: Traditional difference scores (e.g., incongruent minus congruent reaction times) compound measurement noise. Alternative approaches include:
- Model-based parameters: Evidence accumulation models (e.g., drift rate) can provide more reliable indices than difference scores [48] [50]
- Signal-to-noise ratio metrics: Expressing performance as SNR provides a theoretically grounded approach with superior psychometric properties [50]
- Composite scores: Combining multiple task indicators can improve reliability through aggregation [51]
Table 2: Reliability Optimization Strategies Across the Research Workflow
| Research Phase | Challenge | Solution | Empirical Support |
|---|---|---|---|
| Task Design | Range restriction | Implement wider difficulty ranges; use adaptive testing | Siegelman et al.: Reliability improved from 0.75 to 0.88 [48] |
| Procedure | Insufficient data | Increase trial count; use multiple sessions | Total trials needed can reach 420 for r=0.8 when η=0.13 [51] |
| Data Collection | State variability | Standardize conditions; control attention | Double-shot methods prevent strategic avoidance of conflict [51] |
| Analysis | Noisy difference scores | Use model-based parameters; SNR metrics | LSNR shows better properties than lapse counts in PVT [50] |
| Validation | Unknown reliability | Calculate ICC; use convergence coefficient | Rouder et al. hierarchical models estimate σT/σN directly [51] |
Table 3: Key Research Reagents for Reliability-Optimized Cognitive Testing
| Reagent / Resource | Function | Application Notes |
|---|---|---|
| Calibrated Flanker Task | Measures attentional control | Implements stimulus jittering and double-shot responses; achieves reliability >0.8 in <100 trials [51] |
| Combined Simon-Stroop Task | Assesses multiple conflict types | Gamified format increases engagement; lateral positioning enhances salience [51] |
| Reliability Convergence Calculator | Estimates trials needed for target reliability | Online tool available at: https://jankawis.github.io/reliability-web-app/ [52] |
| Hierarchical Bayesian Models | Estimates trait and noise variance | Directly quantifies σT and σN; implemented in Rouder et al. approach [51] |
| Alternate Task Forms | Controls practice effects | Multiple stimulus sets enable multi-session testing without repetition effects [52] |
| SNR-based PVT Analysis | Quantifies vigilance | LSNR metric provides theoretically grounded performance index [50] |
Solving the reliability paradox requires a fundamental shift in how cognitive tasks are designed, administered, and scored. The traditional approach of adopting tasks from experimental psychology without modification for individual differences research is fundamentally flawed. Instead, researchers must deliberately engineer tasks to maximize between-subject variance while minimizing measurement noise.
The techniques reviewed here - including careful task calibration, optimized trial counts, multi-session assessment, and improved scoring methods - provide a roadmap for developing cognitive measures with sufficient reliability for individual differences research. By applying these methods systematically, researchers can overcome the reliability paradox and build a more robust foundation for understanding the neural and genetic underpinnings of cognitive individual differences.
The emerging toolkit for reliability optimization, including calibrated tasks, computational models, and analytical resources, promises to accelerate progress in precision psychiatry and cognitive neuroscience. As these methods become more widely adopted, the field can expect more reproducible brain-behavior relationships and more successful clinical translations.
Cognitive Load Theory (CLT) provides an essential framework for understanding the limitations of working memory during learning and complex task performance. Its core principle is that effective instruction and assessment must respect the finite capacity of human cognitive resources [53]. The accurate measurement of cognitive load is therefore not merely a methodological concern but a foundational aspect of validating research across educational, clinical, and professional domains. However, the field faces a significant challenge: many cognitive load assessment tools were developed for specific, often homogeneous populations, raising questions about their validity when applied to diverse groups with varying prior knowledge, cultural backgrounds, and linguistic capabilities [54]. This guide provides a systematic comparison of contemporary cognitive load assessment tools, evaluating their performance, methodological rigor, and applicability for diverse populations, framed within the broader thesis of validating cognitive terminology measurement scales.
The pursuit of measurement validity must confront the inherent complexity of the cognitive load construct. As identified in recent research, cognitive load is at least a two-dimensional concept comprising perceived task difficulty (mental load) and invested mental effort [53]. Furthermore, the theory traditionally distinguishes between three types of load: intrinsic cognitive load (ICL), determined by the inherent complexity of the material; extraneous cognitive load (ECL), imposed by suboptimal instructional design; and germane cognitive load (GCL), devoted to schema construction [55]. Some contemporary interpretations suggest a two-factor model integrating GCL with ICL, but the need for differentiated measurement remains [55]. Understanding these distinctions is crucial for designing assessments that are not only psychometrically sound but also theoretically grounded.
Comparative Analysis of Cognitive Load Assessment Tools
The following analysis synthesizes findings from recent studies to evaluate the most prominent cognitive load assessment methodologies. Researchers must consider multiple factors when selecting an appropriate tool, including context sensitivity, psychometric properties, and practicality for diverse populations.
Table 1: Comparison of Cognitive Load Subjective Rating Scales
| Assessment Tool | Scale Type & Items | Cognitive Load Dimensions Measured | Key Strengths | Documented Limitations | Contexts of Use |
|---|---|---|---|---|---|
| Paas Mental Effort Scale [53] | Single-item, 9-point | Overall cognitive load (via mental effort) | Easy to implement, low time exposure, suitable for repeated measures | Unidimensional; cannot differentiate load types; may be influenced by task position and motivation | Multimedia learning, problem-solving tasks |
| Leppink Cognitive Load Scale (CLS) [55] | 10-item questionnaire | ICL, ECL, GCL | Differentiates between load types; validated in multiple learning contexts | Factor structure and reliability can be context-dependent; may require adaptation | STEM education, online learning |
| Naïve Rating Scale (NRS) [55] | 8-item questionnaire | ICL, ECL, GCL | Taps into "naïve" perception of load; good theoretical foundation | Subscales, particularly ECL, can show low reliability in new contexts | Laboratory courses, complex learning environments |
| NASA-TLX [56] | 6-domain weighted scale | Mental, Physical, and Temporal Demand, Performance, Effort, Frustration | Multidimensional; captures broader workload concept; high CMTA-R score for complex tasks | Longer administration time; requires weighting procedure | Medical procedures (e.g., REBOA), high-stakes simulation |
| Cognitive Load Scale for AI-Assisted L2 Writing (CL-AI-L2W) [57] | 18-item, 4-factor scale | Prompt Management, Critical Evaluation, Integrative Synthesis, Authorial Core Processing | Domain-specific; validates novel cognitive processes in human-AI interaction | Newly developed; requires further validation in broader populations | AI-assisted language learning, collaborative writing |
Performance Data and Contextual Effectiveness
Quantitative data on the performance of these scales reveals critical insights for selection. A 2025 study investigating the construct validity of single-item scales found that ratings of perceived task difficulty and invested mental effort "do not measure the same but different aspects of overall cognitive load" [53]. This finding cautions against using these items interchangeably. In direct comparison studies, such as one conducted in technology-enhanced STEM laboratories, the intended three-factorial structure of established scales like the CLS and NRS was not always confirmed, with most a priori-defined subscales showing "insufficient internal consistency" [55]. This underscores the necessity for context-specific validation rather than assuming instrument reliability across domains.
The evolution of cognitive load scales shows a clear trend toward domain specificity. The recently developed CL-AI-L2W scale, for instance, demonstrates excellent model fit (CFI = .96, TLI = .95, RMSEA = .05, SRMR = .04) and internal consistency (ω = .92 for total scale) by focusing on the unique cognitive demands of human-AI collaborative writing, such as prompt engineering and output evaluation [57]. This suggests that for novel, complex tasks, generic scales may lack the sensitivity of tailored instruments.
Table 2: Objective and Efficiency Measures of Cognitive Load
| Method Category | Specific Tool/Measure | Description | Advantages | Disadvantages |
|---|---|---|---|---|
| Physiological Measures | Heart Rate Variability (HRV) [56] | Measures autonomic nervous system activity via ECG | Real-time, continuous data; non-intrusive; objective | Requires specialized equipment; sensitive to confounding factors (e.g., physical exertion) |
| Neurophysiological Measures | Electroencephalogram (EEG) [58] | Records electrical brain activity via scalp electrodes | High temporal resolution; direct measure of brain activity | Expensive equipment; complex data analysis; intrusive in natural settings |
| Cognitive Efficiency Models | Deviation Model [59] | Standardized performance minus standardized effort | Accounts for performance-outcome relationship | Yields scores uncorrelated with likelihood model, suggesting different efficiency constructs |
| Likelihood Model [59] | Ratio of performance to a cost factor (e.g., time, effort) | Intuitive interpretation as "output per unit input" | Regression shows unique variance from self-efficacy and knowledge depends on model used |
Experimental Protocols for Cognitive Load Assessment Validation
Protocol 1: Validating Subjective Rating Scales in Diverse Contexts
Objective: To establish the construct validity and reliability of subjective rating scales (e.g., Leppink's CLS or Klepsch's NRS) when adapted to a specific learning context, such as a STEM laboratory course [55].
Methodology:
- Participant Recruitment and Group Allocation: Recruit a participant cohort representative of the target population diversity in terms of prior knowledge, cultural background, and linguistic proficiency. Randomly assign participants to experimental conditions designed to manipulate specific load types (e.g., high vs. low ECL through spatial contiguity of instructional materials) [55].
- Task Administration: Participants engage in a series of structured, complex tasks (e.g., conducting experiments on electric circuits to explore fundamental physical relationships). This ensures a sufficiently high intrinsic cognitive load to allow for differentiation.
- Cognitive Load Measurement: Immediately after task completion, participants complete the adapted subjective rating scales. Using two scales (e.g., CLS and NRS) allows for a multitrait-multimethod analysis.
- Data Analysis:
- Factor Structure: Conduct Confirmatory Factor Analysis (CFA) to test the hypothesized factor structure (e.g., the three-factor model of ICL, ECL, GCL).
- Internal Consistency: Calculate reliability coefficients (e.g., Cronbach's α or McDonald's ω) for each subscale.
- Discriminant Validity: Use ANOVA to check if the ECL subscale scores are significantly different between the high and low ECL experimental conditions, which would provide evidence for discriminant validity [55].
Protocol 2: Establishing Criterion Validity with Physiological Measures
Objective: To validate subjective self-report measures against objective physiological indices of cognitive load, such as EEG, in a controlled task environment.
Methodology:
- Task Design with Load Manipulation: Implement tasks with predefined cognitive load levels. A proven design involves using the Stroop color-word test and arithmetic problem-solving tasks of varying difficulty (e.g., normal, low, mid, high) to systematically induce mental stress and cognitive load [58].
- Multimodal Data Collection: Synchronize data collection from:
- Physiological Sensors: Use an 8-channel EEG device (e.g., OpenBCI Cyton board) with a sampling rate of 250 Hz to capture frontal lobe activity in response to cognitive challenges [58].
- Subjective Measures: Administer a subjective rating scale (e.g., NASA-TLX) immediately after each task condition.
- Performance Data: Record accuracy and response time for each task.
- Data Analysis:
- EEG Feature Extraction: Process EEG signals to extract features known to correlate with cognitive load (e.g., power spectral densities in theta and alpha bands).
- Correlational Analysis: Calculate correlation coefficients between the subjective scale scores, performance metrics, and the extracted EEG features. Strong correlations would provide convergent evidence for the validity of the subjective measures.
Logical Workflow for Tool Selection and Validation
The following diagram illustrates a systematic decision-making process for selecting and validating cognitive load assessment tools based on research goals and population characteristics.
The Scientist's Toolkit: Essential Reagents and Materials
This section details key materials and methodological solutions required for conducting rigorous cognitive load assessment research, particularly with diverse populations.
Table 3: Research Reagent Solutions for Cognitive Load Assessment
| Category | Item/Reagent | Specification/Function | Application Notes |
|---|---|---|---|
| Validated Scale Templates | Leppink Cognitive Load Scale (CLS) | 10-item questionnaire measuring ICL, ECL, GCL | Must be linguistically and culturally adapted; factor structure requires confirmation in new contexts [55]. |
| Naïve Rating Scale (NRS) | 8-item questionnaire measuring ICL, ECL, GCL | Taps into immediate, intuitive perceptions of load; requires reliability checks for each subscale [55]. | |
| NASA-TLX | 6-domain weighted workload assessment | Ideal for complex, real-world tasks; high practicality score (CMTA-R=17) for medical procedures [56]. | |
| Physiological Recording Equipment | EEG System (e.g., OpenBCI Cyton) | 8-channel board, 250 Hz sampling rate | Captures frontal lobe activity during cognitive tasks; used for objective validation of subjective scales [58]. |
| ECG Monitor | For Heart Rate Variability (HRV) | Most common objective measure (used in 14 studies [56]); provides real-time, continuous data on mental strain. | |
| Cognitive Tasks for Load Induction | Stroop Color-Word Test | Induces cognitive conflict and mental stress | Standardized protocol for creating controlled cognitive load levels (normal, low, mid, high) [58]. |
| Arithmetic Problem-Solving | Tasks of varying complexity | Manipulates intrinsic cognitive load; effective for testing cognitive efficiency models [59]. | |
| Data Analysis Tools | Statistical Software (R, Mplus) | For CFA, EFA, and reliability analysis | Essential for establishing the internal structure and validity of rating scales in new populations [55] [57]. |
The comparative analysis presented in this guide underscores a critical conclusion: there is no universal tool for cognitive load assessment. The validity of any measurement is inextricably linked to the context of its use and the characteristics of the population being studied. Single-item scales offer practicality but limited diagnostic power [53], while multidimensional scales provide richer data but require rigorous, context-specific validation [55]. The emergence of domain-specific scales, such as the CL-AI-L2W for AI-assisted writing, points toward the future of the field—one that embraces theoretical nuance and methodological pluralism [57].
Future research must prioritize the development and validation of assessment tools that are not only psychometrically sound but also equitable. This involves consciously designing studies that include participants from diverse linguistic, educational, and cultural backgrounds to test and refine these instruments [54]. Furthermore, the integration of subjective ratings with objective physiological measures and performance data within a cognitive efficiency framework represents the most promising path toward a comprehensive and validated understanding of cognitive load [59]. By adopting this multifaceted approach, researchers and drug development professionals can generate more reliable, generalizable, and actionable evidence on how to manage cognitive load effectively across the full spectrum of human diversity.
Measurement invariance is a critical psychometric property ensuring that assessment instruments measure the same underlying constructs across different cultural, educational, and demographic groups. Its absence fundamentally compromises the validity of cross-group comparisons in research and clinical practice. This guide compares established and emerging methodologies for testing and achieving measurement invariance, providing researchers with practical protocols and data-driven insights to address cultural and educational bias in cognitive terminology measurement scales. Within the context of scale validation research, we objectively evaluate multiple statistical approaches, supported by empirical evidence from contemporary studies, to equip drug development professionals with robust frameworks for ensuring equitable measurement in diverse populations.
Measurement invariance (MI) represents a fundamental property of a measurement instrument, confirming that it measures the same conceptual construct in the same manner across various subgroups [60]. In practical terms, it ensures that a psychometric scale functions equivalently for different populations—such as across cultural, educational, gender, or ethnic groups—so that observed score differences reflect genuine variations in the underlying trait rather than systematic measurement bias [61].
The establishment of measurement invariance is particularly crucial in the validation of cognitive terminology measurement scales for several reasons. First, it prevents culturally biased inferences that could derail theory development and clinical decisions [61]. Second, it enables meaningful cross-group comparisons in international research and clinical trials, which are essential in global drug development [60]. Finally, it aligns with principles of scientific rigor and social justice by ensuring that measurement tools do not systematically disadvantage specific populations [61].
The consequences of ignoring measurement invariance are well-documented. Observed group differences may be biased if the psychometric properties of instruments are not equivalent across compared groups [61]. Simulation studies demonstrate that unequal instrument functioning can severely compromise the validity of between-group inferences, potentially leading to flawed conclusions about treatment efficacy or disease prevalence across populations [61].
Foundational Concepts and Theoretical Framework
The Cultural Equivalence Paradigm
The concept of cultural equivalence extends beyond simple translation of assessment items to encompass psychometric equivalence across cultural groups [61]. This requires establishing that the internal structure, relationship to external variables, and measurement precision of an instrument remain consistent across populations. Two primary approaches guide this process:
- Etic Approach: Assumes the construct exists similarly across cultures and requires items to be generalizable across contexts [25]
- Emic Approach: Tailors items to specific cultural, social, or linguistic contexts, acknowledging potential cultural variations in construct manifestation [25]
The selection between these approaches depends on whether the construct is designed for universal applicability or is confined to a specific cultural context [25].
Hierarchical Levels of Measurement Invariance
Measurement invariance testing typically follows a hierarchical sequence of increasingly restrictive statistical models, each testing a different level of equivalence:
Configural Invariance establishes that the same basic factor structure exists across groups, serving as the foundational level without which further invariance testing is meaningless [61] [60]. Metric Invariance ensures that factor loadings are equivalent across groups, allowing comparison of relationships between constructs [61]. Scalar Invariance requires equivalent item intercepts, enabling valid comparison of latent means across groups [60]. Strict Invariance adds the requirement of equivalent residual variances, representing the most stringent form of measurement equivalence [61].
Methodological Comparison: Approaches for Testing Measurement Invariance
Established versus Emerging Statistical Methods
Researchers have two primary methodological approaches for testing measurement invariance, each with distinct advantages and limitations:
Table 1: Comparison of Measurement Invariance Testing Methods
| Method Feature | Multiple-Group Confirmatory Factor Analysis (MGCFA) | Alignment Optimization |
|---|---|---|
| Statistical Basis | Traditional structured equation modeling | Pattern-based optimization |
| Invariance Testing | Sequential model comparisons (configural → metric → scalar) | Simultaneous parameter estimation |
| Primary Output | Goodness-of-fit indices (CFI, RMSEA, SRMR) | Average intercept and loading non-invariance |
| Group Size Handling | Requires large sample sizes per group | Accommodates smaller group sizes |
| Practical Utility | Well-established, widely recognized | More flexible with partial invariance |
| Recent Application | TALIS 2018 international teacher survey [60] | Cross-national educational research [60] |
Differential Item Functioning (DIF) Analysis
Differential Item Functioning analysis provides a complementary approach to traditional MI testing by examining whether specific items function differently across groups after controlling for the overall level of the underlying trait [62]. This method is particularly valuable for identifying problematic items in established scales.
A recent study of the Positive and Negative Affect Schedule (PANAS) in Ecuadorian young adults demonstrated the utility of DIF analysis, revealing item-level differences across gender groups, particularly for fear- and hostility-related emotions [62]. The study achieved only partial metric and scalar invariance, highlighting how specific items may exhibit gender-based variability in interpretation despite the overall scale maintaining adequate psychometric properties [62].
Experimental Protocols for Measurement Invariance Testing
Standardized Protocol for MGCFA
The following step-by-step protocol represents the conventional approach for establishing measurement invariance using Multiple-Group Confirmatory Factor Analysis:
Step 1: Establish Configural Invariance
- Specify the same factor structure across all groups
- Allow all parameters to be freely estimated
- Assess model fit using standard indices (CFI > 0.90, RMSEA < 0.08, SRMR < 0.08)
- This model serves as the baseline for subsequent comparisons [61] [60]
Step 2: Test for Metric Invariance
- Constrain factor loadings to be equal across groups
- Compare this constrained model to the configural model
- Use χ² difference test or change in CFI (ΔCFI < -0.01) to evaluate significant worsening of fit
- Non-significant difference supports metric invariance [60]
Step 3: Test for Scalar Invariance
- Constrain both factor loadings and item intercepts to be equal across groups
- Compare this model to the metric invariance model
- Use the same difference testing approach
- This level is required for meaningful latent mean comparisons [60]
Step 4: Address Partial Invariance (if needed)
- If full invariance is not achieved, identify specific non-invariant parameters
- Free these parameters while maintaining others constrained
- Partial invariance (with most parameters invariant) may support limited comparisons [60]
Protocol for Alignment Optimization Method
The alignment optimization method offers a viable alternative when MGCFA indicates non-invariance:
Step 1: Establish Configural Invariance (same as MGCFA protocol)
Step 2: Implement Alignment Optimization
- Estimate a model with approximate measurement invariance
- Use a simplicity function to minimize the extent of non-invariance
- The method groups non-invariant parameters toward one group or another
- Results indicate which parameters show substantial non-invariance [60]
Step 3: Interpret Alignment Results
- Examine the amount of non-invariance for each parameter
- Parameters with negligible non-invariance can be treated as approximately invariant
- This approach allows for meaningful comparisons even with partial invariance [60]
A recent application in the TALIS 2018 survey demonstrated that while full scalar invariance was not achieved using MGCFA, the alignment optimization method revealed partial comparability of instructional quality measures across 47 countries, enabling limited cross-national comparisons [60].
Essential Research Reagents and Methodological Tools
Table 2: Essential Methodological Tools for Measurement Invariance Research
| Tool Category | Specific Examples | Function in MI Research |
|---|---|---|
| Statistical Software | Mplus, R (lavaan package), AMOS, SAS | Implement MGCFA and alignment optimization analyses |
| Fit Indices | CFI, RMSEA, SRMR, χ² difference test | Evaluate model fit and compare nested models |
| Modern Psychometric Methods | Item Response Theory (IRT), Differential Item Functioning (DIF) | Complement traditional factor analytic approaches |
| Cultural Adaptation Frameworks | Translation-back-translation, cognitive interviewing | Ensure linguistic and conceptual equivalence |
| Sample Design Protocols | Stratified sampling, power analysis | Ensure adequate representation and statistical power |
Data Presentation: Quantitative Evidence from Recent Studies
Empirical Evidence of Measurement Non-Invariance
Recent studies across diverse fields provide compelling evidence of measurement non-invariance and its practical implications:
Table 3: Empirical Evidence of Measurement Non-Invariance Across Cultural Groups
| Study Context | Instrument | Population | Key Finding | Implication |
|---|---|---|---|---|
| PANAS Validation [62] | Positive and Negative Affect Schedule | Ecuadorian young adults (N=918) | Item "Alert" exhibited poor loading due to contextual reinterpretation; partial gender invariance | Cultural reinterpretation affects specific items even in well-established scales |
| Instructional Quality [60] | TALIS 2018 Teacher Survey | 47 countries (N=127,607 teachers) | Full scalar invariance not achieved with MGCFA; partial invariance with alignment optimization | Cross-national comparisons require method flexibility and caution in interpretation |
| Cognitive Schemas [45] | Psychological Distance Scaling Task (PDST) | African American and Caucasian patients (N=466) | Modified version demonstrated similar validity across racial groups | Targeted modifications can achieve measurement equivalence in diverse populations |
| Substance Use Research [61] | Various substance use measures | Ethnic/racial minority groups | Systematic review found most studies omit MI testing | Field-specific practices may neglect essential psychometric validation |
Strategic Implementation in Cognitive Terminology Research
Proactive Scale Development Strategies
Addressing measurement invariance should begin during the initial scale development process rather than as an afterthought. The item development phase presents critical opportunities to minimize future invariance issues:
- Combine Deductive and Inductive Methods: Use both theoretical literature review (deductive) and qualitative input from target populations (inductive) to ensure items reflect the construct across diverse groups [24]
- Generate Comprehensive Item Pool: Create an initial item pool at least twice as long as the desired final scale to allow elimination of biased items during validation [24]
- Ensure Cultural Relevance: Conduct cognitive interviews with representatives from all target populations to identify items with divergent interpretations [24]
- Anticipate Response Styles: Consider how different cultural groups might systematically vary in their use of response scales (e.g., extreme responding, acquiescence bias) [24]
Cross-Cultural Validation Framework
For researchers validating cognitive terminology scales across cultural contexts, we recommend a systematic framework:
This framework emphasizes sequential validation of conceptual equivalence (same construct across cultures), linguistic equivalence (equivalent meaning after translation), psychometric equivalence (statistical MI testing), and functional equivalence (similar relationships with external criteria) [61].
Achieving measurement invariance remains both a statistical challenge and an ethical imperative in cognitive terminology research, particularly in global drug development contexts where valid cross-cultural comparisons are essential. The comparative analysis presented in this guide demonstrates that while traditional MGCFA provides a rigorous framework for testing invariance, emerging methods like alignment optimization offer practical alternatives when full invariance is unattainable.
Future directions in this field include developing more robust statistical methods for handling partial invariance, establishing field-specific standards for reporting measurement invariance results, and creating guidelines for determining when partial invariance suffices for meaningful group comparisons. Additionally, greater emphasis on proactive scale development that incorporates diversity from the initial design stages will reduce subsequent invariance issues.
For researchers and drug development professionals, the evidence clearly indicates that neglecting measurement invariance testing risks substantial bias in cross-group comparisons. The methodologies and protocols outlined here provide a practical foundation for ensuring that cognitive terminology scales measure constructs equivalently across diverse populations, thereby strengthening the validity and equity of research outcomes in global mental health and pharmaceutical development.
For researchers and drug development professionals, the development of cognitive assessment scales presents a fundamental dilemma: balancing comprehensive measurement of complex cognitive constructs against the very real constraints of participant burden and practical feasibility. Scales that are too lengthy risk fatigue, poor compliance, and increased dropout rates, particularly in vulnerable populations such as older adults or those with cognitive impairments. Conversely, scales that are too brief may lack the psychometric robustness necessary for reliable measurement and sensitive detection of cognitive change. This balancing act is particularly crucial in clinical trials where cognitive endpoints must be measured with both precision and practicality.
The search for this equilibrium spans multiple dimensions: scale length, administration format, technological adaptation, and psychometric integrity. This guide systematically compares current approaches, evaluates their supporting experimental data, and provides a framework for selecting and optimizing cognitive assessment tools for specific research contexts.
Comparative Analysis of Scale Formats and Length Optimization Strategies
Table 1: Comparison of Cognitive Assessment Scale Optimization Approaches
| Assessment Scale/Strategy | Original Length (items) | Optimized Length/Method | Key Psychometric Outcomes | Participant Burden Reduction |
|---|---|---|---|---|
| HKCAS-T Cognition Scale | 83 items | 77 items (6 removed via Rasch analysis) | Internal consistency: 0.98, Test-retest reliability: 0.98 [5] | 7% reduction while maintaining validity |
| Scale Development Best Practices | Initial pool: 2-5x final scale | Final version after item reduction | Improved reliability and validity through statistical selection [24] | Systematic reduction while preserving measurement properties |
| CATest (Cognitive Assessment Test) | Not specified | 3 subtests: Immediate recall, clock drawing, phonological fluency | Sensitivity: 84.3%, Specificity: 71.4%, AUC: 0.85 [63] | Brief administration targeting multiple cognitive domains |
| ASSC (Assessment of Size and Scale Cognition) | Multiple existing instruments | Computer-based format with automated scoring | Reliability (McDonald's Omega >0.85), reduced administration time [4] | Automated administration and scoring reduces researcher and participant burden |
| Digital Cognitive Tests (eMMSE, eCDT) | Equivalent to paper versions | Digital adaptation with automated features | eMMSE AUC: 0.82 vs paper MMSE AUC: 0.65 [64] | Standardized administration, automated scoring |
Table 2: Digital vs. Traditional Scale Administration Comparison
| Characteristic | Traditional Paper Scales | Digital Adaptations | Experimental Findings |
|---|---|---|---|
| Administration Time | MMSE: 6.21 minutes [64] | eMMSE: 7.11 minutes [64] | Slightly longer initial digital administration |
| Scoring Consistency | Subject to examiner bias and training | Automated scoring algorithms | Reduced inter-rater variability [64] |
| Practice Effects | Manual counterbalancing needed | Modest practice effects observed (0-4.2% RT improvement) [65] | Digital tools may show smaller practice effects |
| Participant Preference | Familiarity valued by older adults | Positive usability ratings despite preference for paper [64] | Preference-traditional but acceptance-digital |
| Data Collection | Manual entry and processing | Direct digital capture and analysis | Enhanced data quality and immediate availability |
Experimental Protocols for Scale Optimization
Rasch Analysis for Item Reduction
The HKCAS-T Cognition Scale development employed Rasch analysis to systematically reduce items while preserving psychometric integrity [5]. The protocol included:
Initial Item Pool Generation: 83 items developed based on the Cattell-Horn-Carroll theory, consistent with commonly used assessment tools like the Wechsler scales.
Unidimensionality Testing: Rasch analysis examined measurement properties using infit and outfit statistics, point measure correlations, and principal component analysis of residuals.
Item Reduction Criteria: Items were removed based on unsatisfactory goodness-of-fit statistics, resulting in a 77-item version (6 items removed).
Reliability Validation: The reduced scale maintained internal consistency (KR-20) of 0.98 and test-retest reliability (intraclass correlation) of 0.98 after a 4-week interval [5].
Validity Testing: Concurrent validity established through positive correlation with the Cognitive Scale in the Cognitive Battery of the Merrill-Palmer-Revised Scales of Development (M-P-R).
This method demonstrates that targeted statistical approaches can effectively reduce participant burden without compromising measurement quality, with the HKCAS-T achieving a 7% reduction in items while maintaining excellent reliability.
Digital Adaptation and Validation Protocol
The validation of digital cognitive assessments followed rigorous comparative protocols [64]:
Randomized Crossover Design: Participants (N=47, aged 65+) were randomized to complete either paper-based (MMSE, CDT) or digital versions (eMMSE, eCDT) first, with a two-week washout period before completing the alternate format.
Validity Assessment: Spearman correlation between digital and paper versions, linear mixed-effects models, sensitivity/specificity analysis, and area under the curve (AUC) calculations using neurologist-verified results as the gold standard.
Usability Evaluation: Administration of the Usefulness, Satisfaction, and Ease of Use (USE) questionnaire, assessment of participant preferences, and precise timing of assessment duration.
Impact Analysis: Regression analyses to explore how usability factors influenced digital test scores, controlling for cognitive level, education, age, and gender.
The findings revealed that digital tests showed moderate correlations with paper-based versions but demonstrated superior diagnostic accuracy (eMMSE AUC: 0.82 vs. paper MMSE AUC: 0.65), supporting their validity despite slightly longer administration times [64].
Multi-Test Integration Protocol
Research on mild cognitive impairment assessment has demonstrated that combining multiple focused tools can enhance diagnostic accuracy while managing assessment burden [66]:
Tool Selection: Administration of Montreal Cognitive Assessment (MoCA), London Tower Test (LTT), Wisconsin Card Sorting Test (WCST), and Wechsler Memory Scale-Third Edition (WMS-III) to 293 women aged ≥60.
Diagnostic Accuracy Comparison: Calculation of sensitivity, specificity, and accuracy for each tool, with WMS-III showing the highest sensitivity (0.700) and accuracy (0.625), while WCST demonstrated the highest specificity (0.850) [66].
Cross-Validation: Comparison of tool-based assessments with human diagnosis, showing significant agreement (p<0.001).
Optimized Combination: Findings indicated that integrating multiple tools with complementary strengths (high sensitivity and high specificity measures) enhanced overall diagnostic accuracy more effectively than single comprehensive instruments.
This approach allows researchers to select targeted assessments based on specific research needs rather than relying on single omnibus measures, potentially reducing overall burden while improving measurement precision.
Visualization of Scale Optimization Workflows
Scale Optimization Decision Workflow
Factors Influencing Scale Optimization Decisions
Table 3: Essential Research Reagents and Tools for Cognitive Scale Development
| Tool/Resource | Function in Scale Development | Application Example |
|---|---|---|
| Rasch Analysis Software | Examines unidimensionality and item fit | HKCAS-T item reduction, identifying 6 poorly-fitting items [5] |
| Digital Assessment Platforms | Standardize administration and automate scoring | DANA battery for remote cognitive monitoring [65] |
| Cognitive Test Batteries | Provide gold-standard validation measures | Merrill-Palmer-Revised Scales for concurrent validity [5] |
| Statistical Packages for Reliability Analysis | Calculate internal consistency and test-retest reliability | KR-20 and intraclass correlation calculations [5] |
| Usability Assessment Tools | Evaluate participant interaction with assessments | USE questionnaire for digital test usability [64] |
The optimization of cognitive assessment scales requires methodical balancing of multiple competing priorities: comprehensive construct coverage versus participant burden, psychometric rigor versus practical feasibility, and technological innovation versus accessibility. The experimental evidence indicates that structured approaches to item reduction, such as Rasch analysis, can effectively shorten scales while preserving their measurement properties. Similarly, digital adaptations offer opportunities for standardized administration and automated scoring, though they must be carefully validated against established standards.
For researchers and drug development professionals, the selection and optimization of cognitive assessment scales should be guided by:
- Clear construct definition and alignment with research objectives
- Systematic psychometric validation using appropriate statistical methods
- Consideration of participant characteristics and contextual factors
- Strategic use of technology where it enhances reliability without introducing new barriers
- Ongoing evaluation of both measurement properties and practical implementation
The continuing development of sophisticated assessment methodologies, including computerized adaptive testing and integrated digital platforms, promises further advances in our ability to capture complex cognitive constructs with both precision and efficiency.
Evidence-Based Tool Selection: A Comparative Analysis of Cognitive Scales in Action
Accurate and early detection of mild cognitive impairment (MCI) is a critical objective in neurology and geriatric medicine, serving as a pivotal step for initiating interventions that may slow progression to dementia. For researchers and drug development professionals, the selection of cognitive screening tools with optimal diagnostic accuracy is fundamental to clinical trial design, patient stratification, and outcome measurement. The psychometric properties of these instruments—particularly sensitivity and specificity—directly impact the validity of research findings and the efficacy of therapeutic interventions. This guide provides a data-driven comparison of common MCI screening tools, summarizing performance metrics from recent validation studies to inform evidence-based instrument selection.
At a Glance: Performance Metrics of Common MCI Screening Tools
The following table synthesizes key performance data from recent studies, offering a concise overview of how these tools differentiate individuals with MCI from those with normal cognition.
Table 1: Diagnostic Accuracy of Common MCI Screening Tools
| Screening Tool | Optimal Cut-off for MCI | Sensitivity (%) | Specificity (%) | Area Under the Curve (AUC) | Context & Population |
|---|---|---|---|---|---|
| Montreal Cognitive Assessment (MoCA) | ≤ 25 [66] | 90.2 [67] | 87.2 [67] | 0.943 [67] | Community-dwelling older adults; superior to MMSE [67] |
| MoCA (for MSA patients) | ≤ 19.5 [68] | Information Missing | Information Missing | 0.702 [68] | Multiple System Atrophy (MSA) population [68] |
| Mini-Mental State Examination (MMSE) | ≤ 24 (standard) [67] | 78.4 [67] | 76.9 [67] | 0.826 [67] | Community-dwelling older adults; lower accuracy than MoCA [67] |
| MMSE (for MSA patients) | ≤ 26.5 [68] | Information Missing | Information Missing | 0.698 [68] | Multiple System Atrophy (MSA) population [68] |
| Wechsler Memory Scale-Third Edition (WMS-III) | Varies by subset | 70.0 [66] | Information Missing | Information Missing | Older Iranian women; demonstrated highest sensitivity in a comparative study [66] |
| Wisconsin Card Sorting Test (WCST) | Varies by index | Information Missing | 85.0 [66] | Information Missing | Older Iranian women; demonstrated highest specificity in a comparative study [66] |
Detailed Tool Comparisons and Methodologies
The MoCA vs. MMSE: A Direct Comparative Study
A 2025 cross-sectional study provides a robust head-to-head comparison of the MoCA and MMSE. The research involved 90 community-dwelling older adults (aged 60+), classified as cognitively preserved or impaired using the Clinical Dementia Rating (CDR) scale as a gold standard [67].
- Experimental Protocol: Participants underwent assessment with both the MMSE and MoCA. Diagnostic accuracy was evaluated using Receiver Operating Characteristic (ROC) curve analysis. The study notably employed both standard and education-adjusted cut-off scores to account for this confounding variable [67].
- Key Findings: The MoCA demonstrated statistically superior discriminative ability compared to the MMSE. With a significantly larger AUC (0.943 vs. 0.826), it also achieved higher sensitivity (90.2% vs. 78.4%) and specificity (87.2% vs. 76.9%). When education-adjusted cut-offs were applied, the MoCA's diagnostic accuracy (87.8%) far exceeded that of the MMSE (71.1%) [67].
Evaluating a Broader Neuropsychological Battery
A 2025 psychometric study compared five diagnostic tools for detecting MCI among 293 older Iranian women, offering insights beyond brief screeners [66].
- Experimental Protocol: This cross-sectional study assessed participants using the MoCA at two time points, the London Tower Test (LTT), the Wisconsin Card Sorting Test (WCST), and the Wechsler Memory Scale-Third Edition (WMS-III). Statistical analyses included Bayesian methods and calculations of sensitivity, specificity, and accuracy [66].
- Key Findings: The WMS-III, a comprehensive memory assessment, showed the highest sensitivity (70.0%) and overall accuracy (62.5%) among the tools studied. In contrast, the WCST, a measure of executive function and cognitive flexibility, demonstrated the highest specificity (85.0%), making it particularly strong at correctly identifying healthy individuals. The MoCA's scores improved slightly upon re-testing, highlighting the potential for practice effects [66].
Disease-Specific Validation: The Case of Multiple System Atrophy
Screening tool performance can vary significantly in specific patient populations. A 2025 study established optimal cut-offs for the MMSE and MoCA in patients with Multiple System Atrophy (MSA) [68].
- Experimental Protocol: Sixty-two MSA patients underwent a comprehensive (Level II) neuropsychological evaluation to diagnose MCI or dementia. ROC analyses were then used to determine the optimal cut-off scores for the MMSE and MoCA in this specific population [68].
- Key Findings: The general population cut-off of ≤25 on the MoCA was too high for MSA patients. The optimal cut-off to detect MCI in MSA was found to be ≤19.5. Similarly, the standard MMSE cut-off of ≤24 was less accurate than a higher cut-off of ≤26.5 for detecting MCI in this cohort. This underscores the critical need for population-specific validation of cognitive screeners [68].
The following diagram visualizes the multi-stage workflow involved in the typical experimental protocols used for validating and comparing MCI screening tools, as described in the cited studies.
The Scientist's Toolkit: Essential Reagents for MCI Research
For clinical researchers designing trials or validation studies, the following table outlines key tools and their functions in assessing cognitive impairment.
Table 2: Key Research Reagent Solutions in Cognitive Impairment Studies
| Tool Name | Primary Function in Research | Key Characteristics |
|---|---|---|
| Clinical Dementia Rating (CDR) Scale | Gold standard for staging severity of cognitive impairment and dementia [67] [69]. | Structured interview assessing six cognitive and functional domains; provides a global score and Sum of Boxes (CDR-SB) for finer granularity [69] [70]. |
| Montreal Cognitive Assessment (MoCA) | Brief cognitive screener for detecting MCI [67] [66] [68]. | Assesses multiple domains (executive function, memory, visuospatial); highly sensitive; requires license for use [67]. |
| Wechsler Memory Scale (WMS) | Comprehensive assessment of memory function [66]. | Evaluates auditory, visual, and working memory; high sensitivity for memory-related deficits [66]. |
| Wisconsin Card Sorting Test (WCST) | Measure of executive function (cognitive flexibility, abstract reasoning) [66]. | High specificity for cognitive impairment; less reliant on language/educational level [66]. |
| Creyos MCI Screener (Digital) | Digital, self-administered cognitive screener [71]. | Uses tasks like Feature Match (non-verbal); can be completed in ~5 minutes without clinician supervision [71]. |
The head-to-head data clearly indicates that the MoCA is generally a more accurate screening tool for MCI than the MMSE, particularly when educational level is accounted for [67]. However, for research requiring deep domain-specific assessment, instruments like the WMS-III (for memory) and the WCST (for executive function) offer valuable, high-fidelity data, with the former excelling in sensitivity and the latter in specificity [66]. Ultimately, the choice of tool must be guided by the research context, including the target population and the cognitive domains of primary interest. No single tool is universally superior, but an evidence-based selection significantly strengthens the validity and impact of clinical research.
In an era of increasing globalization in scientific research, the comparison of cognitive and psychological constructs across diverse populations has become commonplace. However, these comparisons rest on a critical, often unverified assumption: that measurement instruments function equivalently across different countries and cultures. Measurement invariance—the statistical property indicating that the same construct is being measured across specified groups—serves as the foundational requirement for meaningful cross-cultural comparison [72]. When researchers neglect to test this assumption, they risk comparing "chopsticks with forks," potentially leading to flawed interpretations and erroneous conclusions about group differences [73].
The perils of non-invariance extend beyond academic curiosity to affect real-world applications, including clinical diagnosis, educational assessment, and public health policy. This case study examines concrete examples from recent research where measurement invariance testing revealed fundamental limitations in cross-country comparisons, provides detailed methodological protocols for conducting these tests, and offers evidence-based solutions for researchers navigating these complex methodological challenges.
Theoretical Framework: Understanding Measurement Invariance
Defining Measurement Equivalence
Measurement invariance exists when "the same questionnaire in different groups measures the same construct in the same way" [73]. Formally, this means that the relationship between observed scores (responses to questionnaire items) and latent constructs (theoretical concepts like depression or cognitive ability) should not depend on group membership such as country or culture [72]. When this property holds, observed score differences reflect true differences in the underlying construct rather than methodological artifacts.
Hierarchical Levels of Invariance Testing
Measurement invariance is tested sequentially through increasingly restrictive levels, each enabling different types of comparisons [73] [40] [72]:
Figure 1: The hierarchical nature of measurement invariance testing, showing the sequence of constraints and the types of comparisons each level permits.
Consequences of Measurement Non-Invariance
When measurement invariance fails, the implications for research are profound. As illustrated in Figure 2, non-invariant measures can lead to fundamentally different response functions across groups, making direct comparisons invalid [73]. For example, if a depression item about "crying" has different relationships to the underlying construct of depression in different cultures, then comparing depression scores across those cultures becomes problematic [40]. In clinical contexts, this could lead to misdiagnosis or ineffective treatment allocation. In cross-national studies, it could foster incorrect conclusions about cultural differences that are actually methodological artifacts.
Figure 2: Conceptual diagram illustrating how non-invariance affects the relationship between latent constructs and observed scores across different groups.
Case Study 1: Failure of Cognitive Performance Measurement in European Elderly
Background and Methodology
A 2025 study examined the measurement invariance of a Global Cognitive Performance (GCP) measure across 27 European countries and Israel using data from the Survey of Health, Ageing and Retirement in Europe (SHARE) [74]. The study included 55,569 adults aged 60-102 years and employed four cognitive measures commonly combined into a composite score: word recall, verbal fluency, temporal orientation, and numeracy.
Researchers applied both traditional multi-group confirmatory factor analysis (MGCFA) and the newer alignment optimization approach to test measurement invariance. The traditional approach tests increasingly constrained models, while the alignment method identifies the sources and extent of non-invariance when full invariance does not hold [74].
Key Findings and Implications
The analysis revealed significant measurement non-invariance that compromised cross-country comparability:
- 31.85% of factor loading estimates were noninvariant across countries
- 54.81% of item intercept estimates showed significant deviations from invariance [74]
- The unidimensional GCP model demonstrated adequate fit within individual countries but failed invariance tests across countries
- Malta showed particularly poor model fit, requiring its exclusion from cross-country analyses
Table 1: Results from SHARE Cognitive Performance Measurement Invariance Study
| Aspect Measured | Finding | Implication |
|---|---|---|
| Overall Model Fit | Adequate within countries but poor across countries | Country-specific interpretations possible; cross-country comparisons invalid |
| Factor Loadings | 31.85% noninvariant | Items relate differently to cognitive ability across countries |
| Item Intercepts | 54.81% noninvariant | Different response thresholds across countries |
| Recommendation | Avoid cross-country mean comparisons | Use country-specific norms or develop invariant measures |
This failure of measurement invariance suggests that previously reported cross-country differences in cognitive performance using SHARE data may reflect methodological artifacts rather than true differences. The study authors consequently recommended against making direct cross-country comparisons of GCP scores using the existing measures [74].
Case Study 2: Successful Equivalence of Depression Measurement
Background and Methodology
In contrast to the cognitive performance study, research on the 8-item Patient Health Questionnaire (PHQ-8) for depression screening demonstrated successful measurement invariance across 27 European countries [75]. This massive study included 258,888 participants from the second wave of the European Health Interview Survey (EHIS-2) conducted between 2014-2015.
Researchers employed categorical confirmatory factor analysis appropriate for the ordinal nature of PHQ-8 responses, followed by multi-group CFA to test measurement invariance at configural, metric, and scalar levels [75].
Key Findings and Implications
The PHQ-8 demonstrated strong evidence of measurement equivalence:
- High internal consistency across all countries (Cronbach's α > 0.80 in all nations)
- Full scalar invariance achieved across all 27 countries
- Item 2 ("feeling down, depressed, or hopeless") showed the highest discrimination in 24 of 27 countries [75]
- Reliability was highest in Romania, Bulgaria, and Cyprus, and lowest (though still adequate) in Iceland, Norway, and Austria
Table 2: Cross-Country Equivalence of PHQ-8 Depression Scale
| Property | Finding | Implication |
|---|---|---|
| Internal Consistency | High across all countries (α > 0.80) | Reliable measurement in all contexts |
| Measurement Invariance | Configural, metric, and scalar invariance achieved | Valid cross-country comparisons possible |
| Most Discriminating Item | "Feeling down, depressed, or hopeless" (Item 2) | Core depression symptom consistent across cultures |
| Suitability | Appropriate for cross-country depression comparisons | Supports standardized screening across Europe |
This successful demonstration of measurement invariance means that differences in PHQ-8 scores across European countries likely reflect true differences in depression prevalence and severity rather than measurement artifacts. The findings validate the use of PHQ-8 for cross-national depression surveillance and research throughout Europe [75].
Methodological Protocols for Testing Measurement Invariance
Standard Multi-Group Confirmatory Factor Analysis (MGCFA)
The most established approach for testing measurement invariance uses MGCFA within a structural equation modeling framework [73] [40]. The sequential testing protocol proceeds as follows:
Configural Invariance: Test whether the same factor structure (number of factors and pattern of loadings) holds across groups without equality constraints [40] [72].
Metric Invariance: Constrain factor loadings to be equal across groups and compare model fit to the configural model [73] [40].
Scalar Invariance: Constrain both factor loadings and item intercepts to be equal across groups and compare to the metric model [40] [72].
Strict Invariance: Constrain factor loadings, intercepts, and residual variances to be equal across groups [40].
At each step, researchers examine changes in model fit using criteria such as ΔCFI ≤ -0.01 complemented by ΔRMSEA ≥ 0.015 [40] [72]. When invariance holds, proceeding to the next level is justified.
Advanced and Alternative Approaches
When full measurement invariance is not achieved, several alternative strategies exist:
Partial Invariance: When most parameters are invariant, non-invariant parameters can be freed while maintaining constraints on invariant parameters [73] [40]. This approach requires that at least two indicators per construct demonstrate invariant loadings and intercepts.
Alignment Optimization: A newer method that identifies the specific parameters causing non-invariance and estimates group-specific means and variances while minimizing the impact of non-invariance [73] [74].
Item Response Theory (IRT) Approaches: Using differential item functioning (DIF) analysis to identify items that function differently across groups [76] [40].
Bayesian Structural Equation Modeling: Allows for approximate invariance by incorporating prior distributions for parameters [73].
Comprehensive Cross-Cultural Validation Framework
Recent research has synthesized a 10-step framework for cross-cultural scale development and validation [76]:
Table 3: Comprehensive Framework for Cross-Cultural Scale Development
| Stage | Key Steps | Techniques |
|---|---|---|
| Item Development | 1. Generate culturally relevant items2. Review by diverse experts3. Ensure translatability | Literature reviews, focus groups, expert panels, cognitive interviews |
| Translation | 4. Implement rigorous translation protocols5. Review translated items | Back-translation, collaborative team approach, expert review |
| Scale Development | 6. Pilot testing in multiple cultures7. Assess preliminary psychometrics | Cognitive debriefing, separate factor analysis in each sample |
| Scale Evaluation | 8. Test measurement invariance9. Establish validity and reliability10. Develop norms and cutoffs | MGCFA, DIF analysis, alignment optimization, reliability testing |
Essential Research Reagents and Tools
Table 4: Essential Methodological Tools for Measurement Invariance Research
| Tool/Technique | Function | Application Context |
|---|---|---|
| Multi-Group Confirmatory Factor Analysis (MGCFA) | Tests hierarchical levels of measurement invariance | Primary method for establishing measurement equivalence |
| Alignment Optimization | Estimates group-specific parameters when full invariance fails | Useful with many groups or when partial invariance is insufficient |
| Differential Item Functioning (DIF) | Identifies items functioning differently across groups | Item-level analysis within IRT framework |
| Rasch Models | Examines item functioning and person measures simultaneously | Particularly useful for cognitive and achievement tests |
| Bayesian SEM | Incorporates prior knowledge and handles complex models | Useful with small samples or complex invariance patterns |
This case study demonstrates that measurement invariance is not merely a statistical technicality but a fundamental requirement for valid cross-country comparisons. The contrasting outcomes between the cognitive performance assessment (which failed invariance tests) and the depression scale (which demonstrated strong invariance) highlight the importance of empirically testing this assumption rather than simply presuming it holds.
Based on the evidence presented, we recommend:
- Routine testing of measurement invariance should become standard practice in cross-country research
- Transparent reporting of invariance testing procedures and results in publications
- Methodological flexibility—employing both traditional and modern approaches (MGCFA, alignment, IRT) depending on research context
- Cultural competence in scale development, involving diverse stakeholders from initial stages
- Appropriate interpretation of findings in light of invariance testing results
When measurement invariance fails, researchers should either revise measures, employ statistical corrections, or clearly acknowledge comparison limitations. By adopting these practices, the scientific community can enhance the validity and reliability of cross-country research, leading to more meaningful comparisons and more effective interventions across diverse populations.
The rising global prevalence of cognitive impairment and dementia has created an urgent need for scalable, accessible cognitive screening tools that can be deployed across diverse settings, from primary care clinics to remote clinical trials [77] [78]. Traditional paper-based cognitive assessments, while well-validated, face significant limitations in scalability, standardization, and efficiency due to their dependency on trained administrators, manual scoring, and in-person administration [79] [77]. These constraints have accelerated the development and adoption of digital cognitive assessments (DCAs), which offer automated administration, precise measurement, and remote testing capabilities [38] [78].
Within the broader context of validating cognitive terminology measurement scales research, this comparison guide examines the experimental evidence supporting the transition from established paper-based tests to their digital counterparts. For researchers, scientists, and drug development professionals, understanding the real-world usability and validity metrics of these tools is paramount for selecting appropriate instruments for clinical trials, diagnostic protocols, and large-scale screening initiatives. This analysis synthesizes current validation data, methodological approaches, and practical considerations to inform evidence-based implementation of digital cognitive assessment technologies.
Comparative Performance Metrics: Digital vs. Paper-Based Assessments
Diagnostic Accuracy and Validity
Table 1: Criterion Validity and Diagnostic Accuracy of Digital Cognitive Assessments
| Assessment Tool | Traditional Comparator | Population | Validity Correlation | AUC for Impairment Detection | Sensitivity/Specificity |
|---|---|---|---|---|---|
| eMMSE [79] | Paper-based MMSE | Older adults (65+), primary care | Moderate correlation | 0.82 (vs. 0.65 for paper) | Not specified |
| eCDT [79] | Paper-based Clock Drawing Test | Older adults (65+), primary care | Moderate correlation | 0.65 (vs. 0.45 for paper) | Not specified |
| BrainCheck [80] | Trail Making, Stroop, HVLT-R, WAIS-DSS | Adults (18-84) | Moderate to high correlations (r values not specified) | Not specified | Not specified |
| RoCA [77] | ACE-3, MoCA | Neurology patients (33-82 years) | Classifies similarly to gold standards | 0.81 | Sensitivity: 0.94 |
| DACI (Compact) [81] | Pencil-and-paper CIST | Older adults (cognitively impaired & healthy) | Not specified | 0.871 | Not specified |
The data reveal that well-designed digital assessments can achieve comparable—and in some cases superior—discriminatory power for identifying cognitive impairment compared to traditional paper-based tests. The electronic Mini-Mental State Examination (eMMSE) demonstrates particularly strong diagnostic performance with an AUC of 0.82 compared to 0.65 for the paper version [79]. Similarly, the Rapid Online Cognitive Assessment (RoCA) shows high sensitivity (0.94) in detecting cognitive impairment when validated against established instruments like the Addenbrooke's Cognitive Examination-3 (ACE-3) and Montreal Cognitive Assessment (MoCA) [77].
Administration Efficiency and Usability
Table 2: Administration Time and Usability Metrics
| Assessment Tool | Format | Average Administration Time | Usability Findings | Participant Preferences |
|---|---|---|---|---|
| MMSE [79] | Paper-based | 6.21 minutes | Requires professional training | Older adults preferred paper-based versions despite positive digital feedback |
| eMMSE [79] | Tablet-based | 7.11 minutes | Positive feedback on digital format | |
| BrainCheck [38] | Remote, self-administered | 10-15 minutes for full battery | Feasible for self-administration | Not specified |
| DACI (Full) [81] | Mobile application | 321 seconds (~5.4 minutes) | Designed to minimize fatigue | Not specified |
| DACI (Compact) [81] | Mobile application | 91 seconds (~1.5 minutes) | Reduced cognitive load | Not specified |
Digital assessments introduce a time efficiency trade-off, with some digital versions taking longer to complete than their paper-based equivalents. The eMMSE required approximately one minute longer than the paper MMSE [79]. However, this must be balanced against the reduction in professional time achieved through automated scoring and administration. The development of optimized brief digital batteries, such as the compact DACI which maintains diagnostic accuracy while reducing testing time to just 91 seconds, demonstrates the potential for highly efficient digital assessment [81].
Despite generally positive feedback on digital formats, participant preferences may still favor traditional methods. One study found that while older adults provided positive evaluations of digital tests, they still preferred paper-based versions, highlighting the importance of considering subjective user experience alongside objective performance metrics [79].
Experimental Methodologies for Validation
Validation Study Designs
Validation of digital cognitive assessments employs rigorous methodological approaches to establish reliability, validity, and practical utility:
Randomized Crossover Designs: Studies such as the eMMSE validation utilize randomized crossover designs where participants complete both digital and paper-based versions in counterbalanced order, with washout periods (e.g., two weeks) between administrations to minimize practice effects [79]. This design enables direct within-subject comparisons while controlling for order effects.
Remote Self-Administration Protocols: Studies evaluating tools like BrainCheck employ remote testing protocols where participants complete assessments on their own devices (iPads, iPhones, or laptops) in unsupervised settings, with comparison to proctored administrations [38]. This methodology specifically tests the feasibility and reliability of real-world deployment scenarios.
Machine Learning Optimization: Advanced validation approaches incorporate machine learning to optimize test batteries. The DACI development used feature selection algorithms to identify the most informative subtests, creating a compact version that maintained diagnostic accuracy while significantly reducing administration time [81].
The following workflow illustrates the typical validation process for digital cognitive assessments:
Key Methodological Considerations
Controlling for Educational Effects: Studies specifically address how education levels impact digital test performance, with research showing that correlations between digital and paper-based tests may be lower in populations with limited education (≤6 years) [79]. This highlights the need for validation across diverse demographic groups.
Digital Literacy Assessment: Comprehensive validation includes evaluation of technological adaptability, often using standardized usability questionnaires to assess dimensions such as intention to use, perceived usefulness, and ease of learning [79] [78].
Ecological Validity Testing: Remote assessment studies examine whether at-home testing environments produce results comparable to controlled clinical settings, with some evidence suggesting that home environments may reduce test anxiety and provide more accurate reflections of day-to-day cognitive abilities [38].
The Researcher's Toolkit: Essential Methodological Components
Table 3: Research Reagent Solutions for Cognitive Assessment Validation
| Research Component | Function in Validation | Examples from Literature |
|---|---|---|
| Criterion Standard Tests | Provide gold-standard comparison for validity testing | MMSE, CDT, ACE-3, MoCA [79] [77] |
| Usability Metrics | Quantify user experience and technological adaptability | USE Questionnaire (Usefulness, Satisfaction, Ease of Use) [79] |
| Automated Scoring Systems | Reduce administrator bias and increase standardization | SketchNet convolutional neural network for RoCA drawing tasks [77] |
| Device-Agnostic Platforms | Enable testing across multiple device types | Web-based assessments compatible with tablets, smartphones, and laptops [38] |
| Parallel Test Forms | Minimize practice effects in repeated measures | Randomized stimulus pairs in BrainCheck [38] |
The validation evidence demonstrates that digital cognitive assessments can achieve psychometric properties comparable to traditional paper-based tests while offering significant advantages in scalability, standardization, and administrative efficiency. However, successful implementation requires careful consideration of several factors:
Population Characteristics: Educational background and prior technological experience significantly impact digital test performance and acceptability [79]. Researchers should select assessment tools validated in populations with similar demographics to their target population.
Assessment Context: Brief, highly sensitive instruments like RoCA may be ideal for initial screening [77], while more comprehensive batteries like BrainCheck may be preferable for detailed cognitive profiling [38] [80].
Technical Infrastructure: Device-agnostic web-based platforms maximize accessibility [38], while specialized applications may offer enhanced functionality but require specific hardware.
The evolving landscape of digital cognitive assessment continues to advance with innovations in machine learning optimization [81], remote unsupervised administration [38] [78], and high-frequency testing methodologies [78]. These developments promise to enhance the detection of subtle cognitive changes in both clinical and research contexts, ultimately supporting earlier intervention and more effective evaluation of therapeutic interventions.
In the domains of cognitive science and education research, the validity and reliability of measurement scales are paramount. Specialized instruments allow researchers to quantify complex constructs, from students' understanding of scientific scale to the subtle cognitive sequelae of brain injury. The Assessment of Size and Scale Cognition (ASSC) and various brain injury criteria (BIC) exemplify this principle, yet they were developed for distinct populations and purposes, utilizing vastly different methodological frameworks and validation protocols. This guide provides a detailed, objective comparison of these specialized scales, framing them within the broader context of measurement validation in cognitive terminology research. By presenting their development, key experimental findings, and inherent limitations, this analysis aims to equip researchers, scientists, and drug development professionals with the data necessary to select and interpret these tools appropriately within their specific investigative contexts.
The following sections synthesize experimental data and validation studies to compare the psychometric properties, application boundaries, and practical implementations of these instruments. Structured tables and diagrams provide clear comparisons of their performance characteristics and the theoretical frameworks that underpin them.
Assessment of Size and Scale Cognition (ASSC)
The ASSC is a computer-based assessment designed to measure a fundamental component of the crosscutting concept "scale, proportion, and quantity" in science education [4]. Its development was guided by the Framework to Characterize and Scaffold Size and Scale Cognition, which posits five distinct cognitive aspects: Qualitative Relational, Qualitative Categorical, Quantitative Absolute, Quantitative Proportional, and Qualitative Proportional conceptions [4]. The instrument was created to address limitations of previous tools, which were often time-intensive, limited in scope, difficult to replicate, or lacked robust validity evidence [4].
Brain Injury Criteria (BIC) and Cognitive Load Assessment
In contrast, brain injury research employs various criteria to assess injury risk and cognitive impact. These include kinematics-based BIC derived from head impact kinematics (e.g., HIC, SI, BrIC) to predict brain injury risk, and cognitive assessment scales designed to detect impairments resulting from injury [82] [83]. Unlike the ASSC, which targets knowledge structures, BIC are often based on physical parameters like linear acceleration, angular velocity, and angular acceleration, and are validated against finite element (FE) models of brain strain [82]. For direct cognitive measurement, tools like the Cognitive Load of Activity Participation scale (CLAPs) for older adults and digital cognitive tests like BrainCheck have been developed to evaluate cognitive load and impairment [84] [64] [85].
Table 1: Fundamental Characteristics of the Featured Scales
| Scale | Primary Construct Measured | Target Population | Format | Theoretical/Conceptual Basis |
|---|---|---|---|---|
| ASSC | Size and scale cognition | First-year undergraduate students | Computer-based assessment | Framework to Characterize and Scaffold Size and Scale Cognition (Magaña et al., 2012) |
| BIC (e.g., HIC, BrIC) | Brain injury risk based on mechanical impact | General population (from sports, car crashes) | Head impact kinematics measurement & finite element modeling | Biomechanical models relating head kinematics to brain strain |
| Digital Cognitive Tests (e.g., BrainCheck) | Cognitive function/impairment | Older adults (MCI screening), brain injury patients | Digital platform (tablet, computer, phone) | Traditional neuropsychological tests (e.g., MMSE, CDT) |
Experimental Validation and Performance Data
ASSC Validation Methodology and Results
The ASSC underwent a rigorous, multi-stage validation process. Development involved an iterative review among content experts, graphic design experts, and human-computer interaction specialists to establish content and face validity [4]. A pilot test was conducted with 518 first-year undergraduate students to assess psychometric properties [4]. The instrument's alignment with the Magaña et al. framework ensured construct validity, covering all five cognitive aspects of size and scale cognition [4]. While the specific reliability coefficients (e.g., test-retest, internal consistency) were not detailed in the available excerpt, the overall results suggested the instrument was "reliable" for measuring students' size and scale cognition [4].
Brain Injury Criteria and Cognitive Assessment Validation
Biomechanical BIC Validation
The validation of BIC involves correlating them with brain strain metrics computed using FE models. A 2021 study evaluated 18 different BIC against three brain strain measures: 95% maximum principal strain (MPS95), 95% MPS at the corpus callosum (MPSCC95), and cumulative strain damage at 15% (CSDM-15) [82]. The study used a large dataset of head impacts from various sources: laboratory impacts (n=2183), college football impacts (n=302), mixed martial arts impacts (n=457), automobile crashes (n=48), and NASCAR impacts (n=272) [82].
A critical finding was that the relationships between BIC and brain strain were significantly different across datasets. This indicates that the same BIC value may suggest different levels of brain strain across different types of head impacts (e.g., sports vs. car crashes) [82]. Consequently, the accuracy of brain strain regression generally decreased when BIC models were fitted on a dataset of a different impact type than the target application, raising concerns about applying BIC to impact types different from their development context [82].
Digital Cognitive Test Validation
Digital cognitive assessments undergo validation by comparing their performance with traditional paper-based tests and clinical diagnoses. In a 2025 study, digital versions of the Mini-Mental State Examination (eMMSE) and Clock Drawing Test (eCDT) were evaluated with 47 participants using a randomized crossover design [64]. The eMMSE showed superior discriminant validity for Mild Cognitive Impairment (AUC = 0.82) compared to the paper-based MMSE (AUC = 0.65). Similarly, the eCDT (AUC = 0.65) outperformed the paper-based CDT (AUC = 0.45) [64].
Another study on the BrainCheck digital battery with 46 participants found moderate to good agreement between self-administered and research-coordinator-administered sessions, with intraclass correlation coefficients (ICCs) ranging from 0.59 to 0.83 across different cognitive tasks [85]. Mixed-effects modeling confirmed no significant difference in performance between the two administration methods, supporting the feasibility of remote self-administration [85].
Table 2: Comparative Validation Data and Performance Metrics
| Scale / Instrument | Validation Sample Size | Key Performance Metric | Result / Strength of Association |
|---|---|---|---|
| ASSC | 518 undergraduates | Psychometric properties (reliability & validity) | Results suggested the instrument is reliable (specific coefficients not provided) [4] |
| BIC (vs. Brain Strain) | ~3,262 total head impacts | Relationship between BIC and brain strain | Significantly different relationships across impact types; same BIC value can indicate different brain strain risks [82] |
| eMMSE (Digital MMSE) | 47 older adults | Area Under the Curve (AUC) for MCI detection | AUC = 0.82 (vs. 0.65 for paper MMSE) [64] |
| BrainCheck (Remote self-admin) | 46 adults | Intraclass Correlation (ICC) vs. administrator-led | ICC range: 0.59 to 0.83 across different cognitive tasks [85] |
Conceptual Frameworks and Methodological Workflows
The fundamental difference between these scales is evident in their underlying conceptual frameworks. The ASSC is grounded in an educational psychology framework targeting specific cognitive processes, while BIC are based on a biomechanical risk assessment model.
Diagram 1: Conceptual frameworks for the ASSC and BIC
Experimental Protocols and Research Workflows
The experimental protocols for validating these instruments differ significantly, reflecting their distinct applications and underlying constructs.
ASSC Validation Workflow
The development and validation of the ASSC followed a structured, iterative process involving multiple stakeholder groups to ensure robustness [4].
Diagram 2: ASSC development and validation workflow
Brain Injury Criteria Validation Protocol
The validation of Brain Injury Criteria follows a biomechanical approach, correlating impact kinematics with computational models of brain deformation [82].
- Data Collection: Head impact kinematics are gathered from various sources (sports, car crashes, laboratory tests) using instrumented mouthguards, anthropomorphic test dummies (ATD), or crash test data [82].
- Finite Element Modeling: The collected kinematics are applied to a validated FE model of the human head (e.g., the KTH model) to compute biomechanical responses within the brain tissue [82].
- Strain Calculation: The model outputs key strain metrics: 95% maximum principal strain (MPS95), MPS at the corpus callosum (MPSCC95), and cumulative strain damage (CSDM) [82].
- Statistical Correlation: Linear regression models are built to relate the 18 BIC (predictors) to the brain strain metrics (outcome variables) [82].
- Cross-Validation Analysis: The regression models are tested across different datasets (impact types) to evaluate generalizability, revealing that accuracy decreases when applied to impact types different from the development dataset [82].
The Researcher's Toolkit: Essential Materials and Reagents
Table 3: Key Research Reagent Solutions and Essential Materials
| Item Name / Category | Specific Examples / Specifications | Primary Function in Research Context |
|---|---|---|
| Finite Element Head Model | KTH FE Model, GHBMC, SIMon, THUMS | Computational simulation of brain biomechanics to calculate tissue-level strains (e.g., MPS, CSDM) from head impact kinematics [82] |
| Head Impact Kinematics Sensors | Stanford Instrumented Mouthguard, Hybrid III ATD Headform | Measurement of linear acceleration, angular velocity, and angular acceleration during head impacts in real-world scenarios (sports, crashes) [82] |
| Digital Cognitive Test Platform | BrainCheck Platform, eMMSE, eCDT | Administering standardized cognitive assessments digitally; enables remote self-administration, automated scoring, and precise reaction time capture [64] [85] |
| Validation Gold Standards | Neurologist Verification (ICD-11, Peterson's Criteria), Paper-Based MMSE & CDT | Providing criterion validity against which new digital cognitive tests or diagnostic criteria are evaluated and calibrated [64] |
| Statistical Analysis Frameworks | Linear Regression Modeling, Intraclass Correlation (ICC), Area Under Curve (AUC) | Quantifying relationships between variables (e.g., BIC vs. strain), assessing test-retest reliability, and evaluating diagnostic accuracy [82] [64] [85] |
The ASSC and brain injury assessment tools serve fundamentally different purposes and excel in their respective domains. The ASSC provides a structured, theory-driven approach to measuring a specific educational construct, with demonstrated utility in academic settings. In contrast, BIC offer practical, quantifiable metrics for assessing brain injury risk but demonstrate significant limitations in generalizability across impact types. Digital cognitive assessments show promise for accessible cognitive screening, with performance comparable to administrator-led versions, though they face usability challenges in populations with lower education levels.
Researchers must consider these performance characteristics and limitations when selecting assessment tools. The choice between these specialized scales should be guided by the specific research question, target population, and required level of precision, with careful attention to the validation context of each instrument.
Conclusion
The rigorous validation of cognitive measurement scales is not a mere methodological formality but a foundational pillar for generating reliable, reproducible, and comparable data in biomedical research and drug development. This synthesis underscores that successful validation rests on multiple pillars: establishing a sound theoretical factor structure, demonstrating strong reliability and invariance across populations, and proactively addressing pitfalls like cultural bias and low test-retest reliability. The move towards digital, remotely administered scales presents new opportunities for scalability but also introduces fresh challenges in usability and standardization that must be meticulously managed. Future efforts must focus on developing and adopting harmonized instruments that meet stringent psychometric criteria across diverse global populations. For researchers, this means that investing in thorough validation is not just about choosing a tool—it is about ensuring that the conclusions drawn from clinical trials and scientific studies about cognitive health and intervention efficacy are built on a bedrock of solid, unambiguous measurement.
References
- 1. Executive functioning and processing speed as predictors of ... [https://pmc.ncbi.nlm.nih.gov/articles/PMC12332253/]
- 2. Executive Functioning Index R4Alz-pc Predicts Memory ... [https://pmc.ncbi.nlm.nih.gov/articles/PMC12427962/]
- 3. of the Bayley II Mental Developmental Index and the... Comparison [https://pmc.ncbi.nlm.nih.gov/articles/PMC3560971/]
- 4. The Development and Validation of the Assessment of Size ... [https://link.springer.com/article/10.1007/s11165-025-10274-w]
- 5. Validation of the Cognition Scale of the Hong Kong ... [https://pmc.ncbi.nlm.nih.gov/articles/PMC12523632/]
- 6. The 8-Factor reasoning styles scale [https://pmc.ncbi.nlm.nih.gov/articles/PMC12362910/]
- 7. Compassion Scale: factor structure and scale validation in ... [https://www.frontiersin.org/journals/psychology/articles/10.3389/fpsyg.2025.1508402/full]
- 8. A Critical Analysis of the Usage of Dimensionality ... [https://arxiv.org/html/2503.08836v2]
- 9. Comparison of dimensionality reduction techniques for the ... [https://www.sciencedirect.com/science/article/pii/S2949747724000137]
- 10. Development and validation of the digital mindset scale [https://www.sciencedirect.com/science/article/pii/S0148296325003777]
- 11. Development of an Instrument to Measure Resilience ... [https://www.jmir.org/2025/1/e72449]
- 12. Psychometric Properties of a Test: A Comprehensive Guide [https://xobin.com/blog/psychometric-properties-of-a-test/]
- 13. Psychometric Test Guide: Understanding and Applying in ... [https://www.blueprint.ai/blog/psychometric-test-guide-understanding-and-applying-in-mental-health-therapy]
- 14. Test results with and without blueprinting: Psychometric ... [https://www.elsevier.es/es-revista-educacion-medica-71-articulo-test-results-with-without-blueprinting-S1575181323000128]
- 15. Development and Psychometric Properties of a Scale to ... [https://pmc.ncbi.nlm.nih.gov/articles/PMC12468523/]
- 16. Psychometric properties and validation of the critical ... [https://www.sciencedirect.com/science/article/pii/S019188692500306X]
- 17. Psychometric properties of screening tools for mild cognitive ... [https://pmc.ncbi.nlm.nih.gov/articles/PMC12128237/]
- 18. methods for developing content-valid student examinations [https://pubmed.ncbi.nlm.nih.gov/12893554/]
- 19. Development and validation of large language model ... [https://www.nature.com/articles/s41598-025-14923-y]
- 20. Clinical Research Trends to Expect in 2025: More Complex ... [https://acrpnet.org/2025/03/05/clinical-research-trends-to-expect-in-2025-more-complex-less-connected]
- 21. Making Clinical Data Acquisition Standards ... - PubMed [https://pubmed.ncbi.nlm.nih.gov/38655429/]
- 22. Clinical Research in 2025: Key Shifts, Challenges, and ... [https://blog.cloudbyz.com/resources/clinical-research-in-2025-key-shifts-challenges-and-whats-next]
- 23. Data Standards Harmonization [https://www.appliedclinicaltrialsonline.com/view/data-standards-harmonization]
- 24. Best Practices for Developing and Validating Scales ... [https://pmc.ncbi.nlm.nih.gov/articles/PMC6004510/]
- 25. best practice guidelines for their development and validation [https://www.frontiersin.org/journals/psychology/articles/10.3389/fpsyg.2024.1494261/full]
- 26. Harmonization of Clinical Data Element Definitions for ... [https://aspe.hhs.gov/harmonization-clinical-data-element-definitions-outcome-measures-registries]
- 27. A Guide to Analyzing Experimental Data [https://towardsdatascience.com/a-guide-to-analyzing-experimental-data-7b05eea7e70c/]
- 28. Criterion validity, construct validity, and factor analysis [https://pmc.ncbi.nlm.nih.gov/articles/PMC12468832/]
- 29. Review of “Fit Indices Are Insensitive to Multiple Minor ... [https://replicationindex.com/2025/02/24/review-of-fit-indices-are-insensitive-to-multiple-minor-violations-of-perfect-simple-structure-in-confirmatory-factor-analysis/]
- 30. Development and validation of a factor analysis ... [https://www.sciencedirect.com/science/article/pii/S2666188825002710]
- 31. The Development and Validation of Measurement Scales ... [https://www.mdpi.com/2076-328X/15/6/743]
- 32. Measuring understandability of intelligent systems: Scale ... [https://www.sciencedirect.com/science/article/abs/pii/S1071581925001491]
- 33. Construct validity, internal consistency and test-retest ... [https://pubmed.ncbi.nlm.nih.gov/41196775/?utm_source=FeedFetcher&utm_medium=rss&utm_campaign=journals&utm_content=101140017&fc=None&ff=20251112020515&v=2.18.0.post22+67771e2]
- 34. A reliability generalization meta-analysis of the internal ... [https://www.sciencedirect.com/science/article/pii/S138994572400594X]
- 35. Comparison of in-person vs. remote administration ... [https://link.springer.com/article/10.1007/s10072-024-07661-y]
- 36. Validity of remote administration of the MATRICS ... [https://www.sciencedirect.com/science/article/pii/S2215001321000330]
- 37. A comparison of high performance on remote vs. in-person ... [https://pmc.ncbi.nlm.nih.gov/articles/PMC12590352/]
- 38. Reliability of remote self-administered digital cognitive ... [https://pmc.ncbi.nlm.nih.gov/articles/PMC12267269/]
- 39. Development and validation of the embodied cognition ... [https://www.frontiersin.org/journals/psychology/articles/10.3389/fpsyg.2025.1682631/full]
- 40. Measurement Invariance Conventions and Reporting [https://pmc.ncbi.nlm.nih.gov/articles/PMC5145197/]
- 41. Measurement Invariance in cross-cultural and comparative ... [https://www.wzb.eu/en/node/49469]
- 42. Cross-Cultural Measurement Invariance in the Personality ... [https://www.sciencedirect.com/science/article/pii/S0165178121004303]
- 43. 语言验证服务如何提升量表信效度? [https://www.chinapharmconsulting.com/cn/hy_zs/54489.html]
- 44. Assessing the validity of the cognitive load scale in a ... [https://www.sciencedirect.com/science/article/pii/S1658361216300087]
- 45. The Measurement of Cognitive Schemas: Validation of the ... [https://pmc.ncbi.nlm.nih.gov/articles/PMC5731789/]
- 46. The reliability paradox: Why robust cognitive tasks do not ... [https://pmc.ncbi.nlm.nih.gov/articles/PMC5990556/]
- 47. Clarifying the reliability paradox: poor measurement ... [https://www.frontiersin.org/journals/psychology/articles/10.3389/fpsyg.2025.1592658/full]
- 48. Improving the reliability of cognitive task measures [https://pmc.ncbi.nlm.nih.gov/articles/PMC10440239/]
- 49. How measurement noise limits the accuracy of brain- ... [https://www.nature.com/articles/s41467-024-54022-6]
- 50. Signal-to-Noise Ratio in PVT Performance as a Cognitive ... [https://pmc.ncbi.nlm.nih.gov/articles/PMC5806545/]
- 51. Calibration of cognitive tests to address the reliability ... [https://www.nature.com/articles/s41467-023-37777-2]
- 52. A measure of reliability convergence to select and optimize ... [https://pmc.ncbi.nlm.nih.gov/articles/PMC11332135/]
- 53. Investigating construct validity of cognitive load ... [https://link.springer.com/article/10.1007/s11251-024-09692-6]
- 54. Differences in the measurement of cognition ... [https://pmc.ncbi.nlm.nih.gov/articles/PMC9891734/]
- 55. Comparing Two Subjective Rating Scales Assessing ... [https://www.frontiersin.org/journals/education/articles/10.3389/feduc.2021.705551/full]
- 56. A scoping review of cognitive load assessment tools suitable ... [https://pmc.ncbi.nlm.nih.gov/articles/PMC12239420/]
- 57. Cognitive load scale for AI-assisted L2 writing [https://www.frontiersin.org/journals/psychology/articles/10.3389/fpsyg.2025.1666974/full]
- 58. Cognitive load assessment through EEG: A dataset from ... [https://www.sciencedirect.com/science/article/pii/S2352340925002094]
- 59. Cognitive efficiency: A conceptual and methodological ... [https://www.sciencedirect.com/science/article/abs/pii/S095947521100079X]
- 60. Testing for approximate measurement invariance of ... [https://www.nature.com/articles/s41599-025-04870-4]
- 61. The Cultural Equivalence of Measurement in Substance ... [https://pmc.ncbi.nlm.nih.gov/articles/PMC8511178/]
- 62. Measurement invariance and differential item functioning of ... [https://www.frontiersin.org/journals/psychology/articles/10.3389/fpsyg.2025.1635726/full]
- 63. Cognitive Assessment Test: Validation of a Short ... [https://pmc.ncbi.nlm.nih.gov/articles/PMC6051079/]
- 64. Validity and usability for digital cognitive assessment tools to ... [https://jneuroengrehab.biomedcentral.com/articles/10.1186/s12984-025-01665-1]
- 65. Practice effects on digital cognitive assessment tools [https://pmc.ncbi.nlm.nih.gov/articles/PMC12412751/]
- 66. Comparative analysis of five diagnostic tools in detecting mild ... [https://mecp.springeropen.com/articles/10.1186/s43045-025-00534-w]
- 67. Accuracy of the Mini-Mental State Examination and ... [https://pmc.ncbi.nlm.nih.gov/articles/PMC12452453/]
- 68. Optimal cut-off scores for the Mini Mental State ... [https://www.sciencedirect.com/science/article/abs/pii/S1353802025007151]
- 69. Testing the Clinical Dementia Rating Sum of Boxes as an ... [https://pubmed.ncbi.nlm.nih.gov/40971142/]
- 70. The Cognitive Dementia Rating Scale: The future is coming [https://www.dementiaresearcher.nihr.ac.uk/blog-the-cognitive-dementia-rating-cdr-scale-the-future-is-coming/]
- 71. The Updated MCI Screener: More Approachable Tasks, ... [https://creyos.com/blog/the-updated-mci-screener]
- 72. Measurement invariance [https://en.wikipedia.org/wiki/Measurement_invariance]
- 73. Chapter 3 Measurement Invariance | Testing for ... [https://bookdown.org/content/5737/invariance.html]
- 74. Measurement invariance of a general cognitive performance ... [https://pmc.ncbi.nlm.nih.gov/articles/PMC12307830/]
- 75. Reliability and cross-country equivalence of the 8-item ... [https://www.sciencedirect.com/science/article/pii/S2666776223000789]
- 76. Conducting cross-cultural, multi-lingual or multi-country ... [https://pmc.ncbi.nlm.nih.gov/articles/PMC11257704/]
- 77. The Rapid Online Cognitive Assessment for the Detection ... [https://www.jmir.org/2025/1/e66735]
- 78. A scoping review of remote and unsupervised digital ... [https://www.nature.com/articles/s41746-025-01583-5]
- 79. Validity and usability for digital cognitive assessment tools ... [https://pmc.ncbi.nlm.nih.gov/articles/PMC12153127/]
- 80. Test–Retest Reliability & Concurrent Validity Compared to ... [https://braincheck.com/articles/resource/validation-of-braincheck-digital-cognitive-assessments-bc-assess-test-retest-reliability-concurrent-validity-compared-to-traditional-paper-based-tests/]
- 81. Optimizing mobile cognitive assessment reduces ... [https://www.nature.com/articles/s41598-025-14130-9]
- 82. The relationship between brain injury criteria and ... [https://pmc.ncbi.nlm.nih.gov/articles/PMC8169213/]
- 83. Impaired visual working memory and reduced connectivity ... [https://www.nature.com/articles/s41598-021-80995-1]
- 84. Development and expert validation of the Cognitive Load ... [https://pubmed.ncbi.nlm.nih.gov/40495378/]
- 85. Reliability of remote self-administered digital cognitive ... [https://www.frontiersin.org/journals/digital-health/articles/10.3389/fdgth.2025.1571053/full]