fMRI vs. EEG vs. fNIRS: A Comprehensive Neuroimaging Comparison for Design Neurocognition Research
This article provides a systematic comparison of three pivotal neuroimaging techniques—functional magnetic resonance imaging (fNIRS), electroencephalography (EEG), and functional near-infrared spectroscopy (fNIRS)—for researchers and professionals in design neurocognition and drug...
fMRI vs. EEG vs. fNIRS: A Comprehensive Neuroimaging Comparison for Design Neurocognition Research
Abstract
This article provides a systematic comparison of three pivotal neuroimaging techniques—functional magnetic resonance imaging (fNIRS), electroencephalography (EEG), and functional near-infrared spectroscopy (fNIRS)—for researchers and professionals in design neurocognition and drug development. It explores the foundational principles, measuring electrical activity with EEG and hemodynamic responses with fMRI and fNIRS, and delves into their specific methodological applications in studying cognitive processes relevant to design. The review addresses critical troubleshooting aspects, including cost, portability, and motion artifact tolerance, and offers a direct, evidence-based validation of their spatial and temporal resolution, data quality, and suitability for naturalistic study environments. By synthesizing these dimensions, the article serves as a guide for selecting the optimal modality or multimodal combination to advance research in cognitive neuroscience and clinical translation.
Understanding the Core Principles: What fMRI, EEG, and fNIRS Measure in the Brain
Understanding brain function requires tools that can capture its rapid electrical activity and the slower, metabolic processes that support it. Electrical signals, measured by techniques like electroencephalography (EEG), provide a direct, millisecond-scale view of neural firing. In contrast, hemodynamic signals, measured by functional magnetic resonance imaging (fMRI) or functional near-infrared spectroscopy (fNIRS), reflect indirect, metabolic correlates of brain activity through changes in blood oxygenation and flow [1]. This fundamental difference—direct neural activity versus metabolic proxies—defines the capabilities and limitations of each class of imaging technology. For researchers in neurocognition and drug development, selecting the appropriate tool is paramount. This guide provides a structured, evidence-based comparison of fMRI, EEG, and fNIRS to inform your experimental design, framed within the broader context of investigating the brain's structure-function relationships [2].
Fundamental Differences in Signal Origin and Physiology
The core distinction between these signals lies in their physiological origins and the principles of neurovascular coupling.
Electrical Signals: The Direct Measure of Neural Activity
EEG captures the electrical potentials generated by the synchronized activity of large groups of neurons, primarily the postsynaptic potentials of pyramidal cells aligned perpendicular to the scalp [1]. This signal is a direct correlate of neural firing, offering an unmediated view of brain communication and computation.
Hemodynamic Signals: The Metabolic Correlates
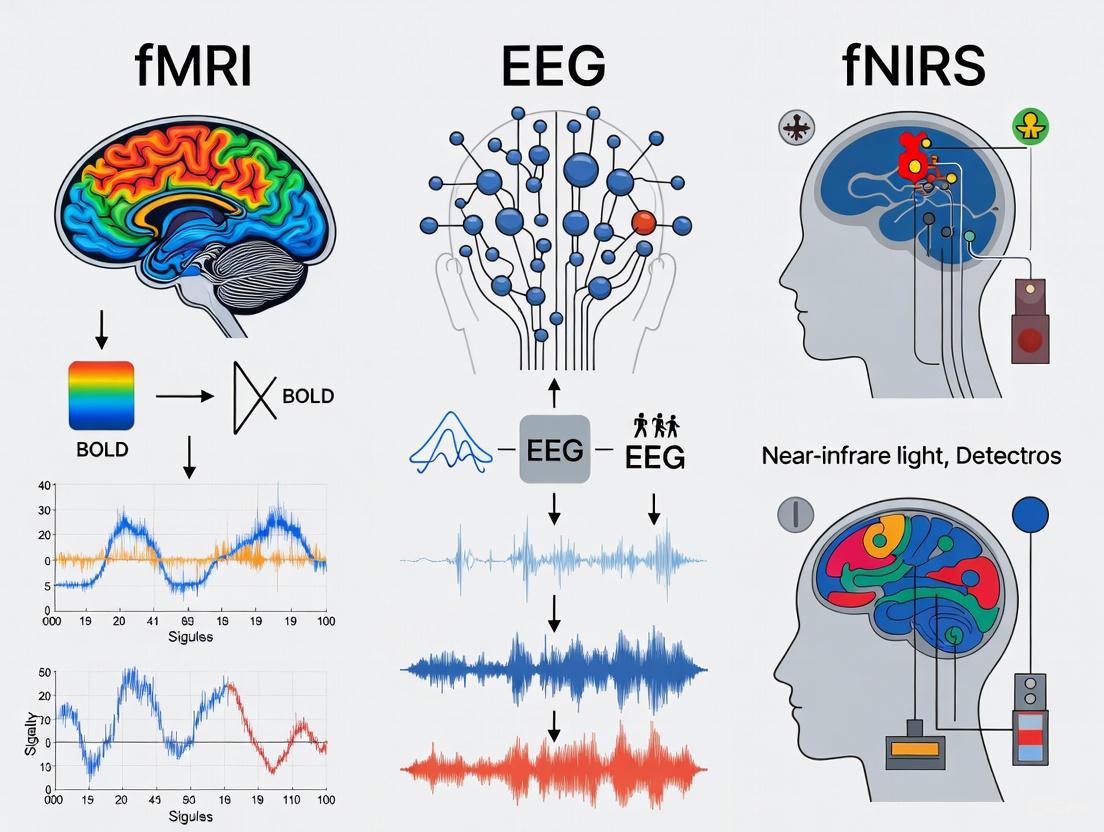
Hemodynamic signals are an indirect measure of neural activity, reliant on neurovascular coupling—the process by which neural activity triggers changes in local blood flow and oxygenation [3] [4]. Techniques like fMRI and fNIRS measure these hemodynamic changes. fMRI typically detects the Blood-Oxygen-Level-Dependent (BOLD) signal, which reflects the balance of oxygenated and deoxygenated hemoglobin [5]. fNIRS directly measures concentration changes in both oxygenated (HbO) and deoxygenated hemoglobin (HbR) using near-infrared light [3] [1]. The hemodynamic response lags behind the initiating neural activity by 2 to 6 seconds, representing a slow, metabolic consequence of neuronal firing rather than the firing itself [5] [1].
The diagram below illustrates this fundamental relationship and measurement approach.
Technical Specifications and Performance Comparison
The physiological differences between electrical and hemodynamic signals directly translate into distinct performance profiles for the neuroimaging modalities that measure them. The table below provides a quantitative and qualitative comparison of fMRI, fNIRS, and EEG.
Table 1: Technical Specification and Performance Comparison of fMRI, fNIRS, and EEG
| Feature | fMRI | fNIRS | EEG |
|---|---|---|---|
| What It Measures | Blood-Oxygen-Level Dependent (BOLD) signal [5] | Concentration changes in HbO and HbR [3] [1] | Electrical potentials from cortical neurons [1] |
| Signal Source | Hemodynamic response (indirect) [5] | Hemodynamic response (indirect) [1] | Postsynaptic potentials (direct) [1] |
| Temporal Resolution | Low (0.33 - 2 Hz, ~seconds) [5] | Low (~0.1 - 10 Hz, ~seconds) [5] [2] | Very High (milliseconds) [1] |
| Spatial Resolution | High (millimeter-level) [5] | Moderate (centimeter-level) [5] [1] | Low (centimeter-level) [1] |
| Depth of Measurement | Whole brain (cortical & subcortical) [5] | Superficial cortex (1-2.5 cm) [5] [1] | Cortical surface [1] |
| Portability | Low (immobile scanner) [5] | High (wearable systems) [5] [1] | High (wearable systems) [1] |
| Tolerance to Motion Artifacts | Low [5] | Moderate/High [1] | Low [1] |
| Best Use Cases | Spatial localization of deep brain activity, network connectivity [5] | Naturalistic studies, child development, bedside monitoring [5] [1] | Fast cognitive tasks, ERPs, sleep studies, brain-state monitoring [1] |
Experimental Protocols and Methodologies
Robust experimental design is crucial for valid data interpretation. Below are detailed methodologies from key studies that have successfully employed these modalities, either individually or in a multimodal setup.
A Unimodal fNIRS-EEG Protocol: Visual Evoked Responses
A study investigating the correlation between electrical and hemodynamic responses during visual stimulation provides a clear protocol for parallel measurement [3].
- Participants & Stimuli: Thirteen healthy volunteers viewed full-field windmill checkerboard patterns reversing at 4 Hz. The stimulus contrast was graded (100%, 10%, 1%) to probe different levels of neural response [3].
- Protocol Design: The session began with a 30-second baseline, followed by seven blocks. Each block consisted of a 25-second stimulation period and a 30-second rest period. The order of contrasts was randomized [3].
- EEG Data Acquisition & Analysis: VEPs were recorded using a 64-channel system. Data processing involved down-sampling to 1000 Hz, band-pass filtering (1-100 Hz), ocular correction via ICA, and segmentation into epochs from -50 ms to +200 ms around stimulus onset. Epochs with artifacts (> ±50 µV) were rejected before averaging [3].
- fNIRS Data Acquisition & Analysis: Hemodynamic responses were recorded with a system placing optodes over the visual cortex. Data was converted to HbO and HbR concentrations using the modified Beer-Lambert Law and then band-pass filtered (0.01-0.1 Hz) to remove physiological noise [3].
A Multimodal Protocol: Motor Execution, Observation, and Imagery
A 2023 study showcases a sophisticated simultaneous fNIRS-EEG protocol to investigate shared neural networks, highlighting the power of multimodal integration [6].
- Participants & Paradigm: Sixty healthy adults participated in a live-action paradigm involving Motor Execution (ME), Motor Observation (MO), and Motor Imagery (MI) of a cup-moving task, while being seated face-to-face with an experimenter [6].
- Simultaneous Recording: A 24-channel fNIRS system (Hitachi ETG-4100) was embedded within a 128-electrode EEG cap (Electrical Geodesics, Inc.). The fNIRS probe was placed over sensorimotor and parietal cortices. Optode positions were digitized for precise co-registration [6].
- Data Fusion Analysis: The study employed a advanced analysis technique called structured sparse multiset Canonical Correlation Analysis (ssmCCA). This method fuses the electrical (EEG) and hemodynamic (fNIRS) data to pinpoint brain regions consistently identified by both modalities, thereby providing a more robust picture of neural activity [6].
The workflow for such a multimodal experiment is complex and requires careful synchronization, as shown below.
Table 2: Research Reagent Solutions for a Multimodal fNIRS-EEG Study
| Item Category | Specific Tool/Software | Function in Research |
|---|---|---|
| Hardware | Integrated fNIRS-EEG Cap [6] [7] | Ensures precise and stable co-registration of fNIRS optodes and EEG electrodes on the scalp. |
| Synchronization System | TTL Pulses / Shared Clock [1] | Aligns the data streams from both modalities to a common timeline for fused analysis. |
| Data Acquisition | Brain Vision Recorder (EEG) [3], TechEn CW6 (fNIRS) [3], Hitachi ETG-4100 (fNIRS) [6] | Software and hardware to record raw, high-fidelity electrical and optical signals. |
| Preprocessing & Analysis | Brain Vision Analyzer (EEG) [3], HOMER2 (fNIRS) [3], MNE-Python [2], ssmCCA [6] | Software toolkits for modality-specific preprocessing (filtering, artifact removal) and advanced multimodal data fusion. |
Complementary Nature and Multimodal Integration
The discrepancies often observed between EEG and fNIRS/fMRI findings are not necessarily errors but reflections of the brain's complex, multi-faceted activity [6]. EEG captures rapid, synchronized electrical oscillations, while fNIRS/fMRI reveals the slower, metabolically demanding hemodynamic processes they drive [4] [2]. Multimodal integration leverages these differences to create a more complete picture.
- Validation and Spatial Refinement: Simultaneous EEG-fMRI has been used to validate fNIRS signals, leveraging fMRI's high spatial resolution to confirm the cortical origins of fNIRS-measured hemodynamics [5].
- Uncovering Complex Brain Dynamics: A 2025 sleep study using simultaneous EEG-PET-MRI demonstrated tightly coupled temporal progression of global electrophysiology, hemodynamics, and metabolism, revealing how these processes interact across different brain states [8].
- Enhanced Brain-Computer Interfaces (BCIs): Combining EEG's rapid response with fNIRS's superior spatial localization has been shown to improve the classification accuracy of brain states in real-time systems [3] [7].
The choice between electrical (EEG) and hemodynamic (fMRI, fNIRS) neuroimaging technologies is not a matter of selecting a superior tool, but of aligning the tool's strengths with the research question. EEG is unparalleled for capturing the high-speed dynamics of neural communication, making it ideal for studying sensory processing, rapid cognitive tasks, and brain states. fMRI provides unparalleled spatial resolution for deep brain structures and network mapping in highly controlled environments. fNIRS offers a powerful balance, providing localized hemodynamic information with the portability necessary for naturalistic studies involving movement, children, or clinical populations.
For the most comprehensive investigations into brain function—particularly in applied neurocognition and drug development research—a multimodal approach that integrates EEG with fNIRS or fMRI is increasingly becoming the gold standard. This strategy successfully bridges the temporal and spatial resolution gap, allowing researchers to delineate both the direct neural activity and its metabolic correlates, and ultimately uncover the principles of brain organization and its alteration in disease states [2].
Electroencephalography (EEG) stands as a cornerstone non-invasive technique for studying human brain function, offering unparalleled temporal resolution to capture neural dynamics on a millisecond scale. The biophysical basis of EEG originates from the electrical activity of populations of cortical neurons, primarily the post-synaptic potentials of pyramidal cells aligned perpendicular to the scalp [1]. When these neurons fire synchronously, their summed electrical currents generate potentials measurable at the scalp surface, creating the oscillatory patterns that characterize EEG recordings.
Understanding what EEG measures—and what it cannot measure—is crucial for interpreting its signals accurately. Computational biophysical modeling has demonstrated that action potentials contribute negligibly to the broadband spectral trend of scalp EEG, which is instead dominated by synaptic currents and their filtering properties [9]. This fundamental understanding of EEG's neural origins provides the foundation for its application in cognitive neuroscience, clinical diagnosis, and the emerging field of design neurocognition, where it complements other neuroimaging modalities with its unique strengths.
Fundamental Principles and Neural Generators
Biophysical Mechanisms of EEG Signal Generation
The electrical signals measured by EEG emerge from the coordinated activity of millions of neurons, with particular emphasis on pyramidal cells in the cerebral cortex. These neurons possess a distinct spatial orientation perpendicular to the cortical surface, allowing their synchronized post-synaptic potentials to summate effectively rather than cancel each other out. When excitatory neurotransmitters bind to post-synaptic receptors, they open ion channels that create current sinks, while inhibitory inputs create current sources. This spatial separation of currents generates a dipole field that propagates through various tissues—including cerebrospinal fluid, skull, and scalp—before being detected by electrodes on the scalp surface [1].
The transmission of these electrical signals through different biological tissues is governed by their conductive properties, with the skull presenting particularly high electrical resistance compared to other tissues. This journey through resistive media significantly attenuates the signal and blurs its spatial origin, explaining EEG's limited spatial resolution. The amplitude of scalp-recorded EEG typically ranges from 10 to 100 microvolts, representing a heavily attenuated version of the original cortical currents, which may be stronger by orders of magnitude at their source.
Action Potentials vs. Synaptic Activity in EEG Generation
A critical distinction in understanding EEG's biophysical basis lies in differentiating the contributions of action potentials versus synaptic activity to the recorded signal. Detailed biophysical simulations have revealed that action potentials generally contribute negligibly to the EEG spectral trend, with the signal instead being dominated by synaptic currents and their filtering properties [9]. This occurs because action potentials are typically too brief and poorly synchronized to generate significant summation at the scalp, whereas synaptic potentials last longer and involve larger dendritic areas, facilitating spatial summation.
However, under specific conditions of high neuronal synchrony, action potentials can generate detectable narrowband power in the high-frequency range (approximately 60-1000 Hz) [9]. This explains why certain high-frequency oscillations can occasionally be observed in EEG recordings, though the majority of the unprocessed EEG signal above 30 Hz reflects muscle activity rather than neural sources [9]. The predominant contribution of synaptic activity to EEG signals validates the technique's sensitivity to integrated network inputs rather than output spiking activity, shaping how researchers interpret EEG findings in relation to underlying neural computation.
Technical Comparison of Neuroimaging Modalities
EEG Versus fNIRS and fMRI: Core Technical Differences
Understanding EEG's capabilities requires direct comparison with other prominent neuroimaging techniques, particularly functional magnetic resonance imaging (fMRI) and functional near-infrared spectroscopy (fNIRS). Each method captures distinct physiological phenomena with unique spatiotemporal characteristics, making them complementary rather than redundant for comprehensive brain imaging.
Table 1: Comparison of Key Technical Specifications for Major Neuroimaging Modalities
| Feature | EEG | fNIRS | fMRI |
|---|---|---|---|
| What it Measures | Electrical activity from synchronized neuronal firing | Hemodynamic response (blood oxygenation) | Blood oxygen level-dependent (BOLD) signal |
| Signal Source | Post-synaptic potentials in cortical pyramidal neurons | Changes in oxygenated and deoxygenated hemoglobin | Magnetic susceptibility of deoxygenated hemoglobin |
| Temporal Resolution | High (milliseconds) | Low (seconds) | Low (seconds) |
| Spatial Resolution | Low (centimeter-level) | Moderate (better than EEG) | High (millimeter-level) |
| Depth of Measurement | Cortical surface | Outer cortex (~1-2.5 cm deep) | Whole brain (cortical and subcortical) |
| Portability | High (wearable systems available) | High | Low (requires fixed scanner) |
| Tolerance to Motion | Low (susceptible to artifacts) | High | Low |
| Best Use Cases | Fast cognitive tasks, ERPs, sleep studies | Naturalistic studies, child development, rehabilitation | Precise spatial localization, deep brain structures |
EEG's paramount advantage lies in its exceptional temporal resolution, capturing neural dynamics at the millisecond scale essential for analyzing rapid cognitive processes like sensory perception, attention, and motor planning [1]. This temporal precision enables researchers to track the rapid sequence of information processing through different neural systems with timing accuracy unmatched by hemodynamic-based methods. However, this strength comes at the cost of spatial resolution, as electrical signals become blurred and attenuated while passing through the skull and scalp [1].
In contrast, fMRI provides excellent spatial resolution (millimeter-level) for localizing brain activity throughout both cortical and subcortical structures, but suffers from limited temporal resolution due to the slow hemodynamic response (typically lagging 4-6 seconds behind neural activity) [10]. fNIRS occupies a middle ground, offering better spatial resolution than EEG for surface cortical areas while maintaining greater tolerance for movement and more naturalistic testing environments than fMRI [1] [11].
Quantitative Experimental Comparisons
Direct comparisons between these modalities reveal their complementary nature. Simultaneous fMRI-EEG recordings have demonstrated a linear relationship between spatial increases in the BOLD signal and increased regional neural activity measured by EEG [11]. However, these signals originate from different physiological processes—EEG measures direct electrical activity while fMRI reflects the metabolic consequences of neural activity through neurovascular coupling.
Similarly, combined fNIRS-EEG studies show that while fNIRS offers better spatial localization for surface cortical areas, EEG provides superior temporal resolution for capturing rapid neural dynamics [1] [12]. The integration of both techniques creates a powerful hybrid approach that compensates for their individual limitations, providing both spatial and temporal information in a single experimental setup [1].
Table 2: Experimental Protocols and Methodological Considerations
| Experimental Aspect | EEG Protocols | fNIRS Protocols | fMRI Protocols |
|---|---|---|---|
| Typical Setup Time | 20-45 minutes (including electrode application) | 10-20 minutes | 30-60 minutes |
| Subject Preparation | Electrode application with conductive gel/gel, scalp abrasion often needed | Optode placement with minimal skin preparation | No direct physical preparation but safety screening |
| Typical Sampling Rate | 250-2000 Hz | 1-100 Hz | 0.3-2 Hz (BOLD signal) |
| Primary Signal Processing | Filtering (0.1-100 Hz), artifact removal, independent component analysis | Filtering, motion correction, conversion to hemoglobin concentrations | Slice timing correction, motion correction, spatial normalization |
| Key Artifacts | Ocular movements, muscle activity, line noise | Scalp blood flow, motion, hair interference | Motion, magnetic susceptibility, physiological noise |
| Environment Constraints | Electrically shielded room preferred but not always required | Controlled lighting preferred | Strict magnetic field control required |
Methodological Approaches in EEG Research
Advanced Signal Processing Techniques
Extracting meaningful neural information from EEG signals requires sophisticated processing approaches to overcome the technique's limitations regarding spatial resolution and signal-to-noise ratio. Spatial filtering methods represent some of the most powerful tools in this domain, with constrained independent component analysis (cICA) demonstrating particular efficacy for detecting movement-related cortical potentials (MRCPs) during motor execution and imagery tasks [13].
In one detailed study comparing spatial filters for MRCP detection, cICA achieved significantly lower latencies (-34 ± 29 ms for motor execution and 28 ± 16 ms for motor imagery) and higher true positive rates (87.11 ± 11.73 for motor execution and 86.66 ± 6.96 for motor imagery) compared to other methods like Common Spatial Pattern and Laplacian filtering [13]. The experimental protocol for this investigation involved:
- Participants: 24 healthy adults (7 female, 17 male, 27 ± 4 years)
- Task: Ankle dorsiflexion (actual and imagined) with visual cues
- EEG Recording: 10 electrodes at standard 10-20 positions, 500 Hz sampling rate
- Data Processing: Non-causal bandpass filtering (0.05-3 Hz) using zero-phase second-order Butterworth filter
- Analysis: cICA extraction of desired sources using reference signals without manual intervention
This methodological approach demonstrates how advanced signal processing can enhance EEG's utility for detecting specific neural patterns, even those with relatively low signal-to-noise characteristics like MRCPs.
Experimental Considerations for Design Neurocognition
In design neurocognition research, EEG paradigms have successfully differentiated cognitive processes relevant to design thinking. Studies have shown that higher alpha-band activity over temporal and occipital regions distinguishes between open-ended versus close-ended problem descriptions during design problem-solving in expert designers [14]. Similarly, EEG components have served as reliable indicators of effort, fatigue, and concentration during conceptual design tasks [14].
The experimental setup for design neurocognition studies typically involves:
- Task Design: Ecologically valid design problems presented visually or verbally
- Recording Parameters: Dense-array EEG systems (64-128 channels) for improved spatial sampling
- Protocol: Mixed design incorporating both structured tasks and open-ended design challenges
- Complementary Data: Video recording, protocol analysis, and behavioral metrics synchronized with EEG
- Analysis Focus: Event-related potentials, time-frequency decomposition, and functional connectivity
These methodologies enable researchers to capture the temporal dynamics of design thinking, revealing how different cognitive processes unfold over millisecond to minute timescales during complex design activities.
The Researcher's Toolkit: Essential Methodologies
Key Research Reagent Solutions
Table 3: Essential Equipment and Analytical Tools for EEG Research
| Tool Category | Specific Examples | Function and Application |
|---|---|---|
| EEG Systems | High-density EEG caps (64-256 channels), wearable EEG systems | Signal acquisition with varying spatial resolution and mobility |
| Amplifiers | Biosemi ActiveTwo, BrainAmp, Neuroscan NuAmps | Signal amplification and digitization with high dynamic range |
| Electrodes | Ag/AgCl electrodes, sintered silver ring electrodes, active electrodes | Signal transduction with optimized skin contact and stability |
| Conductive Media | Electrolyte gels, saline solutions, electrode pastes | Maintaining stable electrical contact between scalp and electrodes |
| Stimulation Equipment | Visual and auditory stimulators, response pads | Presenting experimental paradigms and collecting behavioral data |
| Analysis Software | EEGLAB, FieldTrip, Brainstorm, MNE-Python | Signal processing, artifact removal, and statistical analysis |
| Spatial Filtering Algorithms | Constrained ICA, Common Spatial Patterns, Laplacian filters | Enhancing signal-to-noise ratio and source separation |
Visualization of EEG Signal Generation and Processing
The following diagram illustrates the biophysical basis of EEG signal generation and the subsequent processing pipeline:
Integrated Applications in Design Neurocognition
The emerging field of design neurocognition leverages multiple neuroimaging techniques to understand the neural basis of design thinking, with EEG playing a crucial role in capturing its temporal dynamics. Studies have demonstrated that EEG patterns can distinguish between different cognitive processes in design, differentiate expert designers based on their specialization, and track changes in cognitive states during extended design sessions [14].
The combination of EEG with fNIRS is particularly promising for design neurocognition research, as it enables researchers to capture both the rapid temporal dynamics of design cognition (via EEG) and the localized cortical activation patterns (via fNIRS) during ecologically valid design tasks [14]. This multimodal approach overcomes the limitations of individual techniques, providing a more comprehensive picture of how the brain supports complex design thinking in real-world contexts.
Future methodological advances in EEG technology, including improved artifact removal algorithms, more sophisticated source localization techniques, and enhanced integration with other neuroimaging modalities, will further strengthen its utility for design neurocognition research. These developments will enable more detailed investigations into the neural processes underlying creativity, problem-solving, and innovation—ultimately contributing to improved design education and practice.
EEG provides cognitive neuroscientists with a powerful tool for capturing millisecond-scale electrical potentials generated primarily by synchronized post-synaptic activity in cortical pyramidal cells. While limited in spatial resolution, its exceptional temporal resolution makes it ideally suited for studying the rapid neural dynamics underlying design thinking and other higher cognitive functions. When combined with complementary techniques like fNIRS and fMRI in multimodal frameworks, EEG enables researchers to overcome the limitations of individual modalities, providing both temporal and spatial information about brain function. This integrated approach holds particular promise for advancing design neurocognition research, offering new insights into the neural basis of design thinking while providing a foundation for enhancing design education and practice through neuroscience-informed approaches.
Functional Magnetic Resonance Imaging (fMRI), particularly through the Blood Oxygenation Level Dependent (BOLD) contrast, has revolutionized non-invasive brain mapping by allowing researchers to visualize neural activity with exceptional spatial detail. The physical principles of MRI are based on nuclear magnetic resonance theory, where hydrogen protons in a magnetic field align and process at frequencies proportional to field strength when exposed to radiofrequency pulses [15]. This technical foundation enables fMRI to detect subtle hemodynamic changes associated with brain activity, making it a cornerstone of modern cognitive neuroscience. While fMRI provides excellent spatial resolution, other prominent techniques like electroencephalography (EEG) and functional near-infrared spectroscopy (fNIRS) offer complementary strengths in temporal resolution and practical applicability.
The BOLD signal specifically originates from magnetic susceptibility differences between oxygenated and deoxygenated blood [15]. Deoxygenated hemoglobin is paramagnetic and creates magnetic field inhomogeneities that reduce MR signal intensity, while oxygenated hemoglobin is diamagnetic and increases signal intensity [15]. When neural activity increases in a brain region, the resultant metabolic demands trigger a complex hemodynamic response where blood flow delivery exceeds oxygen consumption, leading to a net decrease in deoxygenated hemoglobin and a corresponding increase in the BOLD signal [15]. This neurovascular coupling forms the fundamental basis of BOLD fMRI and enables the high-resolution mapping of brain function, though it inherently limits temporal resolution due to the slow hemodynamic response.
Technical Comparison of fMRI, EEG, and fNIRS
Table 1: Technical specifications and performance characteristics of major neuroimaging modalities
| Specification | fMRI | EEG | fNIRS |
|---|---|---|---|
| Spatial Resolution | 0.3 mm voxels (ultra-high field) [16] to 2-3 mm (standard) [17] | 5-9 cm [18] | 2-3 cm [18] |
| Temporal Resolution | 0.33-2 Hz (limited by hemodynamic response) [10] | >1000 Hz [18] | ≤10 Hz [18] |
| Penetration Depth | Whole head, including subcortical structures [10] | Brain cortex (EEG), deep structures (MEG) [18] | Superficial cortex only (limited by light penetration) [10] |
| Portability | None (requires fixed scanner) [18] | Yes (portable systems available) [18] | Yes (portable systems available) [18] |
| Cost | High [18] | Low (EEG), High (MEG) [18] | Low [18] |
| Tolerance to Motion | Limited [15] | Limited [18] | Very good [18] |
| Primary Signal Source | Hemodynamic (BOLD contrast) [15] | Electrical activity (postsynaptic potentials) [2] | Hemodynamic (HbO/HbR concentration changes) [15] |
Each modality offers distinct advantages depending on research requirements. fMRI provides unparalleled spatial resolution for deep brain structures, with ultra-high field systems (7T and above) enabling sub-millimeter resolution suitable for cortical layer analysis [19] [16]. EEG captures neural electrical activity directly with millisecond temporal precision, ideal for tracking rapid neural dynamics [18]. fNIRS represents a middle ground, measuring hemodynamic responses like fMRI but with better motion tolerance and portability, though limited to superficial cortical regions [15] [10].
Table 2: Functional characteristics and optimal applications for each neuroimaging modality
| Characteristic | fMRI | EEG | fNIRS |
|---|---|---|---|
| Primary Strengths | High spatial resolution, whole-brain coverage, detailed localization [15] | Excellent temporal resolution, direct neural activity measurement, low cost [18] | Good motion tolerance, portable, silent operation [15] [18] |
| Key Limitations | Expensive, sensitive to motion, noisy environment, limited temporal resolution [15] | Poor spatial resolution, sensitive to artifacts, limited to cortical surface for EEG [18] | Limited to superficial cortex, lower spatial resolution than fMRI [10] |
| Optimal Research Applications | High-precision spatial mapping, subcortical studies, layer-specific fMRI [19] [16] | Temporal dynamics, cognitive processing speed, clinical monitoring [18] [2] | Naturalistic settings, pediatric populations, rehabilitation studies [15] [10] |
| Hemodynamic Specificity | High (BOLD signal with vascular contributions) [16] | None (measures electrical activity) | High (direct HbO/HbR measurement) [15] |
High-Resolution fMRI: Technical Considerations and Methodological Advances
Ultra-High Field fMRI and Cortical Layer Imaging
Pushing fMRI to its spatial resolution limits requires addressing numerous technical challenges, particularly at ultra-high magnetic field strengths (7T and above). At 9.4T, researchers face significant obstacles including B1+ and B0 inhomogeneities that limit efficient blood tagging, specific absorption rate (SAR) constraints that restrict RF pulse application, short T2* values that necessitate brief readout durations, and long T1 values that can cause blood-inflow contaminations [19]. These challenges become particularly pronounced when attempting layer-dependent fMRI, which aims to resolve activity across cortical layers with thicknesses typically between 0.2 mm and 1 mm [19].
Advanced methodological approaches have been developed to overcome these limitations. These include temporally alternating pTx B1+ shimming parameters to address B1+ inhomogeneities, advanced adiabatic RF pulses to improve inversion efficiency within SAR constraints, 3D-EPI signal readout to accommodate short T2* values at 9.4T, optimized GRAPPA acquisition and reconstruction for accelerated imaging, and stability-optimized RF channel combination schemes [19]. The motor cortex has served as an important model system for developing high-resolution fMRI due to its consistent folding pattern, susceptibility to blood inflow effects, and unique double-layer structure of input and output layers [19].
Cerebral Blood Volume fMRI as a High-Specificity Alternative
While BOLD fMRI is widely used, its specificity is compromised by venous drainage effects, where activated signals can be detected in draining veins distant from the actual neural activity site [19]. Cerebral Blood Volume (CBV) imaging using Vascular Space Occupancy (VASO) techniques provides higher localization specificity for mapping cortical layers and columns [19]. VASO measures CBV changes through selective detection of signal changes in the extravascular compartment while nulling the intravascular blood compartment using inversion recovery timing based on T1 differences between blood and tissue [19].
The combination of CBV-fMRI with ultra-high field systems creates a powerful tool for investigating human cortical microcircuitry, potentially bridging gaps between preclinical animal research and clinical psychology [19]. This approach is particularly valuable for testing theories of psychiatric and neurological diseases as disorders of neural circuits [19]. However, VASO methods face their own challenges, including higher noise levels and lower signal-to-noise ratio (SNR) compared to BOLD, especially at ultra-high spatial resolutions [19].
Experimental Protocols for High-Resolution Neuroimaging
Layer-Dependent fMRI Protocol for Motor Cortex Mapping
A representative protocol for layer-dependent CBV-fMRI investigation of the motor cortex at 9.4T involves several critical components [19]:
Participant Preparation and Setup: Participants are scanned using a head gradient set in combination with a 16-channel parallel transmit system and a dual-row 31-channel receive array coil. Online local SAR monitoring is essential for safety compliance.
Functional Task Design: A unilateral finger tapping task (thumb and index finger) is implemented in a block design. Blocks of 80 seconds (40s rest and 40s paced tapping at 0.75Hz) are repeated 12 times, resulting in 16-minute acquisitions. During the task, participants watch a video of a moving hand and mimic the tapping movement.
MR Sequence Parameters: The protocol employs SS-SI VASO with 3D-EPI readout, optimized for 9.4T specific challenges. Key parameters include customized inversion pulses for blood-nulling, accelerated GRAPPA acquisition, and stability-optimized RF channel combination.
Data Analysis: Cortical layer segmentation is performed based on high-resolution anatomical images, with functional data analyzed for layer-specific activation profiles.
Hybrid EEG-fNIRS Protocol for Mental Workload Classification
Multimodal approaches combining EEG and fNIRS have been developed for mental workload classification [18]:
Experimental Paradigm: Participants perform n-back working memory tasks (0-back, 2-back, and 3-back) with randomized presentation. Each task begins with a 2s instruction period, followed by 40s task period (20 trials), 1s stop period, and 20s rest period.
Data Acquisition: Simultaneous recording from 30 EEG electrodes (placed according to international 10-5 system) at 1000Hz sampling rate and 36 fNIRS channels (14 sources and 16 detectors with 30mm inter-optode distance) at 12.5Hz sampling rate using two wavelengths (760nm and 850nm).
Signal Preprocessing:
- fNIRS: Optical density transformation, bandpass filtering (0-0.04Hz), baseline correction, and sensitivity analysis to determine optimal time window (typically 5s).
- EEG: Resampling to 200Hz, improved Weight-Adjusted Second-Order Blind Identification (iWASOBI) for artifact removal.
Feature Extraction:
- fNIRS: Mean, variance, slope, skewness, and kurtosis of HbO and HbR concentrations.
- EEG: Power spectral density in delta (0.5-4Hz), theta (4-7Hz), and alpha (8-15Hz) bands, plus functional brain connectivity features in time and frequency domains.
Classification: Implementation of Support Vector Machine (SVM) and Linear Discriminant Analysis (LDA) classifiers with Common Spatial Pattern (CSP) algorithm for dimensionality reduction, achieving accuracy improvements from 69% to 84.19% for LDA with CSP [18] [20].
Signaling Pathways and Neurovascular Coupling
The relationship between neural activity, metabolic demand, and hemodynamic response forms the foundation of BOLD fMRI. The neurovascular coupling process involves complex signaling pathways between neurons, astrocytes, and vascular components.
Diagram 1: Neurovascular coupling pathway linking neural activity to BOLD signal changes.
The BOLD signal does not directly measure neural activity but reflects the hemodynamic response triggered by neural metabolic demands. When neurons become active, they release glutamate, triggering calcium influx in postsynaptic neurons and astrocytes [16]. This leads to the production of vasoactive signaling molecules including nitric oxide, prostaglandins, and arachidonic acid metabolites that cause vasodilation of arterioles [16]. The resultant cerebral blood flow (CBF) increase delivers oxygenated blood, with the inflow typically exceeding oxygen consumption, leading to a net decrease in deoxyhemoglobin concentration [15] [16]. This increase in HbO relative to HbR reduces the paramagnetic effects of deoxyhemoglobin, thereby increasing the BOLD signal detected in fMRI [15].
Integrated Experimental Workflow for Multimodal Neuroimaging
Combining multiple neuroimaging modalities requires careful experimental design and data integration strategies. The following workflow illustrates a typical multimodal approach:
Diagram 2: Integrated workflow for simultaneous multimodal neuroimaging studies.
The integrated approach begins with comprehensive study design that defines the research questions and determines which modalities provide complementary information [10]. Participant preparation involves positioning and securing various sensors - EEG electrodes, fNIRS optodes, and ensuring participant comfort within the MRI environment [10]. Simultaneous data acquisition requires careful synchronization of timing signals across all modalities to enable later data fusion [10]. Modality-specific preprocessing addresses the unique artifacts and noise sources for each technique - correcting geometric distortions and physiological noise in fMRI, removing motion artifacts and systemic components in fNIRS, and filtering line noise and muscle artifacts in EEG [18]. Feature extraction identifies relevant signal characteristics, such as BOLD amplitude changes, HbO/HbR concentration variations, or spectral power in specific frequency bands [18]. Data fusion integrates these features using various approaches, from simple concatenation to advanced machine learning methods that weight contributions according to signal quality and relevance to the research question [10]. Finally, multimodal analysis extracts insights that would be inaccessible to any single modality alone [10].
The Scientist's Toolkit: Essential Research Reagents and Materials
Table 3: Essential equipment and computational tools for advanced neuroimaging research
| Category | Item | Specification/Function | Representative Use Cases |
|---|---|---|---|
| Imaging Hardware | Ultra-High Field MRI Scanner | 7T-9.4T with high-performance gradients [19] | High-resolution BOLD and CBV fMRI, cortical layer imaging [19] |
| Multi-channel RF Coils | 16-channel transmit/31-channel receive arrays [19] | Improved SNR and parallel imaging capabilities [19] | |
| fNIRS Systems | Portable systems with 760nm and 850nm wavelengths [18] | Naturalistic studies, bedside monitoring, pediatric populations [15] | |
| EEG Systems | High-density caps (30+ channels) with compatible amplifiers [18] | Temporal dynamics of neural processing, brain connectivity [2] | |
| Pulse Sequences | 3D-EPI | Volumetric echo-planar imaging for high spatial resolution [19] | Reduced distortion in high-resolution fMRI [19] |
| SS-SI VASO | Slice-selective inversion vascular space occupancy [19] | Cerebral blood volume mapping with high specificity [19] | |
| ASL (Arterial Spin Labeling) | Magnetic labeling of arterial blood for perfusion imaging [16] | Quantitative cerebral blood flow measurement [16] | |
| Computational Tools | GRAPPA Reconstruction | GeneRalized Autocalibrating Partial Parallel Acquisition [19] | Accelerated image acquisition with improved SNR [19] |
| PCA Denoising | Principal Component Analysis for physiological noise removal [18] | Removal of systemic artifacts from fNIRS signals [18] | |
| CSP Algorithm | Common Spatial Pattern for dimensionality reduction [20] | Improved classification in EEG and fNIRS studies [20] | |
| GSP Framework | Graph Signal Processing for network analysis [2] | Structure-function relationship mapping [2] |
The choice between fMRI, EEG, and fNIRS depends fundamentally on the specific research questions, target brain regions, and practical constraints. fMRI with BOLD contrast remains the gold standard for non-invasive mapping of brain function with high spatial resolution, particularly valuable for studying subcortical structures and fine-grained cortical organization [15] [16]. The development of ultra-high field systems and advanced CBV techniques like VASO further enhances its specificity for investigating cortical layers and microcircuits [19]. EEG provides unparalleled temporal resolution for capturing neural dynamics at the millisecond scale, making it ideal for studying the timing of cognitive processes and functional brain connectivity [18] [2]. fNIRS offers a practical compromise with better motion tolerance and portability than fMRI, enabling brain imaging in more naturalistic settings and with populations challenging to study in traditional scanners [15] [10].
The future of neuroimaging lies not in identifying a single superior modality but in strategically combining complementary techniques. Simultaneous EEG-fMRI provides both high temporal and spatial resolution [2], while integrated fMRI-fNIRS approaches enable the validation of fNIRS signals against the established gold standard of BOLD fMRI [10]. As computational methods advance, particularly in machine learning and multimodal data fusion, researchers will increasingly extract insights that transcend the limitations of any single technique, ultimately providing a more comprehensive understanding of human brain function in health and disease.
Functional near-infrared spectroscopy (fNIRS) represents a rapidly advancing neuroimaging technology that utilizes near-infrared light to non-invasively monitor cerebral hemodynamics associated with neural activity. As a portable and flexible alternative to traditional neuroimaging methods, fNIRS has carved out a significant niche in neuroscience research, particularly for studying cortical brain function in naturalistic settings and with populations that challenge the limitations of other modalities. The fundamental principle underlying fNIRS stems from the discovery that biological tissues exhibit relative transparency to light in the near-infrared spectrum (650-950 nm), creating an "optical window" through which researchers can probe cortical activity [21] [22]. This optical property, combined with the differential absorption characteristics of oxygenated and deoxygenated hemoglobin, enables fNIRS to track the hemodynamic responses that accompany neuronal activation through neurovascular coupling mechanisms [23] [15].
The growing importance of fNIRS in neuroscience coincides with increasing recognition that no single neuroimaging modality can fully capture the brain's complexity. Consequently, multimodal approaches that integrate complementary techniques have gained prominence, with fNIRS serving as a bridge between the high temporal resolution of electroencephalography (EEG) and the superior spatial resolution of functional magnetic resonance imaging (fMRI) [10] [23]. This review systematically examines the technical foundations of fNIRS, its comparative advantages and limitations relative to fMRI and EEG, experimental protocols for its application, and emerging trends that combine these modalities to advance our understanding of brain function in diverse contexts, from laboratory settings to real-world environments.
Technical Foundations of fNIRS
Fundamental Physical Principles
The operational principle of fNIRS relies on the transmission and absorption of near-infrared light as it passes through biological tissues. When neurons become active, they trigger a hemodynamic response that increases cerebral blood flow to the region, altering the local concentrations of oxygenated hemoglobin (HbO) and deoxygenated hemoglobin (HbR). These hemoglobin species possess distinct absorption spectra in the near-infrared range, with HbR absorbing more light at wavelengths below approximately 810 nm (the isosbestic point) and HbO absorbing more light above this point [21] [24]. By emitting light at multiple wavelengths (typically 2-4 wavelengths between 650-950 nm) and measuring its attenuation after passing through the scalp, skull, and brain tissue, fNIRS can quantify changes in HbO and HbR concentrations using a modified version of the Beer-Lambert Law [21] [23].
The modified Beer-Lambert law describes the relationship between light attenuation and chromophore concentration as:
OD = log₁₀(I₀/I) = ε·[X]·l·DPF + G
Where OD represents optical density, I₀ and I are incident and detected light intensities respectively, ε is the extinction coefficient of the chromophore, [X] is chromophore concentration, l is the distance between source and detector, DPF is the differential pathlength factor accounting for light scattering in tissue, and G is a geometry-dependent factor [21]. Using a dual-wavelength system, changes in HbO and HbR concentrations can be solved from the matrix equation derived from differential absorption measurements.
fNIRS Measurement Configurations
fNIRS systems employ different technological approaches to measure hemodynamic responses, each with distinct advantages and limitations:
- Continuous Wave (CW) Systems: These most common fNIRS systems use light sources with constant intensity and frequency. They measure light attenuation but cannot directly determine absolute photon pathlength, providing only relative changes in hemoglobin concentration. Their advantages include simplicity, cost-effectiveness, and high temporal resolution, making them suitable for many research and clinical applications [21].
- Frequency Domain (FD) Systems: FD systems utilize amplitude-modulated light sources (typically near 100 MHz) and measure both light attenuation and phase shift. This approach enables direct measurement of absorption and scattering coefficients, allowing for absolute quantification of hemoglobin concentrations without requiring separate pathlength information [21].
- Time Domain (TD) Systems: These systems introduce short pulses of light (picosecond range) and measure the temporal distribution of photons as they exit the tissue. This "time-of-flight" measurement provides the most detailed information about tissue optical properties and can distinguish between absorption and scattering changes while offering depth resolution [21].
In typical fNIRS configurations, light emitter and detector optodes are placed ipsilaterally on the scalp surface, with recorded measurements resulting from back-scattered light following elliptical pathways through cortical tissues. The penetration depth of near-infrared light is approximately 1-3 cm beneath the scalp, limiting fNIRS sensitivity primarily to superficial cortical regions [21] [22]. Spatial resolution depends on the source-detector separation distance, generally ranging from 1-3 cm, with greater separation providing deeper penetration but reduced spatial resolution due to increased light scattering [10] [24].
Comparative Analysis of Neuroimaging Modalities
Technical Specifications and Performance Metrics
fNIRS, fMRI, and EEG each offer distinct advantages and limitations for neuroimaging research. The table below provides a systematic comparison of their key technical characteristics:
Table 1: Comparative Technical Specifications of Major Neuroimaging Modalities
| Parameter | fNIRS | fMRI | EEG |
|---|---|---|---|
| Spatial Resolution | Moderate (1-3 cm) [24] | High (mm to sub-mm) [10] [24] | Low (source localization challenges) [25] [24] |
| Temporal Resolution | Moderate (0.1-10 Hz) [24] | Slow (seconds) [10] [24] | Very high (millisecond range) [25] [24] |
| Portability | High [26] [15] | Low [26] [15] | Moderate to high [25] |
| Motion Tolerance | High [26] [24] | Low [26] [24] | Moderate [25] [24] |
| Depth Sensitivity | Superficial cortex (1-3 cm) [10] [22] | Whole brain [10] [15] | Cortical surface, limited to deeper structures [25] |
| Measurement Type | Hemodynamic (indirect) [21] [23] | Hemodynamic (indirect) [10] [15] | Electrophysiological (direct) [25] [23] |
| Cost | Low to moderate [26] [24] | High [26] [24] | Low [25] |
| Naturalistic Testing | Excellent [26] [15] | Poor [26] [15] | Good [25] |
Complementary Strengths and Limitations
The comparative analysis reveals a compelling pattern of complementary strengths and limitations across the three modalities. fMRI excels in spatial localization throughout the entire brain, including deep structures, making it ideal for precise mapping of neural networks [10] [15]. However, its practical limitations include sensitivity to motion artifacts, requirement for subjects to remain supine and stationary, loud acoustic noise, and limited accessibility due to high costs [26] [15]. These constraints restrict its utility for studying naturalistic behaviors, populations with movement disorders, or children.
EEG provides direct measurement of neural electrical activity with millisecond temporal resolution, capturing rapid neural dynamics associated with sensory processing, cognitive functions, and brain states [25] [23]. Its limitations include poor spatial resolution due to the blurring effect of the skull and scalp on electrical signals, sensitivity to muscle and motion artifacts, and challenges in localizing activity to specific brain regions [25] [23].
fNIRS occupies a unique middle ground, offering better spatial resolution than EEG for cortical regions while providing greater portability and motion tolerance than fMRI [26] [15]. Its relative silence, safety, and compatibility with metal implants further expand its applicability to diverse populations and environments, including bedside monitoring, developmental studies, and rehabilitation settings [26] [24]. However, fNIRS cannot investigate subcortical structures and offers lower spatial resolution compared to fMRI [10] [26].
Experimental Applications and Protocols
Representative Experimental Designs
fNIRS has been successfully employed across diverse experimental paradigms. The table below summarizes key applications and their methodological considerations:
Table 2: Experimental Paradigms Using fNIRS and Multimodal Approaches
| Research Domain | Experimental Task | Measured Signals | Key Findings | Citation |
|---|---|---|---|---|
| Motor Control | Motor execution, observation, and imagery | fNIRS (HbO, HbR) + EEG | Shared activation in left inferior parietal lobe across conditions; multimodal fusion identified Action Observation Network | [6] |
| Schizophrenia Research | Verbal fluency tasks, working memory | fNIRS (HbO) | Reduced prefrontal HbO signals during cognitive tasks correlated with symptom severity | [24] |
| Vestibular Function | Balance task using Wii Fit ski game | fNIRS (HbO, HbR) | Activation in superior temporal gyrus modulated by task difficulty; demonstrates utility in dynamic tasks | [22] |
| Brain Network Connectivity | Resting state vs. motor imagery | fNIRS + EEG + structural connectivity | Structure-function coupling varies across brain states and follows unimodal-transmodal gradient | [2] |
| Cognitive Neuroscience | Various cognitive tasks in natural settings | fNIRS (HbO, HbR) | Validated fNIRS as reliable alternative to fMRI for cortical measurement during functional tasks | [10] [26] |
Detailed Experimental Protocol: Motor Execution, Observation, and Imagery
A representative multimodal experimental protocol from [6] illustrates the integrated application of fNIRS and EEG. This study investigated the Action Observation Network (AON) during motor execution (ME), motor observation (MO), and motor imagery (MI) using simultaneous fNIRS-EEG recordings.
Participants and Setup:
- Sixty healthy adults participated, with 21 included in final analysis after quality control
- A 24-channel continuous-wave fNIRS system (Hitachi ETG-4100) measuring HbO and HbR at 695 nm and 830 nm wavelengths
- A 128-electrode EEG system (Electrical Geodesics, Inc.) embedded with fNIRS optodes in the same cap
- Optodes positioned over sensorimotor and parietal cortices to cover AON regions
- 3D magnetic digitizer (Fastrak, Polhemus) used to record optode positions relative to anatomical landmarks
Experimental Paradigm:
- Participants sat face-to-face with an experimenter across a table
- Three conditions: (1) ME: participant grasped and moved a cup upon audio cue; (2) MO: participant observed experimenter performing the same action; (3) MI: participant imagined performing the action without movement
- Trial structure included baseline, preparation, task execution, and rest periods
- Multiple trials per condition with counterbalanced presentation
Data Processing and Analysis:
- fNIRS data processed using modified Beer-Lambert law to compute HbO and HbR concentration changes
- EEG data processed for event-related potentials and spectral power changes
- Structured sparse multiset Canonical Correlation Analysis (ssmCCA) used to fuse fNIRS and EEG data
- Unimodal and multimodal analyses compared to identify consistent activation patterns
This protocol demonstrates the comprehensive approach required for multimodal neuroimaging, including careful experimental design, simultaneous data acquisition, sophisticated signal processing, and advanced fusion algorithms to extract complementary information from both modalities.
Multimodal Integration: Synergistic Approaches
fNIRS-EEG Integration
The combination of fNIRS and EEG represents a particularly powerful multimodal approach that captures both hemodynamic and electrophysiological aspects of brain function [23]. The integration rationale stems from the neurovascular coupling phenomenon - the inherent relationship between neural electrical activity and subsequent hemodynamic responses [23]. Simultaneous fNIRS-EEG measurements provide built-in validation for identified neural activity through concordance between electrical and hemodynamic responses [23] [6].
Methodologically, fNIRS-EEG integration can be implemented through three primary approaches:
- EEG-informed fNIRS analyses: Using EEG features to guide fNIRS signal processing or interpretation
- fNIRS-informed EEG analyses: Employing hemodynamic information to constrain EEG source localization
- Parallel analyses: Processing both modalities separately then integrating results through fusion algorithms like structured sparse multiset Canonical Correlation Analysis (ssmCCA) [23] [6]
Technical considerations for simultaneous fNIRS-EEG include compatible sensor placement using international 10-20 system, hardware synchronization via triggers or shared clocks, motion artifact management, and integrated data analysis pipelines [25] [23]. The resulting complementary data provides both high temporal resolution from EEG and improved spatial localization from fNIRS, enabling more comprehensive characterization of brain dynamics [23] [6].
fNIRS-fMRI Integration
Combining fNIRS with fMRI creates another valuable multimodal approach that leverages fMRI's high spatial resolution for whole-brain coverage and fNIRS's practical advantages for naturalistic testing [10] [15]. Since both modalities measure hemodynamic responses related to neural activity, their signals show strong correlation (spatial correlations up to R=0.86 reported in simultaneous recordings) [22] [15].
Integration methodologies include:
- Synchronous detection: Simultaneous data acquisition to directly correlate signals
- Asynchronous detection: Separate sessions using similar paradigms to validate findings across modalities [10]
This combination is particularly valuable for clinical applications where fMRI provides detailed anatomical localization and fNIRS enables bedside monitoring of treatment progress [10] [24]. Technical challenges include electromagnetic interference in MRI environments, hardware compatibility, and data fusion complexities, though ongoing innovations in MRI-compatible fNIRS probes are addressing these limitations [10].
Visualization of fNIRS Principles and Experimental Workflow
This diagram illustrates the fundamental principles of fNIRS measurement and its implementation in experimental workflows, particularly highlighting its integration with complementary modalities like EEG in multimodal research designs.
Table 3: Essential Materials and Software for fNIRS Research
| Tool Category | Specific Examples | Function/Purpose | Citation |
|---|---|---|---|
| fNIRS Systems | Hitachi ETG-4100, TechEn CW6 | Continuous wave fNIRS systems for measuring HbO/HbR changes | [22] [6] |
| EEG Systems | Electrical Geodesics (EGI) systems, BrainAmp | High-density EEG systems for electrical activity recording | [23] [6] |
| Digitization Equipment | Polhemus Fastrak, 3D magnetic digitizers | Records precise sensor positions for anatomical coregistration | [22] [6] |
| Analysis Software | HOMER3, NIRS Toolbox, AtlasViewer | Processing fNIRS signals, statistical analysis, visualization | [21] |
| Multimodal Analysis Tools | Structured Sparse Multiset CCA (ssmCCA) | Data fusion technique for integrating fNIRS and EEG signals | [6] |
| Experimental Paradigms | Verbal Fluency Task, N-back, Motor Execution/Observation/Imagery | Standardized tasks to elicit specific cognitive processes | [24] [6] |
| Quality Metrics | Scalp-Coupled Index (SCI), Global Variance in Temporal Derivative (GVTD) | Assess signal quality and identify motion artifacts | [2] |
fNIRS has established itself as a valuable neuroimaging modality that balances spatial and temporal resolution with practical advantages of portability, motion tolerance, and accessibility. While limited to cortical regions and offering moderate spatial resolution compared to fMRI, its capacity for naturalistic testing and compatibility with diverse populations has expanded the scope of neuroscientific inquiry beyond traditional laboratory constraints. The future of fNIRS lies increasingly in multimodal approaches that leverage its complementary strengths with EEG's millisecond temporal resolution and fMRI's whole-brain coverage. As technological innovations continue to address current limitations in depth sensitivity and spatial resolution, and as analysis methods become increasingly sophisticated through machine learning and advanced fusion algorithms, fNIRS is poised to make increasingly significant contributions to cognitive neuroscience, clinical diagnosis, and therapeutic monitoring.
Neurovascular coupling (NVC) is the fundamental physiological process that links neural electrical activity to subsequent local hemodynamic changes in the brain. This mechanism forms the theoretical cornerstone for integrating neuroimaging techniques that measure electrical potentials (like EEG) with those that measure hemodynamic responses (like fMRI and fNIRS). When neurons become active, they trigger a complex cascade of events—involving neurons, astrocytes, and vascular cells—that leads to an increase in local cerebral blood flow, delivering oxygen and nutrients to meet the metabolic demands of firing neurons [27]. This response, known as functional hyperemia, results in a characteristic hemodynamic signature: an increase in oxygenated hemoglobin (HbO) and a decrease in deoxygenated hemoglobin (HbR) in the active region [27] [28]. It is this tightly coupled relationship that allows researchers to infer underlying electrical brain activity from hemodynamic measurements and, conversely, to interpret the vascular implications of electrical events. Understanding NVC is therefore not merely an academic exercise but a prerequisite for designing robust neurocognitive studies and accurately interpreting data across the dominant non-invasive neuroimaging modalities.
Core Principles of Neurovascular Coupling
The process of neurovascular coupling is a precisely orchestrated sequence of events. Following synaptic activity and the release of neurotransmitters, a signaling pathway is initiated that ultimately leads to the relaxation of vascular smooth muscle and the dilation of arterioles [27]. This vasodilation causes a rapid increase in local cerebral blood flow (CBF) to the activated brain area. The resulting hemodynamic response function (HRF) is characterized by a temporal delay of 1-2 seconds post-stimulus, peaking around 5-6 seconds before returning to baseline [27]. This overcompensation of blood flow creates an oversupply of oxygen, manifesting as the increased HbO and decreased HbR that fNIRS and fMRI's Blood Oxygen Level Dependent (BOLD) signal detect [27] [10]. The integrity of this coupling is essential for healthy brain function, and its disruption is implicated in a range of neurological conditions, from schizophrenia to the long-term effects of concussion [24] [29].
Visualizing the Neurovascular Coupling Process
The following diagram illustrates the sequential relationship between neural activity, the neurovascular coupling mechanism, and the resulting signals measured by different imaging modalities.
Comparative Analysis of fMRI, EEG, and fNIRS
The theoretical framework of NVC allows for the direct comparison of the primary non-invasive neuroimaging modalities. Each technique captures a different facet of the brain's response to stimulation, governed by its inherent technical strengths and limitations. The table below provides a quantitative overview of these core characteristics.
Table 1: Technical comparison of key neuroimaging modalities
| Parameter | EEG | fNIRS | fMRI |
|---|---|---|---|
| What It Measures | Electrical activity from postsynaptic potentials [28] [30] | Hemodynamic changes (HbO & HbR) [27] [28] | Blood Oxygen Level Dependent (BOLD) signal [10] |
| Temporal Resolution | Very High (milliseconds) [10] [30] | Moderate (0.1 - 10 Hz) [10] [24] | Low (seconds) [10] |
| Spatial Resolution | Low (source localization challenges) [28] [24] | Moderate (1-3 cm) [10] [24] | High (mm to sub-mm) [10] [24] |
| Depth of Measurement | Cortical surface [30] | Outer cortex (1-2.5 cm) [24] [30] | Whole-brain (cortical & subcortical) [10] |
| Portability | High [10] [30] | High [10] [24] | Low (immobile scanner) [10] |
| Motion Tolerance | Moderate to Low [24] [30] | High [10] [24] | Low [10] |
| Best Use Cases | Fast cognitive tasks, ERPs, sleep studies [30] | Naturalistic studies, child development, rehabilitation [24] [30] | Precise spatial localization, deep brain structures [10] |
Methodological and Practical Considerations
Beyond core technical specifications, several practical factors influence the choice of modality for a given research question.
Table 2: Methodological and practical considerations for neuroimaging
| Consideration | EEG | fNIRS | fMRI |
|---|---|---|---|
| Key Advantage | Millisecond-level tracking of brain dynamics [28] | Balances portability with better spatial resolution than EEG; ideal for naturalistic settings [10] [24] | Gold standard for whole-brain spatial localization [10] |
| Primary Limitation | Poor spatial resolution and sensitivity to deep sources [28] | Limited to superficial cortical layers; cannot probe subcortical activity [10] | Very low temporal resolution; noisy, restrictive environment [10] |
| NVC Relationship | Measures the cause (electrical neural activity) [28] | Measures the effect (hemodynamic response) [27] | Measures the effect (BOLD signal, a hemodynamic correlate) [10] |
| Cost | Generally lower [30] | Low to moderate [24] [30] | High [24] [30] |
Experimental Evidence: Validating Neurovascular Coupling
The theoretical principles of NVC are consistently demonstrated and validated through empirical multimodal studies. These experiments often combine an electrical recording technique (EEG) with a hemodynamic modality (fNIRS or fMRI) to observe both sides of the coupling simultaneously.
Auditory Intensity-Dependent Amplitude Changes
A 2023 study explicitly designed to investigate NVC employed a paradigm of intensity-dependent amplitude changes (IDAP) [27]. The experimental protocol involved presenting participants with tones of varying intensities (77.9 dB, 84.5 dB, and 89.5 dB) while simultaneously recording EEG and fNIRS [27]. The results demonstrated a clear coupling: as the tone intensity increased, so did the amplitude of the ERP components (N1 and P2), indicating greater neural electrical response [27]. In parallel, the fNIRS data showed a corresponding increase in HbO and a decrease in HbR in the auditory and prefrontal cortices [27]. A Spearman correlation analysis further solidified this link, revealing a significant relationship between the N1 amplitude from EEG and the HbR concentration in the left auditory cortex measured by fNIRS [27]. This study provides a direct, within-experiment validation of the neurovascular coupling phenomenon.
A Representative Experimental Protocol
The following diagram outlines the workflow of a typical simultaneous EEG-fNIRS experiment, as used in studies investigating semantic decoding and NVC [31].
The Scientist's Toolkit: Key Research Reagents and Materials
Successful multimodal research hinges on the appropriate selection of equipment and analytical tools. The following table details essential components for a study integrating EEG and fNIRS to investigate neurovascular coupling.
Table 3: Essential materials and tools for multimodal NIRS-EEG research
| Item | Function/Description | Example in Research |
|---|---|---|
| Simultaneous EEG-fNIRS System | Integrated or synchronized hardware for co-registration of electrical and hemodynamic signals. | Systems used in auditory and semantic imagery paradigms to capture complementary data streams [27] [31]. |
| fNIRS Optodes | Sources that emit near-infrared light and detectors that measure its attenuation after passing through tissue. | Placed over auditory cortex (T7/T8) or prefrontal cortex to measure HbO/HbR changes during tasks [27] [32]. |
| EEG Electrodes | Sensors placed on the scalp according to the 10-20 system to record voltage fluctuations from neural activity. | Used to record event-related potentials (ERPs) like N1 and P2 in response to sensory stimuli [27]. |
| Stimulus Presentation Software | Software to deliver controlled auditory, visual, or cognitive tasks with precise timing. | Presenting intensity-varying tones or "Where's Wally" paradigms to evoke a measurable brain response [27] [29]. |
| Data Synchronization Interface | Hardware (e.g., TTL pulses) or software to align EEG and fNIRS data streams with sub-second precision. | Critical for correlating the fast ERP components with the slower hemodynamic response [31]. |
| Preprocessing & Fusion Algorithms | Software tools for artifact removal (e.g., motion, heartbeat) and joint data analysis (e.g., jICA, machine learning). | Used to address analytical variability and fuse features from both modalities for a unified result [33] [28]. |
Integrated Data Analysis and Workflow
The path from raw, simultaneous recordings to meaningful insights about NVC requires careful and often parallel data processing. The following diagram summarizes the analysis workflow that leads to a fused interpretation.
The choice between fMRI, EEG, and fNIRS is not a matter of identifying a single superior technology, but rather of strategically selecting the right tool for the specific research question. fMRI remains the gold standard when the objective is precise spatial localization of activity across the entire brain, including deep subcortical structures [10]. EEG is unparalleled for investigating the rapid temporal dynamics of brain function, such as the sequence of cognitive processes unfolding in the tens to hundreds of milliseconds after a stimulus [30]. fNIRS occupies a crucial middle ground, offering a favorable balance of moderate spatial resolution, good portability, and high motion tolerance, making it ideally suited for studies of cortical function in naturalistic environments or with populations that cannot tolerate the fMRI scanner [10] [24].
Ultimately, the theoretical link of neurovascular coupling empowers researchers to not only choose wisely but also to combine these modalities synergistically. A simultaneous EEG-fNIRS setup, for instance, provides a more comprehensive picture by capturing the immediate electrical neural response and its consequent hemodynamic manifestation within a portable and flexible experimental framework [28] [31]. As the field moves toward more naturalistic and clinically translatable research, understanding and leveraging the strengths of each modality through the common lens of neurovascular coupling will be paramount for future discoveries in human neurocognition.
Choosing Your Tool: Methodological Strengths and Application Scenarios in Design Neurocognition
In design neurocognition research, selecting the appropriate brain imaging technique is paramount for generating valid and insightful data. The core trade-off in this selection process almost invariably involves balancing temporal resolution—the ability to track rapid changes in brain activity over time—against spatial resolution—the precision in locating where this activity occurs in the brain. This guide provides an objective comparison of three prominent non-invasive neuroimaging modalities: functional Magnetic Resonance Imaging (fMRI), Electroencephalography (EEG), and functional Near-Infrared Spectroscopy (fNIRS). Understanding their complementary strengths and limitations enables researchers to align methodological capabilities with specific research questions, whether for fundamental cognitive science or applied drug development.
Technical Comparison of fMRI, EEG, and fNIRS
Fundamental Principles and Measured Signals
Each technique captures a distinct physiological correlate of neural activity, which fundamentally dictates its resolution characteristics.
- fMRI measures the Blood-Oxygen-Level-Dependent (BOLD) signal, an indirect hemodynamic response linked to neural metabolism. When a brain region is active, a complex neurovascular coupling process leads to a localized change in the ratio of oxygenated to deoxygenated hemoglobin, which alters the local magnetic properties of blood [34] [26].
- EEG records electrical potentials on the scalp generated by the synchronized firing of large populations of cortical neurons, primarily pyramidal cells. These postsynaptic potentials represent the direct and instantaneous electrical activity of the brain [35] [23].
- fNIRS, like fMRI, is an indirect hemodynamic method. It uses near-infrared light to measure changes in the concentration of oxygenated hemoglobin (HbO) and deoxygenated hemoglobin (HbR) in the superficial layers of the cortex, providing a measure of localized blood flow and oxygenation changes subsequent to neural firing [35] [36] [23].
Quantitative Resolution and Performance Metrics
The table below summarizes the key technical specifications of each modality, highlighting the inherent trade-offs.
Table 1: Technical Specification Comparison of fMRI, EEG, and fNIRS
| Feature | fMRI | EEG | fNIRS |
|---|---|---|---|
| What It Measures | BOLD signal (indirect hemodynamic) [34] [26] | Electrical potentials (direct neural activity) [35] [23] | HbO & HbR concentration (indirect hemodynamic) [35] [23] |
| Temporal Resolution | Low (seconds) [34] | Very High (milliseconds) [35] | Moderate (seconds) [35] |
| Spatial Resolution | High (millimeter-level) [26] [37] | Low (centimeter-level) [35] | Moderate (centimeter-level, cortical) [35] [36] |
| Depth of Measurement | Whole brain | Cortical surface [35] | Outer cortex (1-2.5 cm deep) [35] [36] |
| Portability | Low (stationary scanner) | High (wearable systems available) [35] [23] | High (wearable and mobile formats) [35] [23] [26] |
| Tolerance to Movement | Low (highly sensitive) [26] | Moderate (susceptible to artifacts) [35] | High (relatively robust) [35] [26] |
| Typical Experimental Environment | Highly controlled lab [35] | Controlled lab or shielded room | Naturalistic, real-world settings [35] |
Signaling Pathways and Neurovascular Coupling
The relationship between electrical neural events and the subsequent hemodynamic response is central to understanding fMRI and fNIRS signals. This process, known as neurovascular coupling, is illustrated below.
Figure 1: Signaling Pathways for EEG, fMRI, and fNIRS. EEG measures the direct electrical signal (blue), while fMRI and fNIRS measure indirect hemodynamic responses (green) that are coupled to neural activity via metabolic demand (red).
Experimental Protocols and Methodologies
Common Experimental Designs
Robust experimental design is critical for isolating brain activity related to a specific cognitive process.
- Block Designs: Frequently used in fMRI and fNIRS studies due to the slow nature of the hemodynamic response. This design alternates extended periods (e.g., 30 seconds) of an experimental condition with a control condition, allowing the BOLD or HbO/HbR signal to rise and stabilize. It is optimal for detecting the presence of activation and is statistically powerful [34].
- Event-Related Designs: Suitable for all three modalities but analyzed differently. Brief, discrete trials are presented in a randomized or jittered sequence. In fMRI/fNIRS, this allows the hemodynamic response to return to baseline between trials, enabling the analysis of the response's shape and timing to different trial types [34]. In EEG, it is used to average many trials to extract Event-Related Potentials (ERPs), which are voltage fluctuations time-locked to a sensory, cognitive, or motor event with millisecond precision.
Data Acquisition and Preprocessing Workflows
Each modality requires a specialized data processing pipeline to transform raw recordings into interpretable brain activity maps or metrics. The general workflow for a multimodal experiment is shown below.
Figure 2: Concurrent fNIRS-EEG Experimental Workflow. Data is acquired simultaneously, processed through separate pipelines, and then integrated [23].
Detailed Preprocessing Steps:
- fMRI Preprocessing: Key steps include slice-time correction, motion realignment to correct for head movement, coregistration to a structural image, spatial normalization to a standard brain template, and spatial smoothing to increase signal-to-noise ratio [34].
- EEG Preprocessing: This involves filtering to remove low- and high-frequency noise, segmenting data into epochs, rejecting or correcting artifacts (e.g., eye blinks, muscle activity), and re-referencing the electrodes. To improve spatial resolution, techniques like Current Source Density (CSD) or Surface Laplacian can be applied, which reduce the blurring effect of the skull and scalp [38].
- fNIRS Preprocessing: Raw light intensity is converted to optical density and then to HbO and HbR concentration changes using the Modified Beer-Lambert Law [23]. Processing includes filtering to remove cardiac and respiratory pulsations, correcting for motion artifacts, and sometimes converting channel data to a specific brain region using anatomical atlases [39].
Key Research Reagents and Solutions
The table below lists essential tools and concepts used in neurocognitive experiments.
Table 2: Essential Research Reagents and Methodologies for Neurocognition
| Item / Solution | Function / Description | Relevance in Research |
|---|---|---|
| International 10-20 System | Standardized EEG electrode placement system based on skull landmarks [35] [36]. | Ensures consistent and reproducible sensor placement across subjects and studies for EEG and fNIRS. |
| General Linear Model (GLM) | A statistical framework for modeling brain activity based on experimental design [34]. | The primary method for analyzing fMRI and fNIRS data to identify voxels or channels significantly activated by a task. |
| Independent Component Analysis (ICA) | A blind source separation technique to isolate statistically independent signals from data [40]. | Used in EEG to remove artifacts (e.g., eye blinks) and in fMRI to identify resting-state networks. |
| Event-Related Potential (ERP) | Averaged EEG waveform time-locked to a specific stimulus or response. | Isolates neural correlates of cognitive processes (e.g., P300 component of decision-making) with high temporal precision. |
| Modified Beer-Lambert Law | Algorithm relating light attenuation to changes in chromophore concentration (HbO, HbR) [23]. | The fundamental equation for converting raw fNIRS light measurements into physiologically meaningful hemoglobin data. |
The choice between fMRI, EEG, and fNIRS is not about finding the "best" technique, but rather the most appropriate one for a specific research goal.
- Use fMRI when your primary need is high spatial resolution for precise localization of brain activity and the experimental context allows for a controlled, stationary lab environment. It remains the gold standard for whole-brain mapping and identifying deep brain structures [26] [40].
- Use EEG when your research question revolves around the timing of neural processes—such as sensory processing, rapid cognitive transitions, or motor planning—and requires millisecond temporal resolution. It is ideal for studying event-related potentials and neural oscillations [35].
- Use fNIRS when you need a balance between moderate spatial localization and temporal resolution within a naturalistic, mobile, or clinical setting. Its tolerance to movement and portability make it exceptionally suited for studies with infants, children, patients, or for simulating real-world tasks like walking or driving [35] [36] [26].
Furthermore, a powerful trend in modern neurocognition is the multimodal integration of these techniques, particularly concurrent fNIRS-EEG [23]. This approach leverages the high temporal resolution of EEG and the superior spatial resolution of fNIRS within a portable setup, providing a more comprehensive picture of brain function by capturing both electrical and hemodynamic facets of neural activity simultaneously. By understanding these core capabilities, researchers can strategically align their methodological toolkit with their scientific inquiries.
Electroencephalography (EEG) stands as a state-of-the-art technique for non-invasive functional neuroimaging, first described by Hans Berger in 1929 [23]. EEG measures the brain's electrical activity via electrodes placed on the scalp, detecting voltage changes caused by the synchronized firing of cortical neurons, primarily pyramidal cells [41]. These signals are thought to result primarily from the synchronization of post-synaptic potentials at cortical pyramidal neurons, where tens of thousands of synchronized neurons firing coherently induce sufficient summation and propagation of electrical signals to the scalp [23]. The recorded EEG signals represent large-scale neural oscillatory activity divided into various characteristic frequency bands, including theta (4-7 Hz), alpha (8-14 Hz), beta (15-25 Hz), and gamma (>25 Hz) [23]. Among neuroimaging techniques, EEG's greatest strength is its exceptional temporal resolution—it captures neural dynamics on a millisecond scale, making it ideal for analyzing rapid cognitive processes [41].
Table 1: Key Technical Specifications of Major Neuroimaging Modalities
| Feature | EEG | fNIRS | fMRI |
|---|---|---|---|
| What It Measures | Electrical activity of neurons | Hemodynamic response (blood oxygenation) | Blood oxygen level-dependent (BOLD) signal |
| Temporal Resolution | Milliseconds [41] | Seconds (2-6 s) [41] | 2-4 seconds [10] |
| Spatial Resolution | Low (centimeter-level) [41] | Moderate (better than EEG) [41] | High (millimeter-level) [10] |
| Depth of Measurement | Cortical surface [41] | Outer cortex (1-2.5 cm deep) [41] | Whole brain (cortical and subcortical) [10] |
| Portability | High (lightweight, wireless systems) [41] | High (mobile, wearable formats) [41] | Low (immobile equipment) [10] |
| Best Use Cases | Fast cognitive tasks, ERP studies, sleep research [41] | Naturalistic studies, child development, motor rehab [41] | Spatial localization, deep brain structures, clinical diagnostics [10] |
Fundamental Neural Signatures of Fast Cognitive Processes
Event-Related Potentials (ERPs)
Event-Related Potentials (ERPs) represent a series of EEG events that reflect the progressive activation of neuronal sub-populations in the course of cognitive processing [42]. In the 0-150 ms after stimulus onset, ERPs are related to physical characteristics of stimulus (exogenous ERPs) and reflect sensory treatment, whereas later ERPs (endogenous ERPs) are task-dependent [42]. Several well-established ERP components serve as critical markers for specific cognitive processes:
N200: A negative deflection occurring approximately 200 ms post-stimulus that serves as a specific marker of emotional value, relevance, and salience of stimuli, as well as emotional involvement (arousal) induced by affective conditions [43]. This component is directly related to the degree of attentional and emotional relevance of the context and is modulated by judgment of affective arousal and valence of emotional stimuli [43].
N400: A component associated with semantic memory processes, typically emerging around 400 ms post-stimulus [44]. The frontal N400 (FN400) is often associated with familiarity processing and conceptual priming [44].
P300/Late Positive Component (LPC): Emerging from 400 to 800 ms, the LPC has been shown to index recollective processing and correlates with source memory strength [44]. The P300 component elicited by oddball stimuli satisfies the characteristics of an evidence accumulation signal in decision-making [45].
Brain Oscillations
Neural oscillations in specific frequency bands provide complementary information to ERPs about cognitive processing:
Theta oscillations (4-8 Hz): Support corticohippocampal interactions needed for increasing memory load [42] and mediate integrative encoding [44]. A frontal theta power increase occurs in initial phases of encoding with demanding attentional tasks, followed by sustained oscillatory activity for higher working memory load [42].
Alpha oscillations (8-13 Hz): Suppression of alpha power correlates with the predicted build-up of evidence during decision-making [45]. Alpha-beta oscillations (8-30 Hz) may underlie encoding, possibly reflecting an increase in information or controlled access to matching information in semantic memory [44].
Beta oscillations (16-25 Hz): Support the maintenance of events necessary for memory encoding [44].
Table 2: Cognitive Correlates of EEG Neural Oscillations and ERPs
| Neural Signature | Frequency/Timing | Cognitive Correlates | Regulatory Effects |
|---|---|---|---|
| Frontal Theta ERS | 4-8 Hz; initial encoding phases [42] | Working memory activation, attention allocation [42] | Decreased culmination peak in psychosis [42] |
| Alpha Suppression | 8-13 Hz; during evidence accumulation [45] | Evidence accumulation, decision formation [45] | Tracks tastiness according to goal relevance [45] |
| N200 ERP | ~200 ms post-stimulus [43] | Emotional relevance, arousal, salience detection [43] | Increased amplitude for emotional vs. neutral cues [43] |
| P300/LPC ERP | 300-800 ms post-stimulus [44] | Recollective processing, source memory [44] | Reduced in older adults and cognitive impairment [44] |
| FN400 ERP | ~400 ms post-stimulus [44] | Familiarity processing, conceptual priming [44] | Reduced in older adults [44] |
Experimental Protocols for EEG Research
Working Memory Protocol (N-back Task)
This protocol examines neural correlates of working memory, attention, and executive function [42].
Stimuli and Task Design: Participants view pseudorandom sequences of letters presented on a screen. Stimuli consist of white letters in Arial font (2° × 2.5° visual angle), with 10% grey noise, embedded in a 50% random-noise grey rectangular background patch (6° × 6.7° visual angle). They are presented for 0.5 s duration, separated by 5-s intervals [42].
Experimental Conditions:
- Simple detection task: Sequential letters or background patches without letters are presented. Participants respond when patches with letters appear.
- 1-back task: The target is any letter identical to the one immediately preceding it.
- 2-back task: The target is any letter identical to the one presented two trials back.
- Passive fixation task: Identical letter series to the 2-back task are presented, but participants are unaware of the order and simply watch passively [42].
EEG Recording Parameters: Continuous EEG is recorded using 20 surface electrodes placed according to the international 10-20 system with linked earlobes as reference. Skin impedance is kept below 5 KOhms. Signals are sampled at 1024 Hz, with a lower cut-off of 0.33 Hz and an upper cut-off of 120 Hz. The electro-oculogram (EOG) is recorded using two pairs of bipolar electrodes to correct for ocular artifacts [42].
Data Processing: EEG signals are corrected for ocular artifacts using an off-line threshold reduction algorithm. Signals are automatically cleared of movement artifacts where voltage exceeds 100 μV criteria, and remaining trials are inspected visually. The EEG data are segmented into epochs of 4800 ms, starting 1300 ms before stimulus onset [42].
Semantic Congruence and Memory Protocol
This protocol examines how semantic congruence influences long-term memory formation [44].
Stimuli and Task Design: Experimental stimuli consist of word pairs: the first word is a semantic category (e.g., "furniture") designed to preactivate specific semantic memory networks. The second word is an item either congruent (e.g., "chair") or incongruent (e.g., "apple") with the previous category [44].
Procedure: The study phase consists of multiple word-encoding trials. Each trial begins with a fixation cross (2000-3000 ms), followed by a category name in blue (1500 ms), another fixation cross (2000 ms), and then the subsequent word in green (1000 ms). Participants classify whether the word is congruent or incongruent with the semantic category. This is followed by a separate recognition memory test phase [44].
ERP Analysis: Focuses on components including the FN400 (associated with familiarity and conceptual priming) and LPC (associated with recollective processing), examining differences between congruent and incongruent conditions and their relationship to subsequent memory performance [44].
Dietary Decision-Making Protocol
This protocol investigates how regulatory focus alters attribute value construction and evidence accumulation in food choices [45].
Task Design: Subjects perform a food choice task where they decide whether they want to consume different foods while focusing on one of three goals: respond naturally to all foods (NATURAL), focus on healthy eating (HEALTH), or focus on decreasing desire for all foods (DECREASE) [45].
Stimuli and Procedure: On each trial, subjects make one of four responses (Strong No, No, Yes, or Strong Yes) to indicate whether they want to eat the food displayed. After the choice task, subjects rate each food stimulus for its tastiness and healthiness on a 1-6 scale [45].
Computational Modeling and EEG Analysis: A drift-diffusion model (DDM) is estimated with parameters including weights on tastiness and healthiness. EEG analyses focus on how ERPs and oscillatory dynamics (particularly theta, alpha, and beta) correlate with model-predicted attribute value construction and evidence accumulation signals under different regulatory conditions [45].
Diagram 1: Experimental Workflow for EEG Studies of Cognitive Processes
Comparative Performance in Neuroimaging Research
Temporal Resolution and Capture of Fast Processes
EEG's millisecond-scale temporal resolution provides unparalleled capacity for capturing rapid neural dynamics during cognitive processing [41]. This is particularly critical for studying event-related potentials (ERPs) that unfold within hundreds of milliseconds following stimulus presentation, such as the N200 (∼200 ms) reflecting emotional salience detection [43] and the N400 (∼400 ms) associated with semantic processing [44]. Studies successfully utilizing EEG for these ultra-fast processes include:
Emotional Processing Research: Investigating cortical responses to emotional inter-species interactions, where N200 components showed significant modulation by emotional valence during both visual and combined visual-auditory stimulation conditions [43].
Working Memory Studies: Examining frontal theta event-related synchronization during n-back tasks, where phasic theta ERS supports activation of neural networks involved in attention allocation, while later sustained power appears related to item retention [42].
Decision-Making Research: Tracking the temporal dynamics of evidence accumulation during dietary choices, where suppression of frontal and occipital alpha power correlated with model-predicted evidence accumulation signals [45].
In contrast, fNIRS is constrained by the delay of the hemodynamic response (2-6 seconds), making it unsuitable for capturing these millisecond-scale neural events [41]. Similarly, fMRI's temporal resolution is limited to 2-4 seconds due to the slow hemodynamic response, preventing precise tracking of rapid cognitive processes [10].
Complementary Strengths in Multimodal Approaches
Integrated EEG-fNIRS approaches offer numerous benefits over single-modality methods by exploiting their individual strengths [23]. The rationale behind combining EEG and fNIRS relies on the physiological phenomenon of neurovascular coupling within the brain, where neural activity is inherently accompanied by fluctuation of cerebral blood flow that carries oxygen and nutrients to neurons [23].
Methodological Categories for Concurrent fNIRS-EEG Analyses:
- EEG-informed fNIRS analyses: Using temporal information from EEG to inform the analysis of hemodynamic responses [23].
- fNIRS-informed EEG analyses: Utilizing spatial information from fNIRS to constrain source localization of electrical activity [23].
- Parallel fNIRS-EEG analyses: Analyzing both modalities separately and comparing results to provide complementary information [23].
Diagram 2: Multimodal Integration of EEG and fNIRS
The Scientist's Toolkit: Research Reagent Solutions
Table 3: Essential Materials and Equipment for EEG Research
| Item | Function | Specifications/Parameters |
|---|---|---|
| EEG Recording System | Measures electrical brain activity | 20+ electrodes; 10-20 international system; Sampling rate: ≥1024 Hz [42] |
| Electrodes | Detect voltage changes on scalp | Ag/AgCl; Skin impedance <5 kΩ [42] |
| Electro-oculogram (EOG) | Monitor eye movements for artifact correction | Bipolar electrodes; Vertical and horizontal EOG [42] |
| Stimulus Presentation Software | Deliver controlled experimental stimuli | Precision timing; Millisecond accuracy; Synchronization triggers [44] |
| Artifact Correction Algorithms | Remove ocular and movement artifacts | Regression-based, ICA; Voltage threshold: 100 μV [42] |
| ERP Analysis Toolbox | Extract and analyze event-related potentials | Epoch segmentation; Baseline correction; Component measurement [44] |
| Time-Frequency Analysis Software | Analyze neural oscillations | Wavelet transform; Bandpass filtering; Power spectral analysis [45] |
| fNIRS System (for multimodal) | Measure hemodynamic responses | NIR light (650-950 nm); Sources and detectors; Modified Beer-Lambert Law [23] |
EEG provides unparalleled capabilities for investigating ultra-fast cognitive processes through event-related potentials (ERPs) and brain oscillations, offering millisecond temporal resolution unmatched by hemodynamic-based techniques like fNIRS and fMRI. Specific ERP components including N200, N400, and P300/LPC enable precise tracking of distinct cognitive operations from emotional salience detection to semantic processing and memory formation. Similarly, neural oscillations in theta, alpha, and beta frequencies provide complementary information about working memory, attention allocation, and evidence accumulation. While EEG's spatial resolution remains limited, its integration with complementary modalities like fNIRS creates powerful multimodal approaches that leverage the strengths of each technique. For researchers studying the temporal dynamics of cognitive processes with precision timing, EEG remains an indispensable tool in the neuroimaging arsenal.
Understanding the human brain in real-world contexts is a central challenge in cognitive neuroscience. Traditional neuroimaging tools, particularly functional magnetic resonance imaging (fMRI),, while powerful, are constrained by their immobility and sensitivity to motion, making them unsuitable for studying brain function in naturalistic settings [10] [5]. In recent years, functional near-infrared spectroscopy (fNIRS) has emerged as a pivotal technology that bridges this gap. As a portable, non-invasive optical brain imaging technique, fNIRS measures cortical hemodynamic responses by detecting changes in oxygenated (HbO) and deoxygenated hemoglobin (HbR) concentrations [46] [47]. This review positions fNIRS within the broader neuroimaging toolkit, comparing its performance against fMRI and electroencephalography (EEG) and highlighting its unique value for mobile, pediatric, and clinical applications. Its growing adoption is driven by its unique combination of portability, tolerance to movement, and its ability to provide a reasonable balance between spatial and temporal resolution, allowing researchers to study the brain in ecologically valid environments—from classrooms and homes to rehabilitation clinics [46] [48].
Neuroimaging Modalities at a Glance: A Technical Comparison
To objectively compare fNIRS with its alternatives, it is essential to understand their fundamental technical capabilities, advantages, and limitations. The following table provides a structured summary of these aspects for fNIRS, fMRI, and EEG, which are the three primary non-invasive modalities for functional brain imaging.
Table 1: Technical comparison of key non-invasive functional neuroimaging modalities.
| Feature | fNIRS | fMRI | EEG |
|---|---|---|---|
| What It Measures | Hemodynamic response (HbO/HbR) [49] | Blood-oxygen-level-dependent (BOLD) signal [10] | Electrical potentials from neurons [49] |
| Spatial Resolution | Moderate (2-3 cm) [10] [5] | High (millimeter-level) [10] [5] | Low (centimeter-level) [49] |
| Temporal Resolution | Moderate (0.1-10 Hz) [46] | Slow (0.3-2 Hz) [10] [5] | Very High (millisecond) [49] |
| Portability | High (wearable systems available) [48] | Low (immobile scanner) [10] | High (wireless systems available) [49] |
| Tolerance to Motion | Strong [46] | Weak [10] | Weak (highly susceptible) [49] |
| Depth of Penetration | Superficial cortex (1-2 cm) [10] [5] | Whole brain (cortical & subcortical) [10] | Primarily cortical surface [49] |
| Best Use Cases | Naturalistic studies, pediatrics, clinical rehab [46] [48] | Precise spatial localization, deep brain structures [10] | Fast cognitive processes, ERPs, sleep [49] |
The data reveals a clear complementarity between the modalities. fMRI provides unparalleled spatial precision and whole-brain coverage but is fundamentally confined to a controlled laboratory setting. EEG captures neural dynamics with millisecond precision but struggles with localizing the source of activity. fNIRS occupies a unique middle ground, offering better spatial resolution than EEG and greater portability and motion tolerance than fMRI, making it the most suitable technology for studying brain function in real-world environments [10] [49].
The Unique Niche of fNIRS: Key Application Areas
Mobile and Naturalistic Studies
The portability and motion tolerance of fNIRS systems have unlocked new possibilities for studying the brain during dynamic, real-world tasks. Unlike fMRI, which requires participants to lie still, fNIRS can be used while participants are walking, talking, or engaging in complex activities. This capability is crucial for neuroergonomics, educational neuroscience, and social interaction studies. A seminal application is the assessment of executive function following social media use. In a 2025 study, researchers used a wearable fNIRS system to monitor prefrontal cortex activity of college students in a naturalistic setting before and after social media exposure. They observed behavioral impairment (reduced accuracy on executive function tasks) coupled with altered neural activation: increased medial prefrontal activity suggesting compensatory effort, and decreased dorsolateral and ventrolateral prefrontal activation indicating impairment in working memory and inhibitory control [48]. This study exemplifies how fNIRS can capture the immediate cognitive and neural costs of everyday behaviors in ecologically valid contexts.
Pediatric Populations
fNIRS is particularly well-suited for pediatric neuroimaging due to its non-invasiveness, quiet operation, and tolerance for movement, which is a critical advantage when studying infants and young children [46] [50]. A 2024 bibliometric analysis highlighted the rapid growth of fNIRS in pediatrics, with research hotspots including executive function and Autism Spectrum Disorder (ASD) [50]. In children with ASD, fNIRS has identified atypical activation patterns within social brain networks [46]. Similarly, studies of Attention-Deficit/Hyperactivity Disorder (ADHD) have characterized diminished activation in the prefrontal cortex, a region critical for cognitive control [46]. The technology's ability to be used in natural settings, such as a parent's lap, minimizes distress for the child, leading to more reliable data and enabling the study of early brain development and developmental disorders in a manner that fMRI and EEG cannot easily replicate [46].
Clinical Assessment and Rehabilitation
In clinical settings, fNIRS shows significant promise as a tool for monitoring recovery and guiding rehabilitation, especially after neurological injuries like stroke. Post-stroke motor recovery is mediated by large-scale reorganization of the brain's functional networks, and fNIRS can dynamically track these changes [51]. Quantitative parameters derived from fNIRS, such as lateralization of prefrontal activity during motor tasks, serve as potential biomarkers for recovery progression [51]. Furthermore, the integration of fNIRS with EEG in a multimodal approach is increasingly being explored in neurorehabilitation. This combination allows researchers to pool neural electrical activity and hemodynamic signals, offering new features related to neurovascular coupling that may be more accurate for characterizing post-stroke cortical reorganization than either modality alone [51] [2]. This integrated approach provides a more comprehensive assessment of brain function, which can be used to personalize rehabilitation strategies for individual patients.
Experimental Protocols and Methodologies
A Representative fNIRS Experiment in a Naturalistic Setting
The following workflow visualizes the structure of a typical fNIRS study investigating the impact of an everyday intervention (like social media use) on cognitive function, as described in a 2025 study [48].
Protocol for a Multimodal fNIRS-EEG Study
Multimodal integration, particularly of fNIRS and EEG, provides a more comprehensive view of brain function by capturing both hemodynamic and electrical activity [51] [2]. The following diagram outlines a standard protocol for a simultaneous fNIRS-EEG experiment, commonly used in motor imagery and cognitive tasks.
The Scientist's Toolkit: Essential Reagents and Materials
Successful implementation of fNIRS research, especially in multimodal contexts, requires specific hardware and software tools. The table below details key solutions and their functions based on commonly cited methodologies in the literature [51] [2] [49].
Table 2: Essential research reagents and materials for fNIRS and multimodal studies.
| Category | Item | Function & Specification |
|---|---|---|
| Core Hardware | fNIRS System (Continuous Wave) | Measures changes in HbO/HbR using 2+ wavelengths (e.g., 760 nm & 850 nm) [52] [2]. |
| Integrated fNIRS-EEG Cap | Holds optodes and electrodes according to the 10-20/10-5 system, ensuring consistent spatial registration [2] [49]. | |
| Data Quality Control | Scalp Coupling Index (SCI) | A metric to automatically identify and exclude fNIRS channels with poor contact with the scalp [2]. |
| Global Variance in Temporal Derivative (GVTD) | A robust method for identifying time segments contaminated by motion artifacts in fNIRS data [2]. | |
| Software & Analysis | HomER / HomER2 | A widely cited, MATLAB-based toolbox for processing and visualizing fNIRS data [50]. |
| MNE / Brainstorm | Open-source software packages that support the analysis of both EEG and fNIRS data, including source reconstruction [2]. | |
| Data Fusion | Joint Independent Component Analysis (jICA) | A statistical method for identifying common underlying components from simultaneously acquired fNIRS and EEG data [49]. |
| Graph Signal Processing (GSP) | A mathematical framework for analyzing functional data with respect to the underlying structural brain network [2]. |
fNIRS has firmly established itself as an indispensable tool within the functional neuroimaging arsenal, filling a critical void left by fMRI and EEG. Its unique profile of portability, motion tolerance, and relatively balanced spatiotemporal resolution makes it the premier choice for studying brain function in real-world, dynamic contexts. As the technology continues to advance, its application in mobile monitoring, pediatric development, and clinical rehabilitation is poised to grow, offering unprecedented insights into the behaving brain outside the sterile confines of the traditional laboratory. Future directions will likely focus on enhancing hardware for deeper tissue penetration, standardizing experimental protocols, and developing more sophisticated machine learning-driven data fusion techniques to fully leverage the synergistic potential of multimodal integrations like fNIRS-EEG [10] [5]. For researchers and clinicians focused on ecological validity, fNIRS is not just an alternative but often the most appropriate and powerful technology available.
In the field of design neurocognition research, understanding the complex dynamics of brain function requires imaging techniques that capture both the rapid timing of neural events and their precise spatial origins. While individual neuroimaging modalities like functional magnetic resonance imaging (fMRI), electroencephalography (EEG), and functional near-infrared spectroscopy (fNIRS) each provide valuable insights, they present fundamental trade-offs between temporal and spatial resolution [53]. fMRI measures blood oxygenation changes with good spatial resolution but limited temporal precision, confined to restrictive scanning environments. EEG records electrical brain activity with millisecond temporal resolution but struggles with spatial localization [54]. fNIRS tracks hemodynamic responses with better portability than fMRI but shares its temporal limitations [55].
The integration of EEG and fNIRS into a unified multimodal platform represents a transformative approach that overcomes the limitations of individual modalities [53]. This combination captures complementary aspects of brain activity: EEG directly measures the brain's rapid electrical activity from pyramidal neurons, while fNIRS localizes the slower hemodynamic changes in oxygen metabolism that follow neural activation [54]. This review explores how the simultaneous acquisition of EEG and fNIRS signals enables comprehensive spatiotemporal brain mapping, providing researchers with a powerful tool for investigating cognitive processes in more naturalistic settings and advancing drug development through enhanced neurofeedback protocols [56].
Neuroimaging Modalities: A Comparative Foundation
Table 1: Comparison of Key Neuroimaging Modalities for Design Neurocognition Research
| Modality | Temporal Resolution | Spatial Resolution | Measured Signal | Key Advantages | Primary Limitations |
|---|---|---|---|---|---|
| fMRI | ~0.5-2 seconds [2] | 1-5 mm | Blood-oxygen-level-dependent (BOLD) [55] | Excellent spatial resolution, whole-brain coverage | Expensive, immobile, noisy environment, magnetic interference |
| EEG | <1 millisecond [53] [54] | ~10-20 mm [57] | Electrical potentials from neuronal firing [54] | Direct neural activity measurement, portable, cost-effective | Poor spatial resolution, sensitive to artifacts, limited to cortical surfaces |
| fNIRS | 2-10 Hz [2] | 5-10 mm [57] | Hemoglobin concentration changes [55] | Good spatial resolution, portable, tolerant of movement | Limited depth penetration, slower hemodynamic response |
| EEG-fNIRS Integration | Millisecond (EEG) + seconds (fNIRS) | 5-10 mm (fNIRS-guided) [57] | Electrical + hemodynamic responses [53] | Complementary spatiotemporal profiling, minimal interference [54] | Technical integration complexity, requires specialized analysis |
The fundamental advantage of EEG-fNIRS integration lies in harnessing complementary strengths while mitigating individual weaknesses. EEG provides exquisitely detailed temporal information about neural processing, capturing event-related potentials and neural oscillations with millisecond precision [58]. Meanwhile, fNIRS offers superior spatial localization of the hemodynamic response, providing more accurate identification of activated brain regions than EEG alone [53]. Together, they enable researchers to track both the rapid neural dynamics and their metabolic consequences with enhanced precision.
Unlike fMRI, which requires stringent environmental controls, EEG-fNIRS systems are portable and tolerate some movement, making them suitable for more ecologically valid experimental paradigms [55]. This is particularly valuable for design neurocognition research, where participants may need to interact with physical prototypes or complex visual stimuli in naturalistic settings. Furthermore, the combined approach provides multiple measures of neural activity, offering convergent validation for observed effects—a critical advantage in drug development where confirming target engagement is essential [56].
The Complementary Nature of EEG and fNIRS Signals
The synergy between EEG and fNIRS stems from their measurement of distinct but neurophysiologically linked phenomena. EEG records electrical potentials generated primarily by pyramidal neurons, reflecting the brain's immediate response to stimuli or cognitive tasks [54]. These signals manifest as event-related potentials (ERPs) within hundreds of milliseconds, such as the P300 component observed during decision-making tasks [58]. fNIRS, conversely, measures hemodynamic changes by detecting light absorption variations in oxygenated (HbO) and deoxygenated hemoglobin (HbR) species [55]. These metabolic responses unfold over seconds following neural activation, providing spatial information about brain regions involved in task processing [59].
The relationship between these signals is governed by neurovascular coupling—the biological mechanism that links neuronal activity to subsequent changes in cerebral blood flow [55]. When neurons become active, they trigger a complex cascade that ultimately increases local blood flow, delivering oxygen and nutrients. This coupling forms the theoretical foundation for integrating EEG and fNIRS, as electrical and hemodynamic events represent different phases of the same underlying neural process [53].
Table 2: Signal Characteristics and Complementarity of EEG and fNIRS
| Characteristic | EEG | fNIRS |
|---|---|---|
| Biological Basis | Post-synaptic potentials of pyramidal neurons [54] | Hemodynamic response from neurovascular coupling [55] |
| Primary Metrics | Event-related potentials (ERPs), spectral power, functional connectivity | Concentration changes in oxyhemoglobin (HbO) and deoxyhemoglobin (HbR) [59] |
| Typical Latency | Immediate (milliseconds) [58] | Delayed (2-6 seconds) [54] |
| Spatial Specificity | Limited by volume conduction | Superior to EEG, inferior to fMRI [53] |
| Artifact Sensitivity | Highly sensitive to ocular, muscle, and motion artifacts | Less susceptible to electrical artifacts, affected by systemic physiological noise |
| Depth Penetration | Primarily cortical, with some subcortical contributions | Superficial cortex (1-3 cm) |
Figure 1: Neurovascular coupling links the neural activity measured by EEG with the hemodynamic response measured by fNIRS, creating complementary signals with different temporal characteristics.
Technical Implementation and Integration Protocols
Successful integration of EEG and fNIRS requires careful attention to hardware compatibility, sensor placement, and synchronization methods. The physical integration typically involves embedding both EEG electrodes and fNIRS optodes within a single head cap, with several approaches available for co-registration [53]. The most common method utilizes flexible EEG electrode caps as a foundation, with punctures made at specific locations to accommodate fNIRS probe fixtures [53]. Customized solutions using 3D printing or cryogenic thermoplastic sheets offer improved fit and stability but at higher cost or complexity [53].
Sensor placement strategies include adjacent positioning, where EEG electrodes and fNIRS optodes are placed near each other, or co-located measurements, which require specialized EEG electrodes that permit light transmission [60]. The selection of appropriate montages should be guided by the research question, with consideration given to potential competition for scalp locations. For instance, visual tasks would prioritize coverage of occipital regions, while motor imagery paradigms would emphasize sensorimotor cortex coverage [54] [57].
Figure 2: Comprehensive workflow for simultaneous EEG-fNIRS experiments, from initial setup through data acquisition to multimodal analysis.
Synchronization represents perhaps the most critical technical challenge in multimodal integration. Precise temporal alignment of EEG and fNIRS data streams is essential for meaningful cross-modal correlations [61]. Several synchronization approaches are commonly employed:
- Lab Streaming Layer (LSL): An open-source platform for unified collection of data streams across a network, allowing software-based synchronization [61] [54].
- Hardware Triggers: Dedicated synchronization devices like the PortaSync provide analog inputs and outputs for trigger sharing between systems [61].
- Parallel Port Systems: The NIRx Parallel Port Replicator splits a single input to multiple outputs for simultaneous trigger distribution [60].
The experimental paradigm must accommodate the different temporal characteristics of each modality. Block designs are typically preferred for fNIRS to capture the slower hemodynamic response, while event-related designs suit EEG's capacity to track rapid neural changes [54]. A hybrid approach incorporating both trial-based events for EEG analysis and extended blocks for fNIRS provides optimal conditions for both modalities [54].
Experimental Applications and Case Studies
Motor Imagery and Brain-Computer Interfaces
Motor imagery (MI) paradigms have emerged as a prominent application for EEG-fNIRS integration, particularly in brain-computer interface (BCI) development for neurorehabilitation. The HEFMI-ICH dataset exemplifies this approach, combining 32 EEG electrodes with 90 fNIRS channels to record neural activity during left-right hand motor imagery tasks [57]. This multimodal framework demonstrated 5-10% improvement in classification accuracy compared to unimodal systems, highlighting the practical advantage of combined electrical and hemodynamic monitoring [57].
The experimental protocol typically involves repeated trials where participants imagine performing specific motor actions without actual movement. In the HEFMI-ICH protocol, each trial begins with a visual cue (2s) indicating the required imagery, followed by an execution phase (10s) for kinesthetic motor imagery, and an inter-trial interval (15s) to allow hemodynamic responses to return to baseline [57]. This structure accommodates both the rapid EEG responses during cue presentation and the slower hemodynamic changes during sustained imagery.
Cognitive Monitoring and Neurodegenerative Disorders
EEG-fNIRS integration shows particular promise in assessing cognitive function and detecting neurodegenerative conditions. Studies investigating mild cognitive impairment (MCI) and Alzheimer's disease have identified characteristic reductions in prefrontal connectivity and decreased oxyhemoglobin levels in the dorsolateral prefrontal cortex during cognitive tasks [59]. The combined approach enhances diagnostic accuracy by capturing both the functional connectivity disruptions (via EEG) and the metabolic deficiencies (via fNIRS) associated with these conditions.
In one prospective cross-sectional study with 246 participants, fNIRS analysis during cognitive scale performance revealed that as cognitive function declines, prefrontal connectivity becomes less stable, with reduced communication between left and right prefrontal regions in MCI patients [59]. When combined with machine learning algorithms, these multimodal signatures offer powerful tools for early detection and monitoring of neurodegenerative progression.
Visual Cognitive Processing
Simultaneous EEG-fNIRS has illuminated the neural correlates of visual cognitive processing, particularly in tasks involving intentional memory encoding. One study utilizing a visual cognitive motivation paradigm found that EEG metrics effectively captured early intention-driven neural dynamics, with enhanced ERP amplitudes in parietal and occipital channels around 300 ms post-stimulus for motivationally significant conditions [58]. Meanwhile, fNIRS revealed more distributed patterns of cognitive engagement during subsequent decision periods, though with greater inter-subject variability [58].
This temporal dissociation demonstrates the complementary strength of multimodal integration: EEG identifies the precise timing of initial cognitive engagement, while fNIRS tracks the sustained metabolic support for complex decision processes. Such insights are particularly valuable for design neurocognition research seeking to optimize visual interfaces and information presentation.
Table 3: Essential Equipment and Software for EEG-fNIRS Research
| Category | Specific Examples | Key Functions | Implementation Considerations |
|---|---|---|---|
| EEG Systems | g.tec g.HIamp, Brain Products actiCAP, g.Nautilus PRO FLEXIBLE [57] [60] | Electrical signal acquisition, electrode impedance monitoring | Sampling rate (256-1000 Hz), number of channels, compatibility with fNIRS caps |
| fNIRS Systems | Artinis devices, NIRSport2, NirScan [61] [57] | Hemodynamic response measurement via light absorption at multiple wavelengths | Wavelength selection (760nm, 850nm), source-detector separation (3cm), number of channels |
| Integration Caps | Custom hybrid caps, actiCAP with 128-160 slits [54] [57] | Physical support for both EEG electrodes and fNIRS optodes | Fabric color (preferably black), slit density, holder compatibility |
| Synchronization Tools | Lab Streaming Layer (LSL), PortaSync, Parallel Port Replicator [61] [60] | Temporal alignment of data streams, shared event marking | Compatibility with stimulus software, trigger latency, analog/digital options |
| Stimulus Presentation | E-Prime, Presentation, PsychoPy | Experimental paradigm implementation, precise timing control | Trigger output capabilities, compatibility with synchronization methods |
| Analysis Platforms | MATLAB with toolboxes (BBCI, FieldTrip), MNE, Brainstorm [2] [58] | Preprocessing, artifact removal, multimodal data fusion | Support for both EEG and fNIRS data formats, custom scripting capabilities |
Successful EEG-fNIRS research requires careful selection of compatible hardware and software components. The NIRSport2 fNIRS system combined with g.tec g.Nautilus or Brain Products LiveAmp EEG amplifiers represents one validated configuration [60]. Custom-designed hybrid caps with optimized topography ensure proper probe placement and adequate scalp coupling for both modalities [57]. For synchronization, systems supporting Lab Streaming Layer (LSL) offer flexible software-based integration, while hardware solutions like the PortaSync provide robust trigger distribution [61].
Analysis pipelines typically involve modality-specific preprocessing followed by multimodal integration. EEG processing includes filtering, artifact removal (ocular, cardiac, muscle), and epoch extraction. fNIRS analysis involves converting raw intensity signals to optical density, removing motion artifacts, converting to hemoglobin concentrations, and applying temporal filtering [2]. Subsequent multimodal analysis may include correlational approaches, joint independent component analysis, or classification algorithms that leverage both electrical and hemodynamic features [57].
Future Directions and Clinical Translation
The evolving landscape of EEG-fNIRS integration points toward several promising directions. Technologically, efforts focus on improving hardware miniaturization, enhancing system portability, and developing more sophisticated co-registration methods [53]. Algorithmic advances in signal processing, particularly machine learning approaches for feature extraction and classification, continue to enhance the sensitivity and specificity of multimodal measurements [59] [57].
In clinical applications, EEG-fNIRS shows significant potential for neurorehabilitation, particularly in stroke recovery and intracerebral hemorrhage [57]. The ability to monitor both electrical and hemodynamic responses provides a more comprehensive assessment of neuroplastic changes during rehabilitation. Similarly, in drug development, combined EEG-fNIRS offers multidimensional biomarkers for assessing treatment efficacy and understanding mechanisms of action [56].
Neurofeedback represents another growing application, with fNIRS providing spatial specificity to complement EEG's temporal precision [56]. This combination enables more targeted regulation of brain networks, with potential applications in substance use disorders, ADHD, and other neurological conditions [56]. As these technologies become more accessible and analysis methods more standardized, EEG-fNIRS integration is poised to become a cornerstone technique for comprehensive spatiotemporal brain mapping in both basic research and clinical practice.
Navigating Practical Challenges: Cost, Portability, Artifacts, and Data Quality
Selecting an appropriate neuroimaging modality is a critical decision that directly impacts the feasibility, cost, and ultimate success of design neurocognition research. This guide provides a systematic cost-benefit analysis of three prominent technologies—functional Magnetic Resonance Imaging (fMRI), Electroencephalography (EEG), and functional Near-Infrared Spectroscopy (fNIRS)—focusing on their financial and logistical constraints. By synthesizing contemporary experimental data and comparing operational parameters, this analysis aims to equip researchers and drug development professionals with a practical framework for aligning methodological choices with project-specific goals, budget limitations, and practical research environments.
Understanding the neural correlates of cognitive processes is fundamental to advancing neurocognitive design, from optimizing user interfaces to developing therapeutic interventions. The selection of a brain imaging technology is often a trade-off between its capabilities and its constraints [10]. Functional Magnetic Resonance Imaging (fMRI) provides unparalleled spatial detail of deep brain structures, Electroencephalography (EEG) captures neural dynamics with millisecond precision, and functional Near-Infrared Spectroscopy (fNIRS) offers a balance of portability and moderate resolution for real-world settings [10] [62] [7]. Each of these non-invasive modalities operates on different biological principles, measures distinct physiological signals, and consequently, imposes unique financial and logistical burdens on a research program. This article moves beyond technical specifications to deliver a structured cost-benefit analysis, providing a decision-making framework grounded in current experimental protocols and empirical data.
Our analysis is based on a comprehensive review of recent peer-reviewed literature, technical specifications, and experimental comparisons. The core financial and operational parameters were extracted and standardized to enable direct comparison. The Total Cost of Ownership (TCO) is evaluated, encompassing not only the initial acquisition but also installation, maintenance, operational staffing, and consumables. Logistical Feasibility is assessed based on portability, participant tolerance, environmental robustness, and suitability for longitudinal or ecological studies. Experimental protocols from key studies illustrate how these constraints manifest in practical research scenarios.
Financial and Logistical Comparison
The following tables summarize the core financial and operational characteristics of fMRI, EEG, and fNIRS, providing a basis for objective comparison.
Table 1: Financial Cost Breakdown of Neuroimaging Modalities
| Cost Component | fMRI | EEG | fNIRS |
|---|---|---|---|
| Approx. Hardware Acquisition | Very High (>$1,000,000) [10] | Low to Moderate ($10,000 - $100,000+) [62] | Moderate to High ($50,000 - $200,000+) [62] [63] |
| Installation & Infrastructure | Requires specialized shielded room; very high cost [10] | Minimal; standard lab room sufficient | Minimal; portable systems require no fixed installation [64] [63] |
| Annual Maintenance | Very High (service contracts) | Low to Moderate | Moderate |
| Operational Cost per Session | High (technician, helium, power) | Low (electrode gels, pastes) | Low to Moderate (minimal consumables) |
| Consumables | None | Electrodes, gels, conductive pastes | Optodes (if applicable); minimal [64] |
Table 2: Operational and Logistical Profile of Neuroimaging Modalities
| Operational Characteristic | fMRI | EEG | fNIRS |
|---|---|---|---|
| Portability | Non-portable; fixed installation [10] | High; lightweight, wireless systems available [62] | High; wearable, wireless formats [62] [63] |
| Temporal Resolution | Low (seconds) [10] | Very High (milliseconds) [62] | Moderate (seconds) [62] |
| Spatial Resolution | Very High (millimeter-level) [10] | Low (centimeter-level) [62] | Moderate (better than EEG) [62] |
| Depth of Measurement | Whole brain (cortical & subcortical) [10] | Cortical surface [62] | Outer cortex (1-2.5 cm) [62] |
| Tolerance to Motion | Low; requires participant immobility [10] | Low; susceptible to movement artifacts [62] | High; relatively robust to motion [62] [64] |
| Participant Preparation Time | Moderate | Moderate to High (applying gel/electrodes) [62] | Low (minimal skin contact) [62] |
| Ideal Research Context | Controlled lab, precise spatial localization [10] | Controlled lab, rapid neural dynamics [62] | Naturalistic settings, child development, clinical bedside [62] [64] |
The following diagram illustrates the primary decision-making pathway for modality selection based on core research priorities, incorporating the critical constraints of budget and logistics.
Experimental Protocols and Data Reproducibility
Protocol for fNIRS in Occupational Workload Studies
Objective: To measure prefrontal cortex (PFC) activation in response to cognitive demands in real-world settings [64]. Methodology:
- Participants: Healthy adults performing occupational tasks.
- Equipment: A multi-channel, portable fNIRS system with optodes placed over the PFC using the international 10-20 system for standardization [64].
- Task Design: Participants engage in task blocks of varying difficulty (e.g., low vs. high cognitive load) interspersed with rest blocks.
- Data Acquisition: Changes in oxygenated (HbO) and deoxygenated hemoglobin (HbR) concentrations are measured. A sampling rate of 2-10 Hz is typical [2].
- Analysis: Signals are bandpass filtered (e.g., 0.02-0.08 Hz for resting state). Statistical analyses compare HbO/HbR concentration changes across task conditions, with a focus on PFC channels [64].
Protocol for Simultaneous EEG-fNIRS Recording
Objective: To leverage complementary electrical and hemodynamic information for improved brain-state classification [2] [65] [7]. Methodology:
- Equipment Integration: An integrated cap houses both EEG electrodes and fNIRS optodes. A unified processor synchronizes data acquisition with microsecond precision [7].
- Synchronization: Hardware triggers (e.g., TTL pulses) align the onset of experimental paradigms across both systems.
- Data Processing:
- EEG: Data is filtered (e.g., 0.5-40 Hz), and artifacts (ocular, muscle) are removed.
- fNIRS: Optical density is converted to HbO and HbR concentrations, followed by motion artifact correction [2].
- Data Fusion: Joint analysis techniques, such as Canonical Correlation Analysis (CCA) or machine learning models like the multimodal EEG–fNIRS Representation-learning Model (EFRM), are applied to fuse the temporal features of EEG with the spatial features of fNIRS [65].
Key Considerations for Reproducibility
A major community initiative (FRESH) found that while fNIRS results are reproducible at the group level, variability in analysis pipelines (e.g., pruning choices, hemodynamic response modeling) can significantly impact individual-level results [33]. Reproducibility is highest among analysts with more experience and for hypotheses strongly supported by existing literature [33]. This underscores the need for standardized protocols and reporting, particularly for EEG and fNIRS.
The Scientist's Toolkit: Essential Research Reagents and Materials
Table 3: Essential Materials for Neuroimaging Experiments
| Item | Function & Application |
|---|---|
| fNIRS Optodes | Sources emit near-infrared light; detectors measure light attenuation after traveling through tissue. Placed on the scalp to measure hemodynamic changes [64]. |
| EEG Electrodes & Conductive Gel | Electrodes (e.g., Ag/AgCl) placed on the scalp measure electrical potentials. Conductive gel ensures a low-impedance connection for high-quality signal acquisition [62]. |
| MRI-Compatible fNIRS System | Specialized fNIRS hardware designed to operate within the high electromagnetic field of an MRI scanner, enabling simultaneous fMRI-fNIRS data collection [10]. |
| Integrated EEG-fNIRS Cap | A custom helmet or cap that pre-defines positions for both EEG electrodes and fNIRS optodes, ensuring proper co-registration and minimizing cross-modality interference [7]. |
| Digitization System | Used to record the 3D spatial positions of EEG electrodes and fNIRS optodes relative to scalp landmarks, which is critical for accurate source reconstruction and mapping to brain anatomy [2]. |
| Riemannian-Geometry Classifier | An advanced machine learning tool specifically adapted for fNIRS data that uses spatial co-activation patterns of HbO and HbR to significantly improve brain-state classification accuracy [66]. |
The choice between fMRI, EEG, and fNIRS is not a question of which modality is superior, but which is most appropriate for a given research context. fMRI remains the gold standard for spatial precision and whole-brain coverage but at a high financial and logistical cost, confining it to highly controlled laboratory settings. EEG is unparalleled for investigating the rapid temporal dynamics of neural processing but provides limited spatial detail and is sensitive to motion. fNIRS emerges as a powerful compromise, offering a favorable balance of moderate resolution, high portability, and robustness for studies requiring ecological validity, such as occupational workload assessment or clinical bedside monitoring [64] [63].
For research in design neurocognition, where understanding brain function in realistic, interactive scenarios is increasingly valuable, the portability and practicality of fNIRS present a compelling case. Furthermore, the synergistic potential of multimodal integration, particularly of EEG and fNIRS, offers a path forward to overcome the inherent limitations of any single technique, providing a richer, more comprehensive window into the workings of the human brain. Researchers must weigh these cost-benefit trade-offs against their specific scientific questions, participant populations, and operational constraints to make an informed and strategic investment in neuroimaging technology.
The field of design neurocognition research relies on neuroimaging tools to unravel the brain's response to various stimuli. For decades, functional magnetic resonance imaging (fMRI) has been a cornerstone technique, but its immobile nature has limited studies to highly controlled laboratory settings. The growing need for ecologically valid research—especially in applied fields like design cognition—has accelerated the adoption of portable technologies, primarily electroencephalography (EEG) and functional near-infrared spectroscopy (fNIRS). This transition represents more than mere technical convenience; it enables researchers to study brain function in real-world environments, capturing cognitive processes as they naturally occur during design activities, user testing, and creative tasks. This guide objectively compares the portability, setup, and experimental applications of fMRI, EEG, and fNIRS, providing researchers with the data needed to select appropriate methodologies for neurocognition studies.
Technical Specifications and Portability Comparison
The core differences between these neuroimaging modalities stem from their fundamental operating principles, which directly impact their portability and setup requirements. fMRI measures brain activity by detecting changes in blood oxygenation levels (the BOLD signal) associated with neural activity, requiring powerful magnetic fields and sophisticated infrastructure [10]. In contrast, EEG measures electrical activity generated by neuronal firing through electrodes placed on the scalp, while fNIRS uses near-infrared light to measure hemodynamic responses in the brain's cortex, similar to fMRI but restricted to superficial layers [10].
Table 1: Technical Specifications and Portability Comparison of Neuroimaging Technologies
| Feature | fMRI | EEG | fNIRS |
|---|---|---|---|
| Spatial Resolution | High (millimeter-level) [10] | Low (centimeter-level) [6] | Moderate (1-3 centimeters) [10] |
| Temporal Resolution | Low (0.33-2 Hz, limited by hemodynamics) [10] | High (millisecond-level) [10] | Moderate (millisecond to second-level) [10] |
| Portability | Immobile (fixed installation) to Portable (emerging low-field systems) [67] | Highly portable (wearable headsets) [68] [69] | Highly portable (wearable systems) [10] [70] |
| Setup Requirements | Dedicated shielded room, cryogenic cooling, reinforced flooring [67] | Minimal (headset with electrodes); conductive gel may be needed | Minimal (headset with sources/detectors); relatively quick [70] |
| Typical Setup Time | N/A (permanent installation) | 5-10 minutes for consumer headsets [69] | <5 minutes reported for some systems [70] |
| Key Portability Limitation | Extreme weight, magnetic shielding, infrastructure demands [67] | Subject to electrical noise in mobile environments [71] | Limited to cortical surface measurements (2-3 cm depth) [10] |
Table 2: Experimental Considerations for Design Neurocognition Research
| Consideration | fMRI | EEG | fNIRS |
|---|---|---|---|
| Naturalistic Paradigm Suitability | Low (highly restrictive environment) [10] | High (tolerant of movement) [71] | High (tolerant of movement) [10] [70] |
| Susceptibility to Artifacts | High sensitivity to motion artifacts [10] | Sensitive to muscle, eye movement, and electrical interference [6] | Low sensitivity to motion and electrical artifacts [70] |
| Participant Pool Limitations | Excludes those with metal implants, claustrophobia, or mobility issues [10] | Few limitations; suitable for diverse populations | Few limitations; suitable for diverse populations including infants [10] |
| Operational Noise | Very high (requires hearing protection) [10] | Silent operation | Silent operation [70] |
| Ideal Research Context | Basic research requiring precise spatial localization of deep brain structures [10] | Real-world cognitive monitoring, rapid neural dynamics, BCI applications [68] [71] | Naturalistic settings, rehabilitation studies, social interaction [10] [70] |
Recent advancements are gradually blurring these distinctions. Portable, low-field MRI systems represent a revolutionary development, though they remain far less portable than wearable options. These systems operate at lower field strengths (e.g., 0.064T for the Hyperfine Swoop) compared to traditional scanners (1.5T-3T), significantly reducing infrastructure needs and enabling point-of-care imaging [67]. Unlike traditional scanners requiring reinforced floors and magnetic shielding, portable systems like the Hyperfine Swoop are wheeled and can operate from standard power outlets [67]. However, their "portability" is relative—they are mobile within hospital settings rather than truly wearable by participants.
Experimental Protocols and Methodologies
The choice of neuroimaging technology directly shapes experimental design, participant experience, and the types of cognitive processes that can be effectively studied. Below are detailed methodologies for representative experiments using each modality, illustrating their distinct applications in research.
fMRI Protocol: Localizing Design-Cognition Networks
Objective: To precisely identify brain regions activated during visual design evaluation tasks. Participants: Typically 20-30 healthy adults with normal or corrected-to-normal vision. Setup and Equipment: 3T fMRI scanner (e.g., Siemens Magnetom Skyra), head coil, response button box, projector system with mirror for visual stimulus presentation [10] [72]. Procedure:
- Participant Preparation: Screen for metal implants/claustrophobia. Position participant in scanner with head stabilized. Provide ear protection.
- Structural Scan Acquisition: Collect high-resolution T1-weighted anatomical images (5-10 minutes).
- Functional Task Paradigm: Implement a block or event-related design. Example: alternating blocks of "Design Evaluation" (viewing product images) and "Baseline" (viewing scrambled images). Each block lasts 30 seconds, repeated 8-10 times. Total task duration: ~15 minutes.
- Data Acquisition: Acquire T2*-weighted BOLD images with EPI sequence (TR=2000ms, TE=30ms, voxel size=3x3x3mm).
- Data Analysis: Preprocessing (realignment, normalization, smoothing) followed by general linear model (GLM) analysis to identify voxels significantly active during design evaluation versus baseline.
Simultaneous EEG-fNIRS Protocol: Motor Imagery for Design Ideation
Objective: To investigate the neural correlates of motor imagery (e.g., mentally sketching a design) using multimodal sensing for improved signal classification [6] [71]. Participants: 20-30 right-handed healthy adults. Setup and Equipment:
- EEG System: 32-channel ActiCHamp system (Brain Products) with electrodes positioned over sensorimotor cortices (FC5, FC3, FC1, FC2, FC4, FC6, C5, C3, C1, Cz, C2, C4, C6, CP5, CP3, CP1, CPz, CP2, CP4, CP6) [71].
- fNIRS System: NIRScout XP system (NIRx) with 16 detectors and 16 LED sources (760 & 850 nm), creating channels over the same sensorimotor regions [71].
- Integration: Both systems installed on a single EasyCap, synchronized via hardware trigger. Procedure:
- Participant Preparation: Fit the integrated cap. Check impedances for EEG and signal quality for fNIRS. This setup can be completed in approximately 15-20 minutes [71].
- Task Paradigm: Block design consisting of: (a) Rest (30s); (b) Cue (5s); (c) Motor Imagery of left-hand drawing/sketching (15s); (d) Rest (30s). Repeat 20-30 trials.
- Data Acquisition: Record simultaneous EEG (sampling rate: 500 Hz) and fNIRS (sampling rate: 10 Hz) throughout the session.
- Data Analysis:
- EEG: Compute Event-Related Desynchronization (ERD) in the alpha (8-13 Hz) and beta (13-30 Hz) bands over the right motor cortex.
- fNIRS: Convert raw light intensity to concentration changes in oxygenated (HbO) and deoxygenated hemoglobin (HbR). Analyze HbO increases during imagery.
- Fusion: Apply methods like structured sparse multiset Canonical Correlation Analysis (ssmCCA) to identify components correlated across both modalities [6].
fNIRS with Virtual Reality Protocol: Naturalistic Design Evaluation
Objective: To measure prefrontal cortex activity during the evaluation of virtual prototypes in an immersive environment. Participants: 15-20 adults. Setup and Equipment:
- fNIRS System: Wearable system like the Artinis Brite Frontal [70].
- VR System: Head-Mounted Display (e.g., Oculus Rift, HTC Vive). Procedure:
- Setup: Apply the fNIRS headband first, ensuring good contact with the forehead. Then, carefully position the VR goggles over the fNIRS setup. Total setup time is reported to be under 5 minutes [70].
- Task: Participants freely explore different virtual design environments (e.g., architectural spaces, product models) for 3-5 minutes each, interspersed with baseline periods of viewing a neutral environment.
- Data Acquisition: Record fNIRS data (HbO and HbR) continuously throughout the VR exposure.
- Data Analysis: Preprocessing (filtering, motion artifact correction). Compare HbO concentration during design evaluation blocks versus baseline blocks using a general linear model.
Diagram 1: Workflow for simultaneous EEG-fNIRS data acquisition and analysis, adapted from multimodal motor imagery studies [6] [71].
Research Reagent Solutions: Essential Materials and Equipment
Successful execution of neuroimaging experiments requires specific hardware, software, and materials. The following table details key components for building a neuroimaging research platform.
Table 3: Essential Research Materials and Equipment for Neuroimaging Studies
| Item Category | Specific Examples | Function in Research |
|---|---|---|
| High-Field fMRI Scanner | Siemens Magnetom Skyra 3T [72], GE Signa Architect 3T [72] | Provides high-spatial-resolution images for precise localization of brain activity; ideal for foundational design-cognition mapping. |
| Portable/Low-Field MRI | Hyperfine Swoop (0.064T) [67] | Enables MRI in point-of-care, bedside, or mobile settings; reduces infrastructure and cost barriers while providing whole-brain imaging. |
| Research-Grade EEG | Neurosity Crown (8 channels) [69], Emotiv Insight (5 channels) [68] | Captures millisecond-level electrical brain activity for studying rapid cognitive processes; suitable for real-world and BCI applications. |
| Consumer-Grade EEG | Muse S (Gen 2) [68] [69], NeuroSky MindWave Mobile 2 [68] | Provides accessible, user-friendly platforms for basic neurofeedback, meditation, and large-scale longitudinal studies outside the lab. |
| fNIRS Systems | Artinis Brite Frontal [70], NIRScout XP [71] | Measures cortical hemodynamic activity with better motion tolerance than fMRI; ideal for naturalistic, interactive, and clinical settings. |
| Integrated EEG-fNIRS Caps | Custom EasyCap with EEG electrodes & fNIRS optodes [71] | Facilitates simultaneous multimodal data acquisition with precise sensor co-registration, crucial for data fusion analyses. |
| Stimulus Presentation Software | Presentation, E-Prime, Unity | Precisely controls the timing and delivery of visual, auditory, or tactile stimuli during experimental paradigms. |
| Data Analysis Suites | SPM, FSL, NIRS Brain AnalyzIR, EEGLAB, BCILAB, Homer2 | Provides tools for preprocessing, statistical analysis, and visualization of neuroimaging data, often in a standardized environment. |
The evolution from immobile fMRI scanners to wearable EEG and fNIRS systems has fundamentally expanded the scope of design neurocognition research. There is no single "best" technology; rather, the choice represents a trade-off between spatial resolution, temporal resolution, and ecological validity. fMRI remains unparalleled for mapping the precise spatial organization of brain networks involved in design cognition. In contrast, EEG and fNIRS offer the portability and practicality required for studying brain function in real-world contexts, such as during collaborative design sessions or while interacting with prototypes.
The future lies in multimodal integration, where the combined strengths of these technologies can overcome their individual limitations. Synchronous EEG-fNIRS recordings, as detailed in the protocols above, exemplify this approach, providing a richer picture of brain dynamics by capturing both electrical and hemodynamic activity simultaneously [6] [71]. Furthermore, the integration of these portable neuroimaging tools with virtual reality is opening new frontiers, allowing researchers to create controlled yet highly immersive and realistic design environments [70]. As portable technologies continue to advance and data fusion methods become more sophisticated, researchers will be increasingly equipped to decode the neural underpinnings of design thinking in authentic, real-world scenarios.
In the field of design neurocognition research, functional neuroimaging techniques such as functional magnetic resonance imaging (fMRI), electroencephalography (EEG), and functional near-infrared spectroscopy (fNIRS) provide invaluable windows into brain function. However, their differential susceptibility to motion artifacts presents a fundamental challenge that significantly impacts data quality, experimental design, and clinical application. Motion artifacts—unwanted signals generated by subject movement—can severely compromise data integrity and interpretation, necessitating specialized management strategies for each modality [73] [74].
This comparative analysis examines the inherent tolerance profiles of fMRI, EEG, and fNIRS concerning motion artifacts, detailing the specific strategies researchers employ to mitigate these challenges. Understanding these distinctions is crucial for selecting appropriate neuroimaging tools, particularly in studies involving naturalistic behaviors, clinical populations with motor symptoms, or experimental paradigms requiring movement—contexts highly relevant to design neurocognition research investigating real-world cognitive processes [15] [10].
Fundamental Differences in Signal Acquisition and Motion Vulnerability
The pronounced variation in motion artifact susceptibility among these three modalities stems from their fundamentally different physiological bases and physical measurement principles. fMRI measures brain activity indirectly through the blood-oxygen-level-dependent (BOLD) signal, which detects magnetic susceptibility changes associated with cerebral blood flow and oxygenation [15]. This process occurs within a powerful static magnetic field, where even millimeter-scale head movements can cause significant image distortions and signal loss [10]. The physical constraints of the scanner environment further exacerbate these issues, requiring near-complete subject immobility for optimal data quality.
In contrast, EEG measures electrical potentials generated by synchronized neuronal activity via electrodes placed on the scalp [1] [51]. This method provides direct, millisecond-scale tracking of neural dynamics but is exquisitely sensitive to motion artifacts. These artifacts arise from multiple sources, including electrode-skin interface disruptions, cable movements, and the generation of electrostatic signals by body movement [1]. Furthermore, muscle contractions from head, face, or jaw movements create myogenic artifacts that can overwhelm neural signals of interest, presenting a particularly challenging confound [51].
fNIRS occupies a middle ground, measuring hemodynamic responses through near-infrared light transmitted through biological tissues to assess concentration changes in oxygenated and deoxygenated hemoglobin [15] [75]. While fNIRS signals can be contaminated by motion-induced optode displacement and physiological confounds from systemic circulation, the technique demonstrates notably higher motion tolerance compared to both fMRI and EEG [15] [74]. This relative robustness, combined with its portability, makes fNIRS particularly suitable for studies requiring ecological validity or involving populations with limited movement control [6] [76].
Table 1: Fundamental Characteristics and Motion Vulnerability of Neuroimaging Modalities
| Feature | fMRI | EEG | fNIRS |
|---|---|---|---|
| Primary Signal Measured | BOLD contrast (magnetic susceptibility) | Electrical potentials from neuronal firing | Hemodynamic changes (HbO/HbR concentrations) |
| Spatial Resolution | High (millimeter-level) | Low (centimeter-level) | Moderate (1-3 cm) |
| Temporal Resolution | Low (0.1-2 Hz, limited by hemodynamic response) | Very high (millisecond precision) | Moderate (0.1-10 Hz) |
| Primary Motion Sources | Head movement within magnetic field, bulk body movement | Electrode displacement, cable motion, muscle activity, ocular artifacts | Optode displacement, hair interference, superficial blood flow changes |
| Inherent Motion Tolerance | Very low | Very low | Moderate to high |
Motion Artifact Management Strategies by Modality
fMRI Motion Mitigation Approaches
fMRI research employs multiple strategies to address motion sensitivity. Physical restraint using vacuum cushions, foam padding, and bite bars remains commonplace to minimize head movement [10]. Prospective motion correction techniques adjust imaging sequences in real-time based on head position monitoring, while post-processing algorithms mathematically correct for movement effects in acquired images [10]. Additionally, experimental design adaptations such as brief task intervals and careful subject instruction help reduce movement occurrences. Despite these approaches, fMRI remains largely incompatible with significant movement, restricting its utility for studying dynamic, naturalistic behaviors central to design neurocognition research [15].
EEG Motion Mitigation Approaches
EEG artifact management employs a multi-layered strategy beginning with preventive measures during setup: abrasive conductive gels reduce electrode impedance, secure caps minimize movement, and twisted cables reduce motion-induced electrostatic artifacts [1] [51]. Signal processing techniques form the core of EEG artifact correction, including:
- Regression-based methods that model and subtract artifact sources
- Blind source separation (e.g., Independent Component Analysis) to identify and remove components representing artifacts
- Adaptive filtering that uses reference signals to isolate and eliminate noise [51]
Despite these sophisticated approaches, complete artifact removal remains challenging, particularly for movements involving facial muscles or gross motor activity [1].
fNIRS Motion Mitigation Approaches
fNIRS benefits from both hardware and algorithmic solutions for motion artifact management. Hardware-based approaches include:
- Accelerometer integration to detect movement and guide artifact rejection
- Robust probe designs with flexible mounting and improved scalp contact
- Collodion-fixed optical fibers to enhance stability [74]
Algorithmic solutions demonstrate particular sophistication in fNIRS processing:
- Moving average and wavelet-based methods identify and correct motion-induced signal spikes
- Kalman filtering adaptively estimates and removes artifacts
- Principal component analysis separates physiological signals from motion artifacts
- Targeted motion artifact removal algorithms (e.g., ABAMAR, ABMARA, BLISSA2RD) leverage accelerometer data for precise correction [73] [74]
This diverse toolkit enables fNIRS to maintain signal quality during movements such as walking, speaking, and even upper limb actions, making it uniquely suitable for ecologically valid study designs [6] [76].
Table 2: Motion Artifact Management Techniques Across Modalities
| Method Category | Specific Techniques | Effectiveness & Limitations |
|---|---|---|
| fMRI Physical Restraint | Head coils, vacuum cushions, bite bars | Limited effectiveness; patient discomfort; cannot eliminate all motion |
| fMRI Computational Correction | Prospective motion correction, image registration | Can partially restore data quality; may not address spin history effects |
| EEG Preventive Measures | Abrasive conductive gels, secure caps, twisted cables | Reduces but doesn't eliminate artifacts; time-consuming setup |
| EEG Signal Processing | ICA, regression methods, adaptive filtering | Effective for some artifacts; risk of neural signal removal; computationally intensive |
| fNIRS Hardware Solutions | Accelerometers, flexible probes, collodion-fixed fibers | Direct motion detection; adds complexity to setup; limited correction alone |
| fNIRS Algorithmic Solutions | Wavelet filtering, Kalman filtering, PCA, targeted algorithms | High effectiveness for retained signals; requires parameter optimization |
Experimental Evidence and Comparative Studies
Recent research provides compelling evidence regarding the motion tolerance of fNIRS compared to other modalities. A 2023 study successfully combined fNIRS and EEG to investigate neural activity during motor execution, observation, and imagery—paradigms that would prove challenging in an fMRI environment due to movement restrictions [6]. The study demonstrated fNIRS's capability to capture hemodynamic responses in parietal regions during actual movement, with simultaneous EEG recording providing complementary electrical activity data [6].
In clinical contexts, fNIRS has enabled awareness detection in patients with disorders of consciousness (DoC), where motor impairments preclude traditional fMRI or EEG assessments. A 2025 study achieved 100% sensitivity and 89% specificity in differentiating responsive states using fNIRS, highlighting its clinical applicability where motion tolerance is essential [76]. Similarly, fNIRS applications in schizophrenia research capitalize on its resistance to motion interference, allowing monitoring of prefrontal cortex hemodynamics during cognitive tasks in patients who may struggle to remain still [75].
A systematic comparison of motion artifact removal techniques for fNIRS, covering 51 studies, identified wavelet-based methods and accelerometer-guided approaches as particularly effective, with quantitative metrics showing significant signal-to-noise ratio improvements across movement conditions [74]. This robust methodological framework supports fNIRS implementation in studying dynamic processes relevant to design neurocognition, such as human-product interactions, environmental explorations, and embodied cognition scenarios.
Decision Framework for Modality Selection
Choosing the appropriate neuroimaging modality requires balancing motion tolerance with measurement requirements. fMRI remains optimal for studies requiring precise spatial localization of deep brain structures when subjects can remain nearly motionless [10]. EEG is indispensable for investigating neural dynamics with millisecond temporal precision in controlled settings where minimal movement occurs [1] [51].
fNIRS emerges as the preferred modality when studying cognitive processes during:
- Naturalistic movements and real-world interactions
- Clinical populations with motor symptoms or restlessness
- Pediatric and infant studies involving natural behavior
- Paradigms requiring seated or walking tasks
- Long-duration monitoring where subject comfort is essential [15] [75] [76]
For comprehensive investigation of brain function, multimodal approaches combining fNIRS with EEG leverage their complementary strengths—fNIRS provides robust hemodynamic measures during movement, while EEG offers millisecond-scale electrical activity recording [1] [51] [6]. Integrated systems using compatible caps and synchronized data acquisition facilitate such multimodal research, though careful experimental design is necessary to manage the increased complexity [1] [6].
Diagram 1: Neuroimaging modality selection workflow based on motion requirements and research objectives. This decision framework helps researchers select the most appropriate technique based on their specific experimental needs and subject population considerations.
Table 3: Key Research Solutions for Motion Artifact Management
| Tool/Solution | Primary Function | Application Context |
|---|---|---|
| Integrated fNIRS-EEG Systems | Simultaneous electrical and hemodynamic monitoring | Multimodal studies requiring both temporal and spatial information [1] [6] |
| Structured Sparse Multiset CCA (ssmCCA) | Data fusion technique for multimodal integration | Identifying brain regions consistently detected by fNIRS and EEG [6] |
| Accelerometer-Guided Artifact Removal | Motion detection and correction using inertial sensors | fNIRS studies with significant movement [73] [74] |
| Wavelet-Based Decomposition | Signal processing to isolate and remove motion artifacts | fNIRS data corrupted by movement [73] [74] |
| Independent Component Analysis (ICA) | Blind source separation for artifact identification | EEG and fNIRS data cleaning [51] [74] |
| Riemannian-Geometry Classification | Covariance-based pattern recognition for state classification | fNIRS-based diagnosis in clinical populations [76] |
Motion artifact management remains a fundamental consideration in neuroimaging research, directly influencing modality selection, experimental design, and data interpretation. Each technique—fMRI, EEG, and fNIRS—possesses characteristic motion sensitivity profiles requiring specialized mitigation strategies. While fMRI offers unparalleled spatial resolution but demands near-complete immobility, and EEG provides exceptional temporal resolution with significant motion vulnerability, fNIRS occupies a crucial niche with its balanced spatial-temporal capabilities and superior motion tolerance.
For design neurocognition research investigating real-world behaviors, fNIRS presents particular advantages, enabling brain activity monitoring during natural movements and interactions. The continued development of sophisticated artifact management algorithms, combined with multimodal approaches that leverage the complementary strengths of different techniques, promises to further expand the boundaries of neuroimaging into increasingly ecologically valid contexts. By strategically matching modality capabilities to research questions while implementing appropriate artifact mitigation strategies, researchers can reliably investigate the neural correlates of cognition across diverse populations and settings.
In design neurocognition research, non-invasive neuroimaging techniques like functional magnetic resonance imaging (fMRI), electroencephalography (EEG), and functional near-infrared spectroscopy (fNIRS) provide crucial windows into brain function. However, the signals these modalities detect are vulnerable to contamination from various physiological and environmental sources. This contamination, known as technical noise, can obscure genuine neural signals and compromise data integrity if not properly addressed. Effective noise management is therefore not merely a technical detail but a fundamental prerequisite for valid research conclusions [10] [39].
Each neuroimaging modality interacts differently with the body's physiology and environment. fMRI's high magnetic fields are sensitive to cardiorespiratory cycles and subject movement, while EEG's exquisite sensitivity to electrical potentials makes it vulnerable to muscle activity and even line noise from power sources [77] [78]. fNIRS, though more robust to motion, contends with systemic physiological noise from scalp blood flow and variable optode-scalp coupling [79] [24]. Understanding these modality-specific vulnerabilities enables researchers to select appropriate tools for their experimental questions and implement effective noise mitigation strategies, thereby ensuring the reliability of neurocognitive findings in design research.
Comparative Analysis of Noise Profiles
Table 1: Comparison of Primary Noise Sources Across Neuroimaging Modalities
| Noise Category | fMRI | EEG | fNIRS |
|---|---|---|---|
| Cardiac Noise | Significant source (∼33% of physiological noise in GM); causes pulsatile motion [77] | Cardiogenic artifacts (e.g., ECG signals); especially prominent in infants/obese patients [78] | Cardiac cycle causes pulsatile scattering; typically removed via band-stop filtering [39] |
| Respiratory Noise | Bulk susceptibility modulations; causes magnetic field fluctuations [77] | Minimal direct impact | Respiration cycle induces low-frequency oscillations in hemodynamics [39] |
| Motion Artifacts | Severe sensitivity; requires strict head immobilization [10] | Head/body movements modify drift & low frequencies [78] | High tolerance; major concern is optode-scalp decoupling [10] [24] |
| Environmental Noise | Electromagnetic interference from external equipment | 50/60 Hz power line interference; other EM equipment [78] | Generally resilient to electromagnetic interference [7] |
| Physiological (Non-Neural) | Low-frequency CO₂ effects from ventilatory volume changes [77] | Ocular artifacts (blinks, eye movements); muscular artifacts (jaw clenching) [78] | Systemic physiology from scalp/skin; harder to separate from brain signal [79] [39] |
Table 2: Signal Quality and Noise Management Capabilities
| Parameter | fMRI | EEG | fNIRS |
|---|---|---|---|
| Temporal Resolution | Low (∼0.3-2 Hz) [10] | Very High (Milliseconds) [24] | Moderate (∼0.1-10 Hz) [24] |
| Spatial Resolution | High (mm-level) [10] | Low (Source localization challenges) [24] | Moderate (1-3 cm) [10] [24] |
| Primary Signal | Blood Oxygenation Level Dependent (BOLD) - reflects HbR [10] [39] | Electrical potentials from neuronal firing [7] | Concentration changes in HbO and HbR [24] [39] |
| Common Noise Reduction Methods | RETROICOR, HRAN, ICA/PCA [77] [80] | High-pass filtering, ICA, visual inspection [81] | Short-separation regression, wavelet filtering, SCI/Phoebe metrics [79] [39] |
| Portability & Motion Tolerance | Low; requires stationary, controlled environment [10] | Moderate; sensitive to motion but portable systems exist [24] | High; suitable for naturalistic, dynamic settings [10] [24] |
Experimental Protocols for Noise Mitigation
Protocol: Physiological Noise Removal in Fast fMRI
Objective: To suppress cardiac and respiratory noise in fast fMRI data without external monitoring, enabling cleaner detection of sub-second neural dynamics [80].
Background: Traditional fMRI has a temporal resolution of 2-4 seconds, which causes aliasing of higher-frequency physiological noise. Fast fMRI techniques (e.g., Inverse Imaging) achieve sub-second temporal resolution, allowing physiological signals to be fully sampled rather than aliased. The Harmonic Regression with Autoregressive Noise (HRAN) model exploits this to directly estimate and remove noise from the fMRI signal itself [80].
Method Steps:
- Data Acquisition: Acquire fMRI data with a high temporal sampling rate (TR < 1 second) to satisfy the Nyquist criterion for cardiac (∼1 Hz) and respiratory (∼0.3 Hz) frequencies [77] [80].
- Model Construction: The HRAN model is formulated as a joint statistical model:
Y(t) = N(t) + P(t) + ε(t)Where:Y(t)is the acquired BOLD signal.N(t)is the neural-related hemodynamic response.P(t)is the physiological noise component (cardiac and respiratory).ε(t)is the autocorrelated noise.
- Noise Estimation: Directly estimate the
P(t)component from the fast-fMRI data by tracking the harmonic components of the known physiological frequencies and their aliases over time, without needing external pulse oximeter or respirometer recordings [80]. - Signal Cleaning: Fit the joint model to the data and subtract the estimated
P(t)to obtain a cleaned neural signalN(t).
Outcome: This approach has been shown to improve the statistical inference of task-driven neural activity compared to gold-standard methods like RETROICOR that require external physiological monitoring [80].
Protocol: Automated Bad Channel Detection in fNIRS
Objective: To automatically identify and reject low-quality fNIRS channels ("bad channels") that cannot be recovered through standard processing, thereby preventing bias in downstream analysis [79].
Background: Bad channels in fNIRS are often caused by poor optode-scalp contact, hair obstruction, or hardware failure. Relying on manual expert inspection is time-consuming and subjective, a problem exacerbated by increasing channel counts in modern systems. Machine learning offers a scalable and objective alternative [79].
Method Steps:
- Feature Extraction: Compute multiple signal quality metrics for each fNIRS channel. Common metrics include:
- Scalp Coupling Index (SCI): Measures the agreement between the cardiac rhythms in the HbO and HbR signals, indicating good scalp coupling [79].
- Coefficient of Variation (CoV): Assesses signal stability.
- Peak Power: Identifies channels with abnormally high power, often indicative of motion artifacts or poor contact [79].
- Model Application: Feed the extracted features into a detection algorithm. The recently developed NiReject framework offers three machine-learning approaches [79]:
- Unsupervised: Uses algorithms like Isolation Forest to detect anomalous channels without pre-labeled data.
- Semi-Supervised: Uses partially labeled data to enhance detection (e.g., Semi-supervised NiReject), typically yielding the highest performance.
- Hybrid: Incorporates a minimal human feedback loop to refine the automated detection, balancing effort and accuracy.
- Channel Rejection: Channels flagged as "bad" by the model are pruned (excluded) from subsequent group-level analysis or targeted for interpolation.
Outcome: Automated detection, particularly semi-supervised methods, outperforms traditional threshold-based methods (like using SCI alone) and reduces the risk of false positives, leading to more reliable group analyses [79].
Protocol: Optimizing EEG Preprocessing for ERP Significance
Objective: To identify a preprocessing pipeline that maximizes the statistical power for detecting event-related potential (ERP) differences between experimental conditions, rather than relying solely on convention [81].
Background: EEG preprocessing involves numerous steps (filtering, referencing, artifact rejection), but there is little consensus on the optimal pipeline. A data-driven approach assesses pipeline efficacy based on the outcome of interest—the strength of the brain response to an experimental manipulation [81].
Method Steps:
- Data Epoching: Segment continuous EEG data into epochs around stimulus onset (e.g., -1 to 2 seconds) without applying a baseline removal initially [81].
- High-Pass Filtering: Apply a high-pass filter. Empirical evidence suggests a cutoff between 0.1 Hz and 0.5 Hz often maximizes the number of significant channels in the ERP, a crucial step for improving signal-to-noise ratio. Avoid overly aggressive filtering (e.g., >1 Hz) which can distort signals [81].
- Line Noise Removal: Use cautious methods for 50/60 Hz noise. Simple notch filtering may have minimal effect, while more complex methods (e.g., Zapline-plus) can sometimes be detrimental. A robust alternative is to identify and interpolate only the specific channels with excessively high line noise (e.g., >4 standard deviations above the mean) [81].
- Referencing: Evaluate the need for re-referencing carefully. Studies have found that common re-referencing methods (e.g., average, mastoid, REST) can sometimes decrease the number of significant ERP channels. Using the original recording reference may be preferable in some cases [81].
- Artifact Rejection: Use automated methods (e.g., based on amplitude thresholds) to reject bad epochs or channels. However, note that advanced automated ICA rejection for ocular and muscle artifacts has not shown consistent reliability in improving ERP significance across all datasets [81].
Outcome: This empirical approach yields a pipeline that maximizes the detectability of the neural phenomenon under investigation. A minimalist pipeline (appropriate high-pass filtering and limited channel interpolation) often outperforms complex preprocessing chains [81].
Visualization of Noise and Signal Processing Pathways
Table 3: Key Resources for Neuroimaging Noise Management
| Resource / Tool | Primary Function | Application Context |
|---|---|---|
| HRAN Model | Statistical model for removing cardiac/respiratory noise from fast fMRI data without external monitors [80] | fMRI studies requiring high temporal resolution |
| NiReject Framework | Machine learning-based (semi-supervised) tool for automated detection of bad channels in fNIRS data [79] | Quality control for fNIRS studies with high channel counts |
| Scalp Coupling Index (SCI) | Metric to assess optode-scalp contact quality by quantifying cardiac signal correlation between HbO/HbR [79] | fNIRS setup validation and channel quality assessment |
| RETROICOR Algorithm | Model-based method for physiological noise removal in fMRI, using external cardiac/respiratory recordings [77] | Standard fMRI physiological noise correction |
| Inverse Imaging (InI) | High-speed MRI acquisition technique that allows sufficient temporal sampling to avoid physiological noise aliasing [77] | Enabling effective digital filtering of physiological noise in fMRI |
| Visual Inspection & Inter-Rater Agreement | Gold standard for manual artifact identification and rejection in EEG, though time-consuming [81] | EEG/ERP preprocessing, particularly for defining ground truth |
The pursuit of clean neural signals in fMRI, EEG, and fNIRS is a multifaceted challenge that requires a deep understanding of each modality's inherent vulnerabilities. As this guide illustrates, the most effective noise mitigation strategies are often technique-specific, leveraging the unique characteristics of the signal and noise in each case. The choice of neuroimaging tool for design neurocognition research must therefore balance the core experimental question with a pragmatic assessment of the noise environment and the available tools to manage it.
Future directions in technical noise reduction point toward greater automation and intelligence. Machine learning models, like those used in fNIRS bad channel detection, are poised to play a larger role across all modalities by learning complex noise patterns directly from data [79]. Furthermore, the integration of multiple modalities, such as fNIRS-EEG or fMRI-fNIRS systems, allows for complementary data streams where one modality can help validate or correct the other, leading to a more robust interpretation of underlying brain activity [10] [7]. For the researcher, this evolving landscape underscores the importance of a principled and evidence-based approach to signal quality, ensuring that the conclusions drawn about brain function are built upon a foundation of reliable data.
The quest to understand the intricate functions of the human brain requires multimodal approaches that integrate complementary neuroimaging techniques. Functional magnetic resonance imaging (fMRI), electroencephalography (EEG), and functional near-infrared spectroscopy (fNIRS) each provide unique windows into brain activity, yet each modality possesses distinct strengths and limitations in spatial resolution, temporal resolution, and operational flexibility. Combining these technologies presents significant hardware integration challenges that must be overcome to leverage their synergistic potential fully. The integration of fMRI's high spatial resolution with fNIRS's superior temporal resolution and portability enables robust spatiotemporal mapping of neural activity, validated across motor, cognitive, and clinical tasks [5]. Similarly, EEG provides favorable temporal resolution while fNIRS offers better spatial resolution and robustness to noise, creating a compelling ground for multimodal integration [23].
The fundamental rationale for combining these modalities rests on the physiological phenomenon of neurovascular coupling within the brain—the close temporal and regional linkage between neural activity (measured by EEG) and cerebral blood flow responses (measured by fMRI and fNIRS) [23]. When neurons activate within a specific brain region, blood flows to that region to meet increased metabolic demands, resulting in measurable fluctuations in hemoglobin concentration that can be detected by fNIRS and fMRI, while EEG directly captures the electrical activity underlying these processes [23] [2]. This relationship forms the theoretical foundation for integrated multimodal imaging of brain activity. This article examines the specific hardware integration challenges encountered when simultaneously deploying fMRI, EEG, and fNIRS systems, compares current integration solutions, and provides detailed experimental methodologies for researchers pursuing multimodal neuroimaging approaches in design neurocognition research.
Technical Comparative Analysis of Neuroimaging Modalities
Understanding the fundamental technical characteristics of each neuroimaging modality is essential for addressing integration challenges. Each technique captures different aspects of neural activity with varying spatial and temporal precision, operational constraints, and data output characteristics. The following comparative analysis highlights the core technical specifications that both enable and complicate their integration.
Table 1: Technical Comparison of fMRI, EEG, and fNIRS Neuroimaging Modalities
| Parameter | fMRI | EEG | fNIRS |
|---|---|---|---|
| Spatial Resolution | Millimeter-level (high) [5] | Centimeters (low) [23] | 1-3 centimeters (moderate) [5] |
| Temporal Resolution | 0.33-2 Hz (slow) [5] | Millisecond-level (very high) [23] | Up to 10 Hz (moderate) [2] |
| Penetration Depth | Whole-brain (including subcortical) [5] | Cortical surface [23] | Superficial cortex (1-2 cm) [5] |
| Measured Signal | Blood Oxygen Level Dependent (BOLD) [5] | Electrical potentials from synchronized pyramidal neurons [23] | Concentration changes of oxygenated (HbO) and deoxygenated hemoglobin (HbR) [23] |
| Portability | Low (requires fixed scanner) [5] | High (portable systems available) [23] | High (wearable systems available) [5] |
| Operation Environment | Restricted scanner environment [5] | Various environments (lab, naturalistic) [23] | Various environments (lab, naturalistic, bedside) [5] |
| Cost | High [5] | Moderate [53] | Moderate [53] |
| Susceptibility to Motion Artifacts | High [5] | High [23] | Moderate (relatively robust) [23] |
| Physical Interference | Magnetic field interference | Electromagnetic interference | Minimal interference |
The complementary nature of these technical characteristics provides the foundation for multimodal integration. fMRI offers unparalleled spatial resolution and deep brain coverage but suffers from poor temporal resolution and restrictive operating environments. EEG delivers exceptional temporal resolution for capturing rapid neural dynamics but provides limited spatial localization. fNIRS strikes a balance with moderate spatial and temporal resolution while offering superior portability and resistance to motion artifacts [23] [5]. The combination of these modalities enables researchers to overcome individual limitations, creating a more comprehensive picture of brain activity across different temporal and spatial scales.
Hardware Integration Challenges and Solution Approaches
Electromagnetic Interference in fMRI Environments
The high-strength magnetic fields within fMRI environments present significant challenges for integrating electronic recording equipment. EEG systems face particular difficulties due to their high sensitivity to electromagnetic interference, which can manifest as gradient-induced artifacts and ballistocardiographic effects in simultaneous recordings [5]. Similarly, fNIRS systems incorporating electronic components may experience interference unless specifically designed for MRI compatibility.
Solution approaches include:
- Using specialized MRI-compatible EEG systems with carbon fiber electrodes and non-magnetic components
- Implementing fiber-optic fNIRS systems that eliminate electronic components near the scanner
- Employing advanced artifact removal algorithms that leverage simultaneous recording to identify and subtract interference [5]
- Physical separation of control electronics from the MRI bore with extended fiber-optic cabling
Physical Integration and Probe Co-Localization
Simultaneous data acquisition requires precise physical integration of recording components without compromising signal quality or participant comfort. For combined EEG-fNIRS systems, this involves designing headgear that accommodates both electrodes and optodes while maintaining proper scalp contact and accurate spatial co-registration [53].
Solution approaches include:
- Customized 3D-printed helmets that accommodate individual head morphology and ensure consistent probe placement [53]
- Integration of fNIRS optodes into standard EEG electrode caps with precise perforations and mounting solutions [53]
- Composite polymer cryogenic thermoplastic sheets that can be custom-molded to individual head shapes for improved fit [53]
- Spring-loaded grommets in fNIRS systems to ensure consistent scalp contact pressure, particularly through hair [82]
Table 2: Hardware Integration Methods for Multimodal Systems
| Integration Method | Implementation Approach | Advantages | Limitations |
|---|---|---|---|
| Sequential Recording | Separate data acquisition sessions | Simple implementation; avoids hardware interference | Assumes brain state consistency between sessions; no true simultaneity |
| Synchronous Acquisition | Unified processor for simultaneous EEG-fNIRS recording [53] | Precise temporal synchronization; streamlined analysis | Complex system design; potential electromagnetic interference |
| Separate Synchronized Systems | NIRScout and BrainAMP systems synchronized via host computer [53] | Modular flexibility; uses optimized individual systems | Potential microsecond-level synchronization imprecision |
| fMRI-Compatible Design | Fiber-optic fNIRS and carbon-fiber EEG in MRI environment [5] | Enables truly simultaneous multimodal acquisition | High cost; specialized equipment requirements |
Synchronization and Data Acquisition Challenges
Precise temporal alignment of data streams across modalities is essential for meaningful multimodal analysis. The varying sampling rates and inherent physiological latencies between electrical and hemodynamic signals create significant synchronization challenges.
Solution approaches include:
- Hardware-level synchronization using TTL pulses and trigger signals to align data streams with millisecond precision [53]
- Ethernet messaging between systems to establish common timestamps [83]
- Unified acquisition software that simultaneously processes and acquires EEG and fNIRS signals [53]
- Common clock systems that ensure consistent timing across all recording modalities
Multimodal Data Acquisition Workflow
Experimental Protocols for Multimodal Data Acquisition
Simultaneous EEG-fNIRS Motor Imagery Protocol
Motor imagery tasks provide an excellent paradigm for studying complementary neural processes captured by EEG and fNIRS. The following protocol is adapted from a study investigating structure-function relationships in brain networks using simultaneous EEG and fNIRS [2].
Experimental Design:
- Participants: 18 healthy adults (28.5 ± 3.7 years)
- Recording Setup: 30 EEG electrodes placed according to international 10-5 system (sampled at 1000 Hz, down-sampled to 200 Hz) and 36 fNIRS channels (14 sources, 16 detectors with 30mm inter-optode distance) following the 10-20 system (sampled at 12.5 Hz, down-sampled to 10 Hz) [2]
- Protocol: 1-minute resting state recording followed by 30 trials of 10-second left and right-hand motor imagery tasks
- Task Instructions: Participants imagined performing specific hand movements without actual physical execution
Data Processing Pipeline:
- Optical Density Transformation: Raw fNIRS signals converted to optical density
- Signal Quality Assessment: Scalp-coupling index (SCI) applied to fNIRS data; exclusion of subjects with >50% channels showing SCI < 0.7
- Filtering: fNIRS signals bandpass filtered (0.02-0.08 Hz) using finite impulse response (FIR) filter
- Motion Artifact Identification: Global variance in temporal derivative (GVTD) metric used to identify and reject segments with excessive head movements
- Physiological Noise Removal: Principal component analysis (PCA) applied to remove components with high spatial uniformity value indicative of superficial skin responses [2]
Key Findings: The study revealed that fNIRS structure-function coupling resembles slower-frequency EEG coupling at rest, with variations across brain states and oscillations. Locally, the relationship showed greater coupling in the sensory cortex and increased decoupling in the association cortex [2].
Semantic Decoding Using Simultaneous EEG-fNIRS
This protocol examines semantic category discrimination during mental imagery tasks, highlighting the complementary strengths of EEG and fNIRS for decoding higher-order cognitive processes [31].
Experimental Design:
- Participants: 12 right-handed native English speakers (3 males, 9 females, mean age 32.75 years)
- Recording Setup: Simultaneous EEG and fNIRS recordings during silent naming of imagined animals and tools
- Mental Tasks:
- Silent naming: Participants silently named displayed objects
- Visual imagery: Participants visualized objects in their minds
- Auditory imagery: Participants imagined sounds associated with objects
- Tactile imagery: Participants imagined feeling of touching objects
- Stimuli: 18 animals and 18 tools presented as gray-scale images on white background
- Trial Structure: 3-second engagement periods for each mental task with randomized block order
Methodological Considerations: Participants were instructed to minimize physical movements, including eye movements, facial expressions, and head or body motions during mental tasks to reduce motion artifacts in both EEG and fNIRS recordings [31].
Multilayer Network Analysis Protocol
This advanced analytical approach integrates EEG and fNIRS data within a unified framework to capture both electrophysiological and hemodynamic aspects of brain network organization [84].
Experimental Framework:
- Data Acquisition: Simultaneous EEG-fNIRS recordings during resting state and task conditions
- Network Construction: Functional connectivity matrices derived separately for EEG and fNIRS data
- Multilayer Integration: Combined network model incorporating both modalities as separate layers with inter-layer connections
- Analysis Metrics: Small-world network structure assessment, modularity analysis, and cross-layer information transfer quantification
Key Findings: The multilayer approach outperformed unimodal analyses, offering a richer understanding of brain function. Complementarity between EEG and fNIRS was observed, particularly during tasks, with EEG capturing faster changes in neural activity and fNIRS providing insights into slower hemodynamic responses associated with sustained neural processes [84].
Table 3: Experimental Protocols for Multimodal Neuroimaging
| Protocol | Primary Modalities | Experimental Paradigm | Key Measurements | Applications |
|---|---|---|---|---|
| Motor Imagery | EEG, fNIRS [2] | Hand movement imagination | HbO/HbR concentration changes; EEG rhythm desynchronization | Brain-computer interfaces, stroke rehabilitation |
| Semantic Decoding | EEG, fNIRS [31] | Silent naming, sensory imagery | Category-specific neural patterns; hemodynamic responses | Communication BCIs, cognitive neuroscience |
| Resting-State Connectivity | fMRI, fNIRS [5] | Quiet rest with eyes open | Low-frequency fluctuations in BOLD/fNIRS signals | Functional connectivity mapping, clinical biomarkers |
| Multilayer Network Analysis | EEG, fNIRS [84] | Rest and task conditions | Functional connectivity within and between modalities | Network neuroscience, brain state classification |
The Scientist's Toolkit: Research Reagent Solutions
Implementing successful multimodal neuroimaging research requires specific hardware and software solutions designed to address integration challenges. The following toolkit outlines essential components for simultaneous data acquisition.
Table 4: Essential Research Reagents for Multimodal Neuroimaging
| Tool Category | Specific Product/Solution | Function | Compatibility Considerations |
|---|---|---|---|
| fNIRS Systems | NIRx NIRS systems [82] | Hemodynamic response measurement | MRI-compatible versions available; modular design for co-registration with EEG |
| EEG Systems | Brain Products, BioSemi, Neuroscan [83] | Electrical activity recording | MRI-compatible versions; synchronization capabilities with fNIRS |
| Eye Tracking | EyeLink 1000 Plus, Portable Duo [83] | Monitor participant engagement and eye movements | Synchronization with EEG/fNIRS; head-free-to-move mode to avoid interference |
| Stimulus Presentation | SR Research Experiment Builder [83] | Precise delivery of experimental paradigms | Integrated event markers for EEG/fNIRS synchronization; template tasks |
| Synchronization Interfaces | TTL pulse generators, Ethernet messaging systems [53] | Temporal alignment of multimodal data streams | Hardware-level precision; compatibility across manufacturer systems |
| Custom Headgear | 3D-printed helmets, thermoplastic sheets [53] | Secure, co-registered positioning of EEG electrodes and fNIRS optodes | Individualized fit; maintenance of consistent probe contact pressure |
| Data Analysis Platforms | MNE toolbox, Brainstorm software [2] | Integrated processing of multimodal datasets | Support for heterogeneous data formats; specialized artifact removal algorithms |
The integration of fMRI, EEG, and fNIRS for simultaneous multimodal data acquisition presents significant but surmountable hardware challenges. Current solutions include specialized MRI-compatible components, custom headgear for precise probe co-localization, sophisticated synchronization interfaces, and advanced analytical approaches that leverage the complementary nature of these modalities. The multilayer network model represents a promising framework for integrating EEG and fNIRS data, having demonstrated superiority over unimodal analyses in capturing the complex dynamics of brain function [84].
Future developments in multimodal neuroimaging hardware will likely focus on several key areas. First, continued innovation in MRI-compatible sensor technology will reduce interference artifacts in simultaneous fMRI-EEG and fMRI-fNIRS recordings. Second, standardized integration platforms with plug-and-play compatibility between different manufacturers' systems would significantly lower the technical barriers to multimodal research. Third, miniaturization and wireless technology will enhance the ecological validity of multimodal recordings, particularly for fNIRS-EEG combinations in naturalistic settings. Finally, machine learning approaches for automated artifact removal and data fusion will extract more meaningful information from complex multimodal datasets [5].
As these technologies mature, simultaneous multimodal neuroimaging will become increasingly accessible to researchers studying brain function in both health and disease. By overcoming current hardware integration challenges, the neuroscience community moves closer to a comprehensive understanding of the brain's intricate dynamics across multiple spatial and temporal scales.
Head-to-Head Comparison: Validating Spatial Specificity, Sensitivity, and Clinical Utility
Spatial resolution is a fundamental metric that defines the ability of a neuroimaging technique to localize neural activity within the brain. For researchers in design neurocognition and drug development, understanding the spatial capabilities and limitations of different imaging modalities is crucial for experimental design, data interpretation, and translating findings into practical applications. Functional Magnetic Resonance Imaging (fMRI), Electroencephalography (EEG), and functional Near-Infrared Spectroscopy (fNIRS) each offer distinct spatial profiling characteristics, making them suited to different research scenarios. fMRI provides comprehensive whole-brain coverage including subcortical structures, while fNIRS offers cortical mapping with better motion tolerance, and EEG delivers millisecond-scale temporal resolution despite spatial constraints. This article provides a detailed comparison of these three prominent non-invasive neuroimaging techniques, focusing specifically on their spatial resolution characteristics, supported by current experimental data and methodological protocols to guide selection for neurocognitive research.
Fundamental Spatial Characteristics at a Glance
The table below summarizes the core spatial resolution properties of fMRI, fNIRS, and EEG based on current literature and experimental findings.
Table 1: Spatial Resolution Characteristics of Major Neuroimaging Modalities
| Characteristic | fMRI | fNIRS | EEG |
|---|---|---|---|
| Spatial Resolution | 1-3 mm (high) [10] | 1-3 cm (moderate) [85] [10] | >2 cm (low) [31] [86] |
| Temporal Resolution | 1-2 Hz (slow) [10] | ~100 ms (moderate) [85] | <1 ms (very high) [85] |
| Depth Penetration | Whole brain (cortical & subcortical) [10] | Superficial cortex (1-2.5 cm) [85] [10] | Cortical surface [85] |
| Primary Signal Measured | BOLD (blood oxygenation) [87] | Hemodynamic response (HbO/HbR) [85] [88] | Electrical potentials [85] [89] |
| Key Spatial Limitation | Limited to hemodynamic response | Superficial coverage only [10] | Skull/scalp signal dispersion [85] [86] |
fMRI: Gold Standard in Spatial Localization
Fundamental Spatial Capabilities
Functional MRI provides the most comprehensive spatial mapping capabilities among non-invasive neuroimaging techniques, offering both high spatial resolution (1-3 mm) and whole-brain coverage including subcortical structures such as the hippocampus, amygdala, and thalamus [10]. This extensive coverage enables researchers to investigate network interactions across the entire brain, which is particularly valuable for studying complex cognitive functions and neurological disorders that involve distributed neural circuits [10]. The technique's spatial precision allows for detailed localization of brain regions involved in specific cognitive, sensory, and motor tasks, making it indispensable for establishing neural correlates of various cognitive processes.
Experimental Evidence and Methodological Advances
Recent methodological innovations have further enhanced fMRI's spatial specificity. A 2025 study introduced the CortiLag-ICA framework, which differentiates neurogenic BOLD signals from non-BOLD components by analyzing temporal progression patterns across cortical depths [87]. This approach leverages high-spatial-resolution acquisitions (1.1-2.0 mm isotropic voxels) to sample different levels of the vascular hierarchy within the cerebral cortex, resolving temporal hemodynamic progression from parenchymal to pial vessels [87]. The methodology enables more precise isolation of neuronal-specific signals from physiological noise, representing a significant advancement in spatial specificity for fMRI applications in cognitive neuroscience research.
fNIRS: Balancing Spatial Resolution and Practicality
Fundamental Spatial Capabilities
fNIRS occupies a middle ground in spatial resolution, typically localizing activity within 1-3 centimeters on the cortical surface [85] [10]. The technique measures hemodynamic responses in superficial cortical layers, primarily targeting the outer cortex approximately 1-2.5 cm beneath the scalp [85]. This makes it particularly well-suited for investigating prefrontal and parietal regions involved in higher-order cognitive processes, attention, and emotion regulation [85]. While its spatial resolution surpasses that of EEG, it remains limited to surface cortical areas and cannot access subcortical structures due to the limited penetration depth of near-infrared light [10].
High-Density Arrays and Experimental Validation
Significant improvements in spatial resolution can be achieved through high-density, multidistance fNIRS arrays (HD-DOT). A 2025 systematic comparison demonstrated that HD arrays with overlapping channels significantly outperform traditional sparse arrays (30mm spacing) in localization accuracy and sensitivity [90]. In Word-Color Stroop tasks, the HD array provided superior detection and localization of dorsolateral prefrontal cortex activation, particularly during lower cognitive load conditions where sparse arrays showed limited sensitivity [90]. The hexagonal-pattern HD array with multiple source-detector distances (10-45mm) enabled more precise spatial sampling and improved depth resolution, demonstrating the critical importance of array density for spatial accuracy in fNIRS studies.
Table 2: Performance Comparison of Sparse vs. High-Density fNIRS Arrays
| Performance Metric | Sparse Array (30mm) | High-Density Array | Experimental Task |
|---|---|---|---|
| Spatial Localization | Limited, broad regions | Superior, precise areas | Word-Color Stroop [90] |
| Sensitivity to Low Load | Poor detection | Strong detection | Congruent Stroop [90] |
| Inter-subject Consistency | Moderate | High | Prefrontal activation [90] |
| Amplitude of HRF | Lower | Higher | Hemodynamic response [90] |
| Superficial Tissue Regression | Limited without short-separation | Incorporated with multiple distances | Signal accuracy [90] |
EEG: Temporal Excellence with Spatial Limitations
Fundamental Spatial Constraints
EEG faces significant spatial challenges due to the blurring and attenuation of electrical signals as they pass through the skull, meninges, and scalp [85] [31]. The spatial resolution of EEG is generally limited to more than 2 centimeters, with the electrical activity generated by cortical pyramidal cells being dispersed across the scalp surface [31] [86]. This volume conduction effect means that EEG is most sensitive to superficial cortical structures and has limited effectiveness for detecting activity from deeper brain regions or highly folded cortical areas [85]. The spatial low-pass filter characteristics of the human head further constrain the precise localization of neural generators from scalp recordings [86].
Technical Advances in Spatial Resolution
Recent computational approaches have sought to overcome EEG's inherent spatial limitations. Spatial harmonic analysis (Sphara) enables generalized spatial Fourier analysis for realistically shaped volume conductors, providing a more accurate quantification of the head's spatial-frequency response than previous spherical models [86]. Simultaneously, diffusion-based generative models like SRGDiff have demonstrated promising results for EEG spatial super-resolution, reconstructing high-density EEG patterns from sparse measurements by formulating the problem as dynamic conditional generation [89]. In comprehensive evaluations across SEED, SEED-IV, and Localize-MI datasets, these approaches achieved performance gains of up to 40% over traditional feature-mapping methods, significantly reducing the spatial-spectral shift between low- and high-density recordings [89].
Experimental Protocols for Spatial Resolution Assessment
Protocol 1: Prefrontal Cortex Mapping with fNIRS
Objective: To quantify spatial localization capabilities in dorsolateral prefrontal cortex (dlPFC) using high-density fNIRS. Task Design: Word-Color Stroop task with congruent (low cognitive load) and incongruent (high cognitive load) conditions [90]. Setup: Hexagonal-pattern HD array with multiple source-detector distances (10-45mm) covering dlPFC regions. Measurements: Concentration changes in oxygenated (HbO) and deoxygenated hemoglobin (HbR) during task performance. Analysis: Statistical parametric mapping comparing amplitude and t-statistics of HbO responses between sparse and dense array configurations. Key Finding: HD arrays detected significant activation during both congruent and incongruent conditions, while sparse arrays only reliably detected activation during high-load incongruent conditions [90].
Protocol 2: Cortical Depth Specificity in fMRI
Objective: To differentiate BOLD and non-BOLD signals using cross-cortical depth delay patterns. Acquisition Parameters: High-spatial-resolution fMRI at 1.1, 1.5, and 2.0 mm isotropic voxel sizes [87]. Analytical Framework: CortiLag-ICA for identifying temporal progression of hemodynamic changes across cortical layers. Validation: Comparison with multi-echo ICA for distinguishing neurogenic signals from physiological noise. Key Finding: Characteristic temporal progression patterns across cortical depths enable automatic categorization of BOLD and non-BOLD signal components, improving neuronal specificity [87].
Protocol 3: EEG Spatial Super-Resolution Validation
Objective: To enhance effective spatial resolution of low-density EEG through generative models. Datasets: SEED, SEED-IV, and Localize-MI datasets with multiple upsampling scales [89]. Method: Step-aware residual-guided diffusion (SRGDiff) model formulating super-resolution as dynamic conditional generation. Evaluation Metrics: Three-level protocol assessing signal-level (temporal consistency, spectral fidelity), feature-level (representation quality), and downstream-level (classification accuracy) performance. Key Finding: SRGDiff achieved consistent gains of up to 40% over strong baselines, significantly mitigating spatial-spectral shift between low- and high-density recordings [89].
The Scientist's Toolkit: Essential Research Solutions
Table 3: Key Research Solutions for Spatial Resolution Enhancement
| Tool/Solution | Function | Application Context |
|---|---|---|
| High-Density Multidistance fNIRS | Improves spatial sampling and depth resolution through overlapping channels [90] | Cortical mapping during naturalistic tasks and movement |
| CortiLag-ICA Framework | Differentiates neurogenic BOLD signals from physiological noise using cortical depth analysis [87] | High-resolution fMRI for improved neuronal specificity |
| Spatial Harmonic Analysis (Sphara) | Enables spatial Fourier analysis for realistic head shapes, quantifying spatial-frequency response [86] | EEG sensor design and spatial filter optimization |
| Step-aware Residual-Guided Diffusion (SRGDiff) | Reconstructs high-density EEG from sparse measurements via dynamic conditional generation [89] | EEG spatial super-resolution for limited-electrode setups |
| Integrated EEG-fNIRS Systems | Combines electrical and hemodynamic information for improved spatiotemporal resolution [85] [31] | Multimodal brain-computer interfaces and cognitive monitoring |
Visualization of Fundamental Principles
Spatial Sampling Characteristics Across Modalities
Spatial-Temporal Resolution Trade-offs
The spatial resolution characteristics of fMRI, fNIRS, and EEG define their respective niches in design neurocognition research. fMRI remains the gold standard for precise spatial localization throughout the entire brain, making it ideal for mapping distributed neural networks and subcortical involvement. fNIRS offers a practical balance between spatial resolution and ecological validity, particularly with high-density arrays that approach fMRI's localization capabilities for cortical regions. EEG, while spatially limited, provides unparalleled temporal resolution for studying rapid neural dynamics, with emerging computational methods gradually improving its spatial fidelity. The choice between these modalities should be guided by specific research questions, with consideration for the fundamental trade-offs between spatial precision, temporal resolution, and practical implementation constraints. For comprehensive investigations, combined approaches leveraging the complementary strengths of multiple modalities often provide the most complete picture of brain function.
In the field of design neurocognition research, selecting appropriate neuroimaging technologies requires careful consideration of their fundamental capabilities, particularly their ability to resolve the timing of neural events. Temporal resolution—the precision with which a technique can measure when neural activity occurs—varies dramatically across major neuroimaging modalities. Electroencephalography (EEG) directly measures electrical activity from neuronal populations with millisecond-scale precision, capturing the brain's rapid dynamics as they unfold. In contrast, hemodynamic-based techniques including functional magnetic resonance imaging (fMRI) and functional near-infrared spectroscopy (fNIRS) track indirect, blood-borne metabolic changes that lag significantly behind neural firing, operating on a timescale of seconds [53] [91]. This fundamental difference stems from the biological signals each method detects: EEG records electrophysiological activity, while fMRI and fNIRS measure the slower hemodynamic response that supports this activity. Understanding these temporal characteristics is essential for designing valid experiments, especially when studying rapid cognitive processes prevalent in design cognition, such as aesthetic appraisal, conceptual combination, or decision-making.
Fundamental Principles and Quantitative Comparison
The disparate temporal resolutions of EEG and hemodynamic modalities originate in the distinct physiological phenomena they monitor. The following table provides a direct comparison of their core technical specifications.
Table 1: Fundamental Characteristics of EEG, fNIRS, and fMRI
| Feature | EEG (Electroencephalography) | fNIRS (functional Near-Infrared Spectroscopy) | fMRI (functional Magnetic Resonance Imaging) |
|---|---|---|---|
| What It Measures | Electrical potentials from synchronized neuronal firing [91] | Concentration changes in oxygenated (HbO) and deoxygenated hemoglobin (HbR) [53] [91] | Blood Oxygen Level Dependent (BOLD) signal, sensitive to HbR [5] |
| Signal Source | Postsynaptic potentials of cortical pyramidal cells [91] | Hemodynamic response in superficial cortical blood vessels [53] | Hemodynamic response in cortical and subcortical blood vessels [5] |
| Temporal Resolution | High (milliseconds) [91] [6] | Low (seconds); limited by hemodynamic lag [91] [92] | Low (seconds); BOLD response lags neural activity by 4-6s [5] |
| Spatial Resolution | Low (centimeter-level) [53] [91] | Moderate (1-3 cm); better than EEG but limited to cortex [5] [91] | High (millimeter-level); whole-brain coverage [5] |
| Primary Temporal Limitation | Volume conduction blurs spatial localization | Inherent delay of neurovascular coupling | Inherent delay and low-pass filtering of hemodynamic response |
The Electrical Speed of EEG
EEG's exceptional temporal resolution is a direct result of its measurement principle. It records voltage fluctuations generated by the summed postsynaptic potentials of large, synchronously active ensembles of pyramidal neurons in the cortex [91]. These electrical changes propagate nearly instantaneously to scalp electrodes, allowing EEG systems to sample brain activity at rates of 500 Hz to 2000 Hz, corresponding to a temporal resolution of 0.5 to 2 milliseconds [53]. This millisecond-scale precision makes EEG ideally suited for tracking the rapid sequence of information processing stages involved in design cognition, from early visual perception to higher-order decision-making.
The Hemodynamic Lag of fMRI and fNIRS
In contrast, fMRI and fNIRS measure the metabolic consequences of neural activity, not the electrical activity itself. When a brain region becomes active, it triggers a complex physiological process known as neurovascular coupling. This process leads to a local increase in cerebral blood flow, blood volume, and oxygen delivery, which alters the relative concentrations of HbO and HbR [53] [93]. The fNIRS technology uses near-infrared light to measure these HbO and HbR changes in the cortex, while fMRI's BOLD signal is primarily sensitive to changes in HbR [5].
This hemodynamic response is inherently slow. It begins 1-2 seconds after neural activity, peaks around 4-6 seconds, and then returns to baseline over 10-15 seconds [5] [92]. This sluggish response acts as a natural low-pass filter, smoothing out rapid neural dynamics. Consequently, if two distinct neural events occur within a second of each other, their hemodynamic responses will overlap and become temporally indistinguishable, whereas EEG can readily separate them [94].
Table 2: Impact of Temporal Resolution on Experimental Capabilities
| Aspect | EEG | Hemodynamic Modalities (fNIRS/fMRI) |
|---|---|---|
| Ideal for Studying | Rapid cognitive processes (sensory perception, error-related negativity, P300), oscillatory brain dynamics, event-related potentials (ERPs) [91] | Sustained cognitive states (mental workload, emotional engagement), localized functional specialization, slow cortical potentials [91] |
| Ability to Resolve Temporally Close Sources | Can distinguish sources activated with separations of tens of milliseconds [94] | Fundamentally limited; sources activated with small temporal separations (e.g., 1 second) are smoothed together [94] |
| Key Temporal Limitation in Experiments | Poor spatial resolution makes it difficult to pinpoint the anatomical origin of rapid events [94] | The hemodynamic lag prevents precise timing of the onset and sequence of neural events [94] |
Experimental Evidence and Methodologies
Empirical studies and simulations consistently demonstrate the practical consequences of the temporal resolution gap. The following experimental profile illustrates a typical multimodal approach and its findings.
Table 3: Experimental Profile: A Multimodal fNIRS-EEG Study on Motor Processing
| Experiment Element | Description |
|---|---|
| Research Objective | To elucidate differences in neural activity during motor execution (ME), motor observation (MO), and motor imagery (MI) using simultaneous fNIRS-EEG [6]. |
| Key Experimental Methodology | |
| Participants | 21 healthy adults [6]. |
| Task Design | A live-action paradigm where participants: 1) executed a cup-grasping action (ME), 2) observed an experimenter perform the action (MO), and 3) mentally imagined the action (MI) [6]. |
| Data Acquisition | EEG: 128-electrode system (Electrical Geodesics, Inc.) [6]. fNIRS: 24-channel continuous-wave system (Hitachi ETG-4100) measuring HbO and HbR at 10 Hz [6]. Setup: fNIRS probes were embedded within the elastic EEG cap. Optode positions were digitized for precise localization [6]. |
| Data Analysis | Unimodal analyses were conducted for each modality. Data fusion was performed using structured sparse multiset Canonical Correlation Analysis (ssmCCA) to identify brain regions consistently active in both electrical and hemodynamic domains [6]. |
| Key Findings on Temporal Dynamics | - EEG captured the rapid, millisecond-scale electrical dynamics of motor planning and execution. - fNIRS revealed the slower, second-scale hemodynamic activation in regions like the angular gyrus and supramarginal gyrus. - The multimodal fusion consistently identified the left inferior parietal lobe as a key hub across all conditions, a finding less clear with either modality alone [6]. |
Simulation studies further quantify these limitations. Research shows that while EEG alone struggles to distinguish two neuronal sources separated by 2.3-3.3 cm, and fNIRS (or DOT) alone cannot resolve them if activated with a temporal separation of just 50 milliseconds, a joint EEG-fNIRS approach can successfully recover both the spatial location and temporal sequence of the sources [94]. This powerfully illustrates the complementary nature of these modalities.
The Scientist's Toolkit: Essential Research Reagents and Materials
The following table details key components required for setting up a simultaneous fNIRS-EEG experiment, as reflected in the cited literature.
Table 4: Essential Materials for a Multimodal fNIRS-EEG Experiment
| Item | Function/Description |
|---|---|
| High-Density EEG System | Records electrical brain activity with millisecond temporal resolution. Typically includes an amplifier, software, and an electrode cap (e.g., 128-channel EGI system) [6]. |
| CW-fNIRS System | Measures hemodynamic changes via continuous wave near-infrared light. Key components are control unit, light sources (e.g., 695 & 830 nm lasers), and detectors (e.g., Hitachi ETG-4100) [6] [93]. |
| Integrated fNIRS-EEG Cap | A specialized helmet that houses both EEG electrodes and fNIRS optodes. Can be based on a flexible EEG cap with optode holders or a custom 3D-printed helmet for better fit [53] [6]. |
| 3D Magnetic Digitizer | (e.g., Polhemus Fastrak). Critical for accurately mapping the 3D locations of fNIRS optodes and EEG electrodes on the scalp for co-registration with brain anatomy [6]. |
| Synchronization Hardware/Software | A unified processor or external trigger system (e.g., TTL pulses) is required to temporally align the EEG and fNIRS data streams with sub-millisecond precision [53] [91]. |
Visualizing the Signaling Pathways and Experimental Workflow
The fundamental difference in what EEG and hemodynamic modalities measure can be visualized through the neurovascular coupling pathway and a typical experimental workflow.
The Neurovascular Coupling Pathway
This diagram illustrates the biological sequence from neural electrical activity to the measurable hemodynamic response, highlighting the points of detection for each modality.
Multimodal Experimental Workflow
A standard protocol for simultaneous fNIRS-EEG data collection involves synchronized hardware and careful preparation to ensure data quality.
The temporal resolution divide between EEG and hemodynamic modalities is not merely a technical specification but a fundamental factor that shapes the kinds of research questions scientists can pursue in design neurocognition. EEG's millisecond precision is indispensable for deconstructing the rapid, sequential cognitive processes involved in design thinking, such as the micro-genesis of an idea or the immediate reaction to a visual stimulus. Conversely, fNIRS and fMRI provide critical, spatially localized information about the brain regions that sustain engagement over longer periods, such as during a protracted design problem-solving session.
The future of neuroimaging in complex, real-world design research lies not in choosing a single superior modality, but in the strategic multimodal integration of EEG with fNIRS or fMRI. This approach leverages their complementary strengths: using EEG to pinpoint the when of neural events with exquisite temporal accuracy, and hemodynamic methods to identify the where with greater spatial confidence. As hardware and data fusion techniques continue to advance, this synergistic approach will provide an increasingly rich and comprehensive understanding of the brain's dynamics, ultimately illuminating the complex neural underpinnings of design and creativity.
Functional near-infrared spectroscopy (fNIRS) has emerged as a promising neuroimaging technology that offers portability, higher tolerance for motion, and lower operational costs compared to the neuroimaging gold standard, functional magnetic resonance imaging (fMRI). However, for fNIRS to gain widespread acceptance in both basic research and clinical applications, its signals must be rigorously validated against the well-established blood-oxygen-level-dependent (BOLD) signal measured by fMRI. Both fNIRS and fMRI measure hemodynamic responses related to neural activity, but they do so through fundamentally different physical principles—fNIRS relies on the optical absorption properties of hemoglobin, while fMRI detects magnetic susceptibility changes caused by deoxygenated hemoglobin [11]. This methodological difference raises critical questions about the relationship between the signals obtained from these two modalities, driving a significant body of research dedicated to their cross-validation.
The validation of fNIRS against fMRI serves multiple crucial purposes in neuroimaging research. First, it establishes the spatial accuracy of fNIRS for localizing brain activity, which is particularly important given fNIRS's limited penetration depth and relatively coarse spatial resolution compared to fMRI. Second, it helps researchers interpret the physiological meaning of fNIRS signals by correlating them with the well-characterized BOLD response. Third, it guides the development of signal processing methods to remove confounding factors from fNIRS measurements, such as extracerebral contamination from scalp blood flow [95] [5]. As fNIRS technology continues to evolve toward clinical applications, these validation studies provide the essential foundation for establishing its reliability and accuracy in measuring cerebral hemodynamics.
Quantitative Comparison of fNIRS and fMRI Signals
Spatial Correspondence Metrics
The spatial relationship between fNIRS and fMRI activations has been systematically quantified across multiple studies involving various task paradigms. These comparisons typically measure the degree of overlap between significant activation areas detected by both modalities, providing crucial metrics for establishing fNIRS's spatial validity.
Table 1: Spatial Correspondence Between fNIRS and fMRI Activation Areas
| Study Reference | Task Paradigm | Group-Level Overlap | Within-Subject Overlap | Positive Predictive Value |
|---|---|---|---|---|
| Spatial Correspondence Study [96] | Motor (finger tapping) | Up to 68% | 47.25% | 51% (group), 41.5% (within-subject) |
| Spatial Correspondence Study [96] | Visual (checkerboard) | Up to 68% | 47.25% | 51% (group), 41.5% (within-subject) |
| SMA Validation Study [97] | Motor Execution | Significant correlations (p < 0.05) | Similar spatial patterns | Topographical similarity confirmed |
The data reveal that fNIRS demonstrates good spatial correspondence with fMRI at the group level, with overlap rates of up to 68% of the fMRI-activated regions. Within individual subjects, the correspondence remains substantial though somewhat reduced, averaging approximately 47.25% [96]. The positive predictive value of fNIRS relative to fMRI was found to be 51% at the group level and 41.5% for within-subject analyses, indicating that fNIRS may detect activations in some regions where fMRI does not show significant task-related activity [96]. This discrepancy could stem from fNIRS's sensitivity to task-correlated physiological noise or genuine differences in what the two modalities measure regarding separate versus combined changes in oxy- and deoxyhemoglobin [96].
Hemodynamic Response Correlations
Beyond spatial overlap, researchers have quantitatively compared the temporal characteristics and response amplitudes of fNIRS signals with the fMRI BOLD response across different experimental conditions.
Table 2: Correlation Between fNIRS Hemoglobin Species and fMRI BOLD Signal
| Study Focus | fNIRS Signal | Correlation Strength with BOLD | Experimental Conditions | Notes |
|---|---|---|---|---|
| Quantitative Comparison [98] | HbO | Strongest correlation | Motor task | After accounting for systematic errors |
| Quantitative Comparison [98] | HbR | Variable correlation | Motor task | Before error correction |
| SMA Validation [97] | HbR | More specific for motor imagery | Motor execution and imagery | Particularly for whole-body and hand motor imagery |
| Brain Fingerprinting [99] | HbO & HbR | High classification accuracy (75-98%) | Resting-state | Similar to fMRI accuracy (99.9%) with sufficient data |
The correlation patterns between fNIRS and fMRI signals are complex and task-dependent. While one simultaneous recording study found that oxyhemoglobin (HbO) provided the strongest correlation with the BOLD signal after accounting for systematic errors [98], other research has indicated that deoxyhemoglobin (HbR) may be a more specific signal for certain tasks like motor imagery [97]. This variability highlights the importance of considering the specific experimental context and signal processing approaches when comparing fNIRS and fMRI data. For advanced applications like brain fingerprinting, fNIRS has demonstrated remarkably high classification accuracy (75-98%) that approaches the 99.9% accuracy achieved with fMRI when sufficient data and appropriate spatial coverage are utilized [99].
Experimental Protocols for fNIRS-fMRI Validation
Simultaneous Acquisition Protocols
The most methodologically rigorous approach for fNIRS-fMRI validation involves simultaneous data collection, which ensures identical experimental conditions and neural states for both modalities. Technical implementations require careful consideration of hardware compatibility to minimize electromagnetic interference between fNIRS and fMRI systems [5]. The fNIRS equipment must use MRI-compatible components, including fiber-optic cables for light transmission and non-metallic materials in head probes. Source-detector distances typically range from 15-30 mm for short-channel measurements to 30-35 mm for standard channels, with the longer distances providing greater sensitivity to cerebral tissue [95] [99].
A representative simultaneous acquisition protocol involves collecting data during multiple runs of motor, cognitive, or resting-state paradigms. For example, one validation study collected six runs of simultaneous fMRI and fNIRS recordings for six minutes each during resting state, resulting in five valid fMRI runs and six fNIRS runs per participant after quality control [99]. For task-based studies, block designs are commonly employed, with participants performing activities such as finger tapping, visual stimulation with checkerboard patterns, verbal fluency tasks, or working memory tasks [95] [96]. The initial scans are typically discarded to account for T1-equilibration effects in fMRI, and the number of scans is calibrated to match the total task duration [95].
Signal Processing and Analysis Methods
Comprehensive validation requires sophisticated signal processing pipelines to address the unique artifacts and noise sources affecting each modality. For fNIRS data, standard preprocessing includes converting light intensity to optical density, motion artifact correction using hybrid algorithms that combine spline interpolation with wavelet decomposition, pruning of low-SNR channels (typically SNR < 8), and conversion to hemoglobin concentrations using the modified Beer-Lambert law [99]. Additional processing steps often involve removing global physiological noise using principal component analysis or regression-based methods [99].
For fMRI data, standard preprocessing pipelines include normalization, motion artifact correction using framewise displacement and DVARS metrics, band-pass filtering (typically 0.009-0.08 Hz for resting-state studies), and regression of non-neural signals from white matter and cerebrospinal fluid [99]. In concurrent analyses, the fNIRS channels are co-registered with anatomical MRI data using digitized optode locations and anatomical landmarks (e.g., Nz, Cz, Iz in the 10-20 system) to enable precise spatial comparison between fNIRS activations and BOLD signals [99] [97].
Statistical analyses commonly employ general linear models for task-based data and correlation approaches for functional connectivity studies. For spatial validation, beta maps representing task-related activation are generated for both modalities and compared using Spearman correlations or overlap metrics [97] [96]. Advanced analytical approaches like dynamic causal modeling (DCM) have also been successfully applied to both fMRI and fNIRS data, showing high correspondence in model evidence measures despite the different data types [100].
Diagram 1: Signaling Pathways and Temporal Relationships Between fNIRS and fMRI
Successful fNIRS-fMRI validation studies require specific hardware, software, and methodological resources. The following table summarizes key solutions and their functions in multimodal experimental paradigms.
Table 3: Research Reagent Solutions for fNIRS-fMRI Validation Studies
| Resource Category | Specific Examples | Function & Application |
|---|---|---|
| fNIRS Hardware | ETG-4000 (Hitachi), NIRScout (NIRx) | Continuous-wave fNIRS systems with multi-wavelength capability for measuring HbO and HbR concentrations |
| MRI-Compatible fNIRS | Specially designed optical probes | Fiber-optic probes with non-magnetic materials to minimize electromagnetic interference in MRI environments |
| Co-registration Tools | AtlasViewer, fOLD toolbox | Software for digitizing optode locations and co-registering fNIRS channels with anatomical MRI data |
| Motion Tracking | Fastrak (Polhemus), MRI-compatible cameras | Systems for digitizing head landmarks and optode positions for spatial registration |
| Signal Processing | HOMER2, SPM12, in-house MATLAB scripts | Software packages for converting light intensity to hemoglobin concentrations and correcting motion artifacts |
| Physiological Monitoring | Laser-Doppler Flowmetry (LDF), pulse oximeters | Supplementary measurements to account for systemic physiological noise in fNIRS signals |
| Experimental Tasks | Verbal Fluency Task (VFT), Working Memory (WM), Finger Tapping (TAP) | Standardized paradigms for eliciting robust hemodynamic responses in specific brain regions |
The integration of these resources enables comprehensive validation studies that address both spatial and temporal aspects of fNIRS-fMRI correspondence. Particularly critical are the co-registration tools that allow precise mapping between fNIRS channels and underlying cortical anatomy, as this forms the foundation for spatial validation [99] [97]. Additionally, specialized algorithms like the multidistance independent component analysis (MD-ICA) method have been developed specifically to separate deep (cerebral) from shallow (extracerebral) components in fNIRS signals, with validation through simultaneous fMRI recordings [95].
Applications and Validation Outcomes Across Domains
Motor and Sensory Cortex Validation
The sensorimotor system represents an ideal model for fNIRS-fMRI validation studies due to its well-defined functional topography and robust hemodynamic responses. Multiple studies have demonstrated strong correspondence between fNIRS and fMRI activation patterns during finger tapping tasks, with true positive rates up to 68% at the group level and approximately 47% within individuals [96]. The supplementary motor area (SMA), which plays a crucial role in motor planning and execution, has been specifically investigated using consecutive fNIRS and fMRI measurements. Results confirmed that fNIRS can reliably detect SMA activation during both motor execution and motor imagery, with spatial patterns showing significant correlations between fNIRS channels over SMA and fMRI BOLD signals from the same region [97].
Visual cortex activation has similarly served as a validation model, with studies employing checkerboard stimulation paradigms demonstrating that fNIRS detects activations in the occipital cortex that substantially overlap with fMRI activations [96]. These motor and sensory validations provide critical evidence for the spatial accuracy of fNIRS in mapping well-established functional regions, supporting its use in both basic neuroscience and clinical monitoring applications.
Cognitive Tasks and Resting-State Applications
Beyond simple sensory and motor functions, fNIRS has been validated against fMRI during more complex cognitive tasks including verbal fluency, working memory, and problem-solving paradigms. These studies typically show slightly more variable correlations between the modalities, reflecting the more distributed and heterogeneous nature of higher cognitive networks [95]. Nevertheless, the general correspondence supports the use of fNIRS for investigating prefrontal cortex function during executive tasks.
Resting-state functional connectivity represents another important application where fNIRS has been validated against fMRI. Recent research has demonstrated that fNIRS can reliably capture individual-specific connectivity patterns ("brain fingerprints") with classification accuracy ranging from 75% to 98%, approaching the nearly perfect identification rates achievable with fMRI (99.9%) when sufficient data and appropriate optode coverage are utilized [99]. This finding underscores fNIRS's potential for clinical applications requiring individualized assessment and monitoring of brain network function.
Clinical Population Applications
The validation of fNIRS against fMRI has paved the way for its application in clinical populations that present challenges for conventional fMRI studies. For example, fNIRS has been used successfully with infants, where fMRI is particularly difficult due to motion constraints and the need for naturalistic environments [100]. Simultaneous fNIRS-fMRI recordings in sleeping infants have demonstrated the feasibility of applying advanced analytical approaches like dynamic causal modeling to fNIRS data, with high correspondence observed between the modalities in model evidence measures [100].
Similarly, fNIRS has been validated for use with patient populations such as stroke survivors and individuals with Parkinson's disease, where its portability and tolerance for movement make it particularly advantageous for bedside monitoring [97] [10]. These clinical validations often involve task paradigms specifically designed for the target population, such as motor imagery tasks for stroke rehabilitation or whole-body movement imagery for Parkinson's disease [97].
The comprehensive analysis of fNIRS-fMRI validation studies reveals a generally strong correspondence between the two modalities, particularly for cortical regions accessible to near-infrared light. Quantitative comparisons demonstrate that fNIRS achieves spatial overlap rates with fMRI of up to 68% at the group level and approximately 47% within individuals, with variable but often strong correlations between the temporal dynamics of fNIRS hemoglobin signals and the fMRI BOLD response [96] [98]. These validation outcomes support the use of fNIRS as a reliable neuroimaging tool for investigating brain function in superficial cortical regions.
Future validation efforts should focus on standardizing protocols and analytical approaches to facilitate more direct comparisons across studies and laboratories. Additionally, as fNIRS technology continues to evolve with higher-density arrays and more sophisticated signal processing methods, ongoing validation against fMRI will be essential to establish the spatial resolution and depth sensitivity of these advanced implementations. The combination of fNIRS's portability and temporal resolution with fMRI's high spatial resolution and whole-brain coverage represents a powerful multimodal approach that will continue to advance our understanding of human brain function in both health and disease.
Selecting the appropriate neuroimaging tool is critical for advancing research in design neurocognition. This guide provides a direct, feature-by-feature comparison of functional Magnetic Resonance Imaging (fMRI), Electroencephalography (EEG), and functional Near-Infrared Spectroscopy (fNIRS) to inform experimental design and resource allocation.
Neuroimaging Modalities at a Glance
The table below summarizes the core technical and practical specifications of fMRI, EEG, and fNIRS.
| Feature | fMRI | EEG | fNIRS |
|---|---|---|---|
| Spatial Resolution | High (millimeter-level) [5] [10] | Low (around 2 cm) [31] | Moderate (1-3 cm) [5] [10] |
| Temporal Resolution | Low (0.33-2 Hz) [5] [10] | High (millisecond-level) [23] [31] | Moderate (up to 10+ Hz) [26] [23] |
| Portability | No (stationary scanner) [26] | High (portable systems available) [53] [23] | High (fully portable/wireless) [26] [5] |
| Cost | Very High [26] [101] | Low [101] [53] | Moderate [26] [53] |
| Tolerance to Motion | Low (highly sensitive) [26] [5] | Moderate (vulnerable to artifacts) [23] | High (relatively robust) [26] [5] |
| Measurement Depth | Whole brain (cortical & subcortical) [5] [10] | Cortical surface [101] | Superficial cortex (up to ~2-3 cm) [26] [5] |
| Signal Type | Hemodynamic (BOLD response) [26] [101] | Electrical neural oscillations [101] [23] | Hemodynamic (HbO/HbR concentration) [26] [23] |
Detailed Experimental Protocols in Design Neurocognition
Understanding the methodological details of key studies helps in designing robust experiments.
1. Protocol: Investigating the Action Observation Network (AON)
- Objective: To elucidate differences in neural activity during motor execution, observation, and imagery [6].
- Setup: Simultaneous 24-channel fNIRS and 128-channel EEG recordings using a custom-integrated helmet [6].
- Paradigm: A live-action, face-to-face task where participants, upon an audio cue, either (i) grasped and moved a cup (Motor Execution), (ii) observed an experimenter perform the action (Motor Observation), or (iii) mentally rehearsed the action (Motor Imagery) [6].
- Analysis: Employed structured sparse multiset Canonical Correlation Analysis (ssmCCA) to fuse fNIRS and EEG data, identifying brain regions consistently activated by both modalities and revealing shared AON activation in the left inferior parietal lobe [6].
2. Protocol: Semantic Decoding for Brain-Computer Interfaces (BCIs)
- Objective: To differentiate between semantic categories (animals vs. tools) during mental imagery tasks [31].
- Setup: Simultaneous EEG and fNIRS recordings [31].
- Paradigm: Participants were shown images and performed four distinct mental tasks: Silent Naming, Visual Imagery, Auditory Imagery, and Tactile Imagery. They were instructed to minimize physical movements during the 3-second task period [31].
- Analysis: Machine learning techniques are applied to the multimodal dataset to decode the semantic category a participant is focusing on, demonstrating the potential for direct semantic communication BCIs [31].
Visualizing the Neurovascular Coupling Principle
The synergy between electrical and hemodynamic activity forms the basis for multimodal integration. The following diagram illustrates this relationship and the signals detected by each modality.
Essential Research Reagent Solutions
This table details key materials and their functions for setting up a multimodal neuroimaging experiment, particularly for fNIRS-EEG integration.
| Item | Function in Research |
|---|---|
| Integrated fNIRS-EEG Cap | A custom helmet or modified EEG cap that holds fNIRS optodes and EEG electrodes in precise spatial registration on the scalp, enabling simultaneous data acquisition [53] [6]. |
| 3D Magnetic Space Digitizer | Used to record the precise 3D coordinates of fNIRS optodes relative to cranial landmarks (nasion, inion). This is critical for accurate co-registration of data with brain anatomy [6]. |
| fNIRS System (CW-NIRS) | A continuous-wave near-infrared spectroscopy system that emits light at specific wavelengths (e.g., 695 nm & 830 nm) and detects attenuated light to calculate changes in oxygenated and deoxygenated hemoglobin concentration [23] [6]. |
| High-Density EEG System | An amplifier and electrode net used to measure voltage fluctuations on the scalp, capturing post-synaptic potentials from pyramidal neurons with high temporal resolution [23] [31]. |
| Structured Sparse Multiset CCA (ssmCCA) | An advanced data fusion algorithm used to identify correlated components across simultaneously recorded fNIRS and EEG datasets, pinpointing brain regions consistently active in both electrical and hemodynamic domains [6]. |
Selecting the optimal neuroimaging modality is a critical step in designing robust neurocognitive studies. Functional Magnetic Resonance Imaging (fMRI), Electroencephalography (EEG), and functional Near-Infrared Spectroscopy (fNIRS) each offer distinct strengths and limitations concerning spatial and temporal resolution, portability, and operational constraints. This guide provides an objective, data-driven comparison of these three predominant modalities. It synthesizes evidence from simultaneous multimodal studies to illustrate how technique selection aligns with specific research goals, whether for mapping deep brain structures with high spatial fidelity, capturing neural dynamics at millisecond scales, or enabling functional brain imaging in naturalistic environments. Framed within the context of design neurocognition, this review serves as a foundational reference for researchers and drug development professionals in strategizing experimental protocols.
In cognitive neuroscience, no single imaging technique provides a complete picture of brain function. The hemodynamic responses measured by fMRI and fNIRS and the electrical activity captured by EEG offer complementary insights. The fundamental challenge in experimental design lies in aligning a modality's inherent capabilities with the study's specific hypotheses and practical constraints [23] [10]. Functional Magnetic Resonance Imaging (fMRI) has long been considered the gold standard for non-invasive spatial localization of brain activity, but its utility is bounded by cost, immobility, and sensitivity to motion artifacts [10] [26]. Electroencephalography (EEG) provides an unparalleled view into the brain's rapid electrical oscillations but struggles with precise spatial localization [23]. Functional Near-Infrared Spectroscopy (fNIRS) occupies a middle ground, offering a portable, resilient, and cost-effective means to measure hemodynamic responses, albeit with limitations in probing deep brain structures [10] [26]. The following sections provide a detailed, evidence-based comparison to inform optimal modality selection.
Technical Specifications and Comparative Performance
The table below summarizes the core technical characteristics of fMRI, fNIRS, and EEG, synthesizing data from multiple validation and comparison studies.
Table 1: Technical Specifications and Comparative Performance of fMRI, fNIRS, and EEG
| Feature | fMRI | fNIRS | EEG |
|---|---|---|---|
| Primary Signal | Blood Oxygen Level Dependent (BOLD) response [26] | Concentration changes in oxygenated (HbO) and deoxygenated hemoglobin (HbR) [23] [26] | Post-synaptic electrical potentials from pyramidal neurons [23] |
| Spatial Resolution | High (millimeter-level) [10] | Low to Moderate (1-3 cm) [10] | Low (centimeter-level) [23] |
| Temporal Resolution | Low (0.5 - 2 Hz, limited by hemodynamics) [10] | Moderate (up to 10 Hz) [2] [10] | Very High (milliseconds) [23] |
| Penetration Depth | Whole brain (cortical & subcortical) [10] | Superficial cortex (2-3 cm) [10] | Superficial cortex |
| Portability | No (requires scanner bore) [26] | Yes (fully portable systems) [26] | Yes (portable systems available) |
| Cost | Very High [26] | Moderate [26] | Low to Moderate [51] |
| Robustness to Motion | Low [10] [26] | High [10] [26] | Moderate (sensitive to artifacts) [23] |
| Spatial Correspondence with fMRI | Gold Standard | 41.5% - 68% overlap in group/individual studies [96] | Not directly comparable (different signal origin) |
Quantitative comparisons between fNIRS and fMRI reveal a promising spatial correspondence. One study investigating motor and visual tasks found that fNIRS activations overlapped with 41.5% to 68% of fMRI-defined regions of interest, demonstrating its utility for assessing superficial cortical activity [96]. Furthermore, simultaneous fNIRS-EEG studies confirm that the modalities provide complementary data, with fNIRS offering better spatial resolution and EEG providing superior temporal resolution [23].
Experimental Case Studies and Protocols
To illustrate modality selection in practice, this section details specific experimental protocols and the unique insights gained from multimodal approaches.
Case Study 1: Finger Tapping and Motor Execution
This paradigm is widely used to validate and compare neuroimaging modalities due to the well-defined neural circuitry involved.
- Experimental Protocol: Participants perform repetitive finger tapping (e.g., 15-second blocks alternating with 20-second rest) [102]. In a simultaneous fMRI-fNIRS study, participants performed left-hand finger tapping while both signals were recorded, allowing for direct correlation [102]. Another study employed a simple finger tapping (FT) task alongside more complex sequences (SFS, CFS) with simultaneous fMRI, fNIRS, and EEG to investigate effective connectivity [103].
- Modality-Specific Insights:
- fMRI/fNIRS: Both modalities robustly detect activation in the contralateral sensorimotor cortex. The fNIRS signal (particularly HbO) shows a strong correlation with the fMRI BOLD response in this region [102] [26].
- EEG: Shows event-related desynchronization in the mu (8-12 Hz) and beta (13-30 Hz) rhythms over the sensorimotor cortex [51].
- Multimodal Value: A Granger causality analysis on simultaneous data revealed bidirectional information flow between the sensorimotor cortex, premotor cortex, and dorsolateral prefrontal cortex across all three modalities (fMRI, fNIRS, EEG), providing a more comprehensive model of motor network connectivity [103].
Case Study 2: Motor Imagery and Observation
Studying covert actions (imagery, observation) requires techniques that are tolerant of minimal or no movement.
- Experimental Protocol: In a live-action paradigm, participants alternately executed (ME), observed (MO), and imagined (MI) a cup-grasping action [6]. Neural activity was recorded simultaneously with fNIRS and EEG.
- Modality-Specific Insights:
- fNIRS: Unimodal analysis identified activation in left angular gyrus and right supramarginal gyrus [6].
- EEG: Unimodal analysis showed activation over bilateral central, right frontal, and parietal regions [6].
- Multimodal Value: Using a data fusion technique (ssmCCA), researchers consistently identified a shared neural signature in the left inferior parietal lobe, superior marginal gyrus, and post-central gyrus across all three conditions. This finding, validated by both electrical and hemodynamic data, strongly supports the existence of a shared Action Observation Network (AON) [6].
Case Study 3: Cognitive Tasks (Go/No-Go)
Cognitive tasks challenge the temporal resolution of hemodynamic methods and the spatial resolution of electrical methods.
- Experimental Protocol: Participants respond quickly to frequent "Go" stimuli but must inhibit their response to rare "No-Go" stimuli. One study used a block-design Go/No-Go task during simultaneous fMRI and fNIRS recordings over frontal and parietal regions [102]. Another utilized a Go/No-Go task to evaluate the test-retest reliability of a TD-fNIRS system [104].
- Modality-Specific Insights:
- fMRI: Excellently localizes activation in key regions for response inhibition, such as the right inferior frontal gyrus and anterior cingulate cortex.
- fNIRS: Demonstrates good reliability in measuring HbO changes in the prefrontal cortex during this task, making it a suitable tool for longitudinal studies of cognitive control [104].
- EEG: Provides the millisecond-scale resolution needed to isolate specific event-related potential (ERP) components like the N2 and P3, which are markers of conflict monitoring and inhibitory control, respectively [51].
Table 2: Key Metrics from Quantitative Comparison Studies
| Study Paradigm | Modalities Compared | Key Quantitative Finding | Citation |
|---|---|---|---|
| Motor & Visual Tasks | fNIRS vs. fMRI | Spatial overlap of 41.5% (within-subject) to 68% (group-level) for activated regions. | [96] |
| Cognitive Battery | fNIRS vs. fMRI | NIRS signals were highly correlated with fMRI but had significantly weaker signal-to-noise ratio (SNR). | [102] |
| Finger Tapping | fNIRS vs. EEG vs. fMRI | Effective connectivity (Granger Causality) was identified between SMC, PMC, and DLPFC by all three modalities. | [103] |
| Stroke Motor Assessment | qEEG | Power Ratio Index (PRI) and Brain Symmetry Index (BSI) correlate with functional motor outcomes (e.g., Fugl-Meyer Assessment). | [51] |
Visualizing Signaling Pathways and Workflows
The Neurovascular Coupling Pathway
The following diagram illustrates the physiological pathway linking neuronal activity to the signals measured by fMRI and fNIRS, which is the basis for neurovascular coupling.
Multimodal Experimental Integration Workflow
This flowchart outlines a standard protocol for designing and executing a simultaneous multimodal neuroimaging study.
The Scientist's Toolkit: Research Reagent Solutions
The following table details essential materials and their functions for conducting multimodal neuroimaging studies, as derived from the cited experimental protocols.
Table 3: Essential Research Reagents and Materials for Multimodal Studies
| Item | Function/Description | Experimental Context |
|---|---|---|
| Simultaneous fNIRS-EEG Cap | An integrated headgear embedding fNIRS optodes within a standard EEG electrode cap, allowing concurrent data collection. | Used in studies investigating motor execution, observation, and imagery to collect hemodynamic and electrical signals simultaneously [6]. |
| 3D Magnetic Space Digitizer | A device (e.g., Polhemus Fastrak) used to record the precise 3D locations of fNIRS optodes and EEG electrodes relative to cranial landmarks (nasion, inion). | Critical for coregistering fNIRS/EEG data with anatomical MRI templates for accurate source localization and spatial analysis [6]. |
| Continuous-Wave (CW) fNIRS System | A common fNIRS system type that emits light at constant intensity, measuring attenuation to calculate HbO and HbR changes based on the Modified Beer-Lambert Law [23]. | Widely used in research and clinical settings due to its cost-effectiveness and simplicity; employed in motor and cognitive task studies [23] [6]. |
| Time-Domain (TD) fNIRS System | A advanced fNIRS system (e.g., Kernel Flow2) that measures the temporal distribution of photons, providing improved depth resolution and more quantitative hemoglobin measures [104]. | Used in high-reliability studies to obtain superior quality signals and evaluate test-retest reliability of neural metrics [104]. |
| Structured Sparse Multiset CCA (ssmCCA) | A computational data fusion algorithm used to find a common representation from multiple datasets (e.g., fNIRS and EEG), identifying brain regions consistently active across modalities [6]. | Employed to fuse fNIRS and EEG data and pinpoint shared neural regions of the Action Observation Network during motor tasks [6]. |
| Graph Signal Processing (GSP) Toolbox | A mathematical framework for analyzing data defined on graph structures (e.g., brain connectivity networks). Used to compute the Structural-decoupling index (SDI). | Used to quantify the coupling between structural connectomes (from dMRI) and functional networks from both EEG and fNIRS [2]. |
Conclusion
The choice between fMRI, EEG, and fNIRS is not a matter of identifying a single superior technology, but of strategically matching the tool to the specific research question in design neurocognition. fMRI remains unparalleled for mapping deep brain structures with high spatial resolution, EEG excels at capturing the rapid dynamics of cognitive processing, and fNIRS offers a unique balance of portability and localized hemodynamic measurement for naturalistic settings. The future of neuroimaging lies in multimodal approaches that integrate these complementary strengths, such as simultaneous EEG-fNIRS, to provide a richer, more comprehensive understanding of brain function. For biomedical and clinical research, this synergy promises enhanced diagnostic precision, more sensitive monitoring of treatment efficacy, and the development of advanced brain-computer interfaces, ultimately driving personalized medicine and innovative therapeutic strategies in neurology and psychiatry.
References
- 1. fNIRS vs EEG: Comparing Non-Invasive Brain Imaging... - iMotions [https://imotions.com/blog/learning/research-fundamentals/fnirs-vs-eeg/]
- 2. Comparing structure–function relationships in brain ... [https://www.nature.com/articles/s41598-024-79817-x]
- 3. Correlation between electrical and hemodynamic responses during... [https://www.spiedigitallibrary.org/journals/journal-of-biomedical-optics/volume-21/issue-9/091315/Correlation-between-electrical-and-hemodynamic-responses-during-visual-stimulation-with/10.1117/1.JBO.21.9.091315.full]
- 4. Functional coupling of simultaneous electrical and metabolic ... [https://pmc.ncbi.nlm.nih.gov/articles/PMC6871925/]
- 5. Applications and advances of combined fMRI-fNIRs ... [https://pmc.ncbi.nlm.nih.gov/articles/PMC11958174/]
- 6. Simultaneous multimodal fNIRS-EEG recordings reveal ... [https://www.nature.com/articles/s41598-023-31609-5]
- 7. A Cross-Disciplinary Review of the fNIRS-EEG Dual ... [https://www.mdpi.com/2076-3425/14/10/1022]
- 8. Simultaneous EEG-PET-MRI identifies temporally coupled ... [https://www.nature.com/articles/s41467-025-64414-x]
- 9. Contributions of action potentials to scalp EEG [https://journals.plos.org/ploscompbiol/article?id=10.1371/journal.pcbi.1012794]
- 10. Applications and advances of combined fMRI-fNIRs ... [https://www.frontiersin.org/journals/neurology/articles/10.3389/fneur.2025.1542075/full]
- 11. Functional Magnetic Resonance Imaging and ... [https://www.frontiersin.org/journals/human-neuroscience/articles/10.3389/fnhum.2017.00419/full]
- 12. Multimodal fNIRS–EEG sensor fusion: Review of data-driven ... [https://pmc.ncbi.nlm.nih.gov/articles/PMC12592382/]
- 13. Detection of Movement Related Cortical Potentials from ... [https://pmc.ncbi.nlm.nih.gov/articles/PMC5492875/]
- 14. Using neuroscience techniques to understand and improve design ... [https://pmc.ncbi.nlm.nih.gov/articles/PMC7519965/]
- 15. Functional Magnetic Resonance Imaging and Functional Near ... [https://pmc.ncbi.nlm.nih.gov/articles/PMC5563305/]
- 16. fMRI at High Spatial Resolution: Implications for BOLD- ... [https://pmc.ncbi.nlm.nih.gov/articles/PMC4923185/]
- 17. Effects of spatial fMRI resolution on the classification ... [https://www.sciencedirect.com/science/article/abs/pii/S1053811917307000]
- 18. EEG/fNIRS Based Workload Classification Using ... [https://pmc.ncbi.nlm.nih.gov/articles/PMC9571712/]
- 19. Ultra-high resolution blood volume fMRI and BOLD ... [https://pmc.ncbi.nlm.nih.gov/articles/PMC6100753/]
- 20. Improvement of classification accuracy of functional near- ... [https://www.sciencedirect.com/science/article/pii/S2667102625000245]
- 21. Functional near-infrared spectroscopy [https://en.wikipedia.org/wiki/Functional_near-infrared_spectroscopy]
- 22. Functional Near-infrared Spectroscopy (fNIRS) of Brain ... [https://pmc.ncbi.nlm.nih.gov/articles/PMC3294084/]
- 23. Concurrent fNIRS and EEG for Brain Function Investigation [https://pmc.ncbi.nlm.nih.gov/articles/PMC9371171/]
- 24. Functional Near-Infrared Spectroscopy in Schizophrenia ... [https://pmc.ncbi.nlm.nih.gov/articles/PMC12413766/]
- 25. fNIRS vs EEG: Comparing Non-Invasive Brain Imaging ... [https://imotions.com/blog/learning/research-fundamentals/fnirs-vs-eeg/?srsltid=AfmBOopIffEqL-OABqwBKLgjIlCyNWBLor2MFnW1Jxgx4E4KZqsRyK9W]
- 26. Comparison of fNIRS with other neuroimaging modalities [https://www.artinis.com/blogpost-all/comparison-fnirs-vs-fmri]
- 27. Neurovascular coupling during auditory stimulation [https://pmc.ncbi.nlm.nih.gov/articles/PMC10517045/]
- 28. Concurrent fNIRS and EEG for Brain Function Investigation [https://www.mdpi.com/1424-8220/22/15/5865]
- 29. Neurovascular Coupling by Functional Near Infra-Red ... [https://www.frontiersin.org/journals/human-neuroscience/articles/10.3389/fnhum.2020.00042/full]
- 30. fNIRS vs EEG: Comparing Non-Invasive Brain Imaging ... [https://imotions.com/blog/learning/research-fundamentals/fnirs-vs-eeg/?srsltid=AfmBOookW566MzOeKKNtBeVfG_iWX8deJUbF0vEjAyNaWLAFMvzggHUT]
- 31. Simultaneous EEG and fNIRS recordings for semantic ... [https://www.nature.com/articles/s41597-025-04967-0]
- 32. Low frequency oscillations reflect neurovascular coupling ... [https://www.nature.com/articles/s41598-024-61819-4]
- 33. fNIRS reproducibility varies with data quality, analysis ... [https://www.nature.com/articles/s42003-025-08412-1]
- 34. Overview of Functional Magnetic Resonance Imaging - PMC [https://pmc.ncbi.nlm.nih.gov/articles/PMC3073717/]
- 35. fNIRS vs EEG: Comparing Non-Invasive Brain Imaging ... [https://imotions.com/blog/learning/research-fundamentals/fnirs-vs-eeg/?srsltid=AfmBOoq-UpLWgSyzIlQtX9a17FHV8FC0dc-QulkGspRIXzeWEm1b7aHu]
- 36. fNIRS in the developmental sciences - PMC [https://pmc.ncbi.nlm.nih.gov/articles/PMC4979552/]
- 37. Temporal vs. spatial resolution and Consumer Neuroscience [https://medium.com/@Pedro_R_Almeida/temporal-vs-spatial-resolution-and-consumer-neuroscience-ca6b360c5890]
- 38. Spatial and temporal resolutions of EEG - PubMed Central - NIH [https://pmc.ncbi.nlm.nih.gov/articles/PMC4548479/]
- 39. Optimizing spatial specificity and signal quality in fNIRS [https://www.frontiersin.org/journals/neuroergonomics/articles/10.3389/fnrgo.2024.1286586/full]
- 40. Comparison of spatial and temporal independent ... [https://www.sciencedirect.com/science/article/abs/pii/S138824571300103X]
- 41. fNIRS vs EEG: Comparing Non-Invasive Brain Imaging ... [https://imotions.com/blog/learning/research-fundamentals/fnirs-vs-eeg/?srsltid=AfmBOop_M8eofeIJU-K_HIptNcUdaiCN2KpO7K89G90Lnur3NSuMlLGU]
- 42. Event-related potentials and changes of brain rhythm ... [https://pmc.ncbi.nlm.nih.gov/articles/PMC3297068/]
- 43. Hemodynamic (fNIRS) and EEG (N200) correlates of ... [https://www.nature.com/articles/srep23083]
- 44. Neural oscillations and event-related potentials reveal how ... [https://www.nature.com/articles/s41598-020-65872-7]
- 45. Alpha oscillations and event-related potentials reflect ... [https://elifesciences.org/articles/60874]
- 46. The functional near infrared spectroscopy applications in ... [https://pmc.ncbi.nlm.nih.gov/articles/PMC12209276/]
- 47. A Narrative Review on Clinical Applications of fNIRS - PMC [https://pmc.ncbi.nlm.nih.gov/articles/PMC7573058/]
- 48. Naturalistic fNIRS assessment reveals decline in executive ... [https://www.nature.com/articles/s41598-025-20844-7]
- 49. fNIRS vs EEG: Comparing Non-Invasive Brain Imaging ... [https://imotions.com/blog/learning/research-fundamentals/fnirs-vs-eeg/?srsltid=AfmBOopLsqIbGfPS86m0llGgL8xko4ymbA7VZSYllJPZYrZrnNM9Gi5a]
- 50. Advances and trends in the application of functional near- ... [https://www.frontiersin.org/journals/neurology/articles/10.3389/fneur.2024.1459214/full]
- 51. Current implications of EEG and fNIRS as functional ... [https://pmc.ncbi.nlm.nih.gov/articles/PMC11629311/]
- 52. The Application of Mobile fNIRS in Marketing Research ... [https://pmc.ncbi.nlm.nih.gov/articles/PMC6222120/]
- 53. A Cross-Disciplinary Review of the fNIRS-EEG Dual-Modality ... [https://pmc.ncbi.nlm.nih.gov/articles/PMC11506513/]
- 54. - EEG Cookbook | Brain Products GmbH fNIRS [https://www.brainproducts.com/support-resources/eeg-fnirs-cookbook/?seq_no=3]
- 55. Functional Near-Infrared Spectroscopy and Its Clinical ... [https://www.frontiersin.org/journals/neuroscience/articles/10.3389/fnins.2020.00724/full]
- 56. A systematic review on the role of EEG and fMRI ... [https://www.sciencedirect.com/science/article/abs/pii/S0165178125001222]
- 57. HEFMI-ICH: a hybrid EEG-fNIRS motor imagery dataset for ... [https://www.nature.com/articles/s41597-025-06100-7]
- 58. Simultaneous EEG-fNIRS study of visual cognitive processing [https://journals.plos.org/plosone/article?id=10.1371/journal.pone.0325017]
- 59. Diagnostic potential of near‐infrared spectroscopy in mild ... [https://pmc.ncbi.nlm.nih.gov/articles/PMC12505193/]
- 60. fNIRS - EEG | fNIRS Systems | NIRS Devices | NIRx [https://nirx.net/fnirs-eeg]
- 61. Multimodal fNIRS - EEG measurements — Staying in sync — Artinis... [https://www.artinis.com/blogpost-all/2023/multimodal-fnirs-eeg-measurements-staying-in-sync]
- 62. fNIRS vs EEG: Comparing Non-Invasive Brain Imaging ... [https://imotions.com/blog/learning/research-fundamentals/fnirs-vs-eeg/?srsltid=AfmBOorlNH5TGE6yyeZHH4jd0oAKOtRNuidoo8t4V-uK2AfueNQbLSX9]
- 63. Wearable fNIRS platform for dense sampling and precision ... [https://www.nature.com/articles/s41746-025-01690-3]
- 64. The application of fNIRS in studies on occupational workload [https://pmc.ncbi.nlm.nih.gov/articles/PMC12053328/]
- 65. EFRM: A Multimodal EEG–fNIRS Representation-learning ... [https://www.sciencedirect.com/science/article/abs/pii/S0010482525016464]
- 66. Riemannian geometry boosts functional near-infrared ... [https://pmc.ncbi.nlm.nih.gov/articles/PMC12523035/]
- 67. Low-field and portable MRI technology - PubMed Central - NIH [https://pmc.ncbi.nlm.nih.gov/articles/PMC12549457/]
- 68. Top 5 EEG Devices of 2025 [https://ajprotech.com/blog/articles/top-10-eeg-devices-of-2025.html]
- 69. Top 7 brain training devices 2025: Muse, Mendi & more [https://choosemuse.com/blogs/news/top-brain-training-devices-2025?srsltid=AfmBOor_X9SEekehNRHaddTCl5L3TTuLayThQ1M7p4uD2DK-3v5tHA2M]
- 70. Combining Virtual Reality and wearable fNIRS [https://www.artinis.com/blogpost-all/2022/combining-virtual-reality-and-portable-fnirs]
- 71. Evaluating the effects of multimodal EEG-fNIRS ... [https://pmc.ncbi.nlm.nih.gov/articles/PMC12425317/]
- 72. Different Types of Mri Machines in 2025 [https://rayatgrup.com/type-of-mri-machine/]
- 73. Artifact Management for Cerebral Near-Infrared ... [https://pmc.ncbi.nlm.nih.gov/articles/PMC11428271/]
- 74. Motion artifacts removal and evaluation techniques for ... [https://www.frontiersin.org/journals/neuroscience/articles/10.3389/fnins.2022.878750/full]
- 75. Medical Science Monitor | Functional Near-Infrared Spectroscopy in... [https://medscimonit.com/abstract/full/idArt/949491]
- 76. Sensitive and specific fNIRS-based approach for awareness ... [https://pmc.ncbi.nlm.nih.gov/articles/PMC12521986/]
- 77. Physiological noise reduction using volumetric functional ... [https://pmc.ncbi.nlm.nih.gov/articles/PMC3586826/]
- 78. Artifacts Contaminating Your EEG Recordings [https://www.neuroelectrics.com/blog/artifacts-contaminating-your-eeg-recordings]
- 79. NiReject: toward automated bad channel detection in ... [https://pmc.ncbi.nlm.nih.gov/articles/PMC11532795/]
- 80. Model-based physiological noise removal in fast fMRI [https://www.sciencedirect.com/science/article/pii/S1053811919308225]
- 81. EEG is better left alone | Scientific Reports [https://www.nature.com/articles/s41598-023-27528-0]
- 82. NIRx | fNIRS Systems | NIRS Devices [https://nirx.net/]
- 83. EEG and fNIRS Eye-Tracking Research Solutions [https://www.sr-research.com/solutions/eeg-fnirs-solutions/]
- 84. Investigating the interaction between EEG and fNIRS [https://www.sciencedirect.com/science/article/pii/S1877750324002096]
- 85. fNIRS vs EEG: Comparing Non-Invasive Brain Imaging ... [https://imotions.com/blog/learning/research-fundamentals/fnirs-vs-eeg/?srsltid=AfmBOooT_A-pKNU1QxtIqb9NRlBELunmF4cTpNjLixrcz2RQDbdRnAC7]
- 86. Head-Specific Spatial Spectra of Electroencephalography ... [https://pmc.ncbi.nlm.nih.gov/articles/PMC12467547/]
- 87. Differentiating BOLD and non-BOLD signals in fMRI time ... [https://pubmed.ncbi.nlm.nih.gov/41064374/]
- 88. Effective Functional Pattern Between Prefrontal fNIRS Activity ... [https://pmc.ncbi.nlm.nih.gov/articles/PMC12463692/]
- 89. Step-Aware Residual-Guided Diffusion for EEG Spatial ... [https://arxiv.org/html/2510.19166v1]
- 90. High-density multidistance fNIRS enhances detection of ... [https://pmc.ncbi.nlm.nih.gov/articles/PMC12412631/]
- 91. fNIRS vs EEG: Comparing Non-Invasive Brain Imaging ... [https://imotions.com/blog/learning/research-fundamentals/fnirs-vs-eeg/?srsltid=AfmBOopNlKUlkXSzkPutLoPG-CDa2xaa2WE1j27ZcG_XmK7nQ5aJ815w]
- 92. Multi-Modal Integration of EEG-fNIRS for Brain-Computer ... [https://www.frontiersin.org/journals/human-neuroscience/articles/10.3389/fnhum.2017.00503/full]
- 93. Simultaneous functional near-infrared spectroscopy and ... [https://pmc.ncbi.nlm.nih.gov/articles/PMC5566595/]
- 94. Enhanced spatiotemporal resolution imaging of neuronal ... [https://pmc.ncbi.nlm.nih.gov/articles/PMC7778454/]
- 95. Concurrent fNIRS-fMRI measurement to validate a method for ... [https://pmc.ncbi.nlm.nih.gov/articles/PMC4478864/]
- 96. Spatial correspondence of cortical activity measured with ... [https://www.sciencedirect.com/science/article/pii/S1053811924000648]
- 97. fMRI-based validation of continuous-wave fNIRS ... [https://www.nature.com/articles/s41598-022-06519-7]
- 98. A quantitative comparison of simultaneous BOLD fMRI and ... [https://pubmed.ncbi.nlm.nih.gov/12377147/]
- 99. a simultaneous fNIRS-fMRI study [https://pmc.ncbi.nlm.nih.gov/articles/PMC9896013/]
- 100. Dynamic causal modelling on infant fNIRS data [https://www.sciencedirect.com/science/article/pii/S1053811918303185]
- 101. EEG vs. MRI vs. fMRI - What are the Differences? [https://imotions.com/blog/learning/research-fundamentals/eeg-vs-mri-vs-fmri-differences/?srsltid=AfmBOopWwCL-tvN0Ol4OUveLFy00tkNS_JZ7FEk2ZDEanjDgILxKlnnv]
- 102. A quantitative comparison of NIRS and fMRI across multiple ... [https://pmc.ncbi.nlm.nih.gov/articles/PMC3021967/]
- 103. A Simultaneous fNIRS, fMRI, EEG Study [https://pubmed.ncbi.nlm.nih.gov/27438589/]
- 104. Reliability of brain metrics derived from a Time-Domain ... [https://www.nature.com/articles/s41598-024-68555-9]