fMRI vs. fNIRS vs. EEG: A Comprehensive Cost-Effectiveness Analysis for Biomedical Research and Clinical Applications
This article provides a detailed cost-effectiveness analysis of three prominent neuroimaging modalities—functional Magnetic Resonance Imaging (fMRI), functional Near-Infrared Spectroscopy (fNIRS), and Electroencephalography (EEG)—for researchers and drug development professionals.
fMRI vs. fNIRS vs. EEG: A Comprehensive Cost-Effectiveness Analysis for Biomedical Research and Clinical Applications
Abstract
This article provides a detailed cost-effectiveness analysis of three prominent neuroimaging modalities—functional Magnetic Resonance Imaging (fMRI), functional Near-Infrared Spectroscopy (fNIRS), and Electroencephalography (EEG)—for researchers and drug development professionals. We explore the foundational principles, technical specifications, and inherent trade-offs of each technology. The analysis extends to methodological applications across various clinical and research scenarios, from motor rehabilitation and cognitive neuroscience to portable brain-computer interfaces. We address key troubleshooting challenges, including data quality, standardization, and analytical variability, and present a rigorous comparative validation of performance metrics. By synthesizing current evidence and emerging trends, this review offers a strategic framework for selecting the most appropriate and cost-efficient neuroimaging tool based on specific research goals, budget constraints, and target populations.
Understanding the Neuroimaging Trio: Core Principles and Inherent Trade-offs of fMRI, fNIRS, and EEG
Understanding the biophysical basis of brain activity is essential for advancing cognitive neuroscience and developing clinical applications. This guide provides an objective comparison of three dominant neuroimaging modalities: functional Magnetic Resonance Imaging (fMRI), electroencephalography (EEG), and functional Near-Infrared Spectroscopy (fNIRS). Each technique captures distinct facets of neural processes, from direct electrical activity to indirect hemodynamic responses. fMRI measures Blood-Oxygen-Level-Dependent (BOLD) signals, EEG records electrical potentials, and fNIRS detects hemoglobin concentration changes. The selection of an appropriate technique involves balancing spatial and temporal resolution, depth penetration, operational constraints, and cost. This comparison, framed within a cost-effectiveness analysis, synthesizes current experimental data to help researchers and drug development professionals optimize their neuroimaging strategies for both basic research and clinical applications.
Fundamental Principles and Signal Origins
The Neurovascular Coupling and BOLD Signal
The BOLD signal, the cornerstone of fMRI, is an indirect reflection of neuronal activity that arises from a complex physiological cascade known as neurovascular coupling [1]. When a brain region becomes active, it triggers a series of events leading to changes in blood flow, volume, and oxygen metabolism. The BOLD signal is primarily determined by the change in paramagnetic deoxygenated hemoglobin (HbR), which acts as an endogenous contrast agent [1] [2]. The core physiological process involves an increase in neuronal activity, leading to a disproportionate increase in cerebral blood flow (CBF) relative to the cerebral metabolic rate of oxygen consumption (CMRO2). This mismatch results in a local decrease in deoxyhemoglobin concentration, which reduces the magnetic susceptibility differences between blood vessels and surrounding tissue, thereby increasing the T2*-weighted MRI signal [2].
Recent biophysical models highlight the role of calcium signaling in astrocytes as a key mechanism in neurovascular coupling [3]. This neuron-astrocyte-vascular pathway involves glutamate-mediated calcium increases in astrocytes, triggering the production of vasoactive substances like prostaglandins that dilate arterioles and increase blood flow [3]. The dynamics of this coupling explain characteristic BOLD signal transients, including the initial dip, the main positive BOLD response, and the post-stimulus undershoot [1] [3].
Direct Electrical Activity Measured by EEG
In contrast to hemodynamic methods, EEG measures the electrical activity of neurons directly. EEG records voltage fluctuations resulting from ionic current flows within the neurons of the brain, particularly post-synaptic potentials of cortical pyramidal neurons [4]. These electrical signals propagate through the brain tissues and skull to be recorded by electrodes on the scalp. EEG excels in temporal resolution at the millisecond level, allowing it to capture the rapid dynamics of brain oscillations across different frequency bands (delta, theta, alpha, beta, gamma) [4] [5]. However, the spatial resolution of EEG is limited because electrical signals are attenuated and blurred as they pass through various tissue layers between the cortex and scalp [5] [6].
Hemodynamic Signals Measured by fNIRS
fNIRS occupies a middle ground between fMRI and EEG, measuring hemodynamic responses similar to fMRI but with greater portability. fNIRS utilizes near-infrared light (650-950 nm) to measure changes in oxygenated hemoglobin (HbO) and deoxygenated hemoglobin (HbR) concentrations in the superficial cortex [4] [7]. Like fMRI, fNIRS signals are based on neurovascular coupling, but unlike fMRI which measures the BOLD effect, fNIRS directly quantifies hemoglobin concentration changes using the modified Beer-Lambert law [7]. The technique is sensitive to cortical activity up to approximately 1-3 cm depth, limited by photon scattering and absorption in biological tissues [7].
Table 1: Fundamental Signal Properties of Major Neuroimaging Modalities
| Property | fMRI | EEG | fNIRS |
|---|---|---|---|
| Primary Signal Source | BOLD contrast (deoxyhemoglobin) | Neuronal electrical potentials | HbO and HbR concentration changes |
| Temporal Resolution | 0.5-2 Hz (limited by hemodynamic response) [7] | Millisecond level (~1000 Hz) [4] [5] | Up to 10+ Hz [8] |
| Spatial Resolution | Millimeter level (1-3 mm) [7] | Centimetre level (~2 cm) [6] | 1-3 centimetres [7] |
| Depth Penetration | Whole brain (cortical and subcortical) [7] | Superficial cortical layers | Superficial cortex (up to 1-3 cm depth) [7] |
| Neurovascular Coupling | Central to signal generation [1] [2] | Independent of neurovascular coupling | Central to signal generation [4] |
| Key Biophysical Basis | Magnetic susceptibility of deoxyhemoglobin; neurovascular coupling via astrocytes [3] [2] | Post-synaptic potentials of synchronized neuronal populations [4] | Light absorption spectra of HbO and HbR [7] |
Technical Comparison and Experimental Data
Performance Metrics Across Modalities
The complementary strengths and limitations of fMRI, EEG, and fNIRS become evident when comparing their technical specifications across various performance metrics critical for experimental design and clinical application.
Table 2: Comprehensive Technical Comparison of fMRI, EEG, and fNIRS
| Performance Metric | fMRI | EEG | fNIRS |
|---|---|---|---|
| Temporal Resolution | Low (0.5-2 Hz sampling rate) [7] | Very High (up to 1000 Hz) [5] | Moderate (typically 2-10 Hz) [8] |
| Spatial Resolution | High (millimeter level) [7] | Low (centimeter level) [6] | Moderate (1-3 cm) [7] |
| Portability | None (requires immobile scanner) [7] | High (portable systems available) [4] | High (portable/wearable systems) [7] |
| Environment Tolerance | Restrictive (sensitive to motion) [7] | Tolerant of movement [4] | Tolerant of movement [4] |
| Subject Population Flexibility | Limited (claustrophobia, implants) | Broad (infants to elderly) [5] | Broad (infants to elderly) [7] |
| Whole-Brain Coverage | Excellent (cortical and subcortical) [7] | Good (but limited to cortical surface) | Limited to superficial cortical regions [7] |
| Cost | Very High (equipment and maintenance) [5] | Low [4] [5] | Moderate [5] |
| Operational Complexity | High (requires specialized facility) | Low to Moderate [5] | Moderate [5] |
Experimental Validation and Concordance Studies
Direct comparison studies reveal important concordance patterns between modalities. During a finger-tapping task, fNIRS activation over the contralateral primary motor cortex corresponded well with surface fMRI activity [9]. Similarly, during auditory tasks, fNIRS detected bilateral temporal lobe activation in the same primary auditory regions as surface fMRI [9]. However, some fNIRS channels showed significant activity that didn't correspond to surface fMRI, highlighting methodological differences [9].
The relationship between electrical and hemodynamic activity varies across brain regions. Structure-function coupling analyses show that fNIRS-based functional networks resemble those derived from slower-frequency EEG bands at rest [8]. Regionally, stronger coupling between electrical and hemodynamic activities occurs in unimodal sensory cortex, while greater decoupling appears in transmodal association cortex, following a unimodal to transmodal organizational gradient [8].
Cost-Effectiveness Analysis
From a cost-effectiveness perspective, EEG emerges as the most economical option with excellent temporal resolution, making it ideal for studies requiring precise timing information or large participant cohorts [4] [5]. fNIRS offers a favorable balance between cost and spatial specificity for hemodynamic responses, with the added advantage of portability for naturalistic studies [7] [5]. fMRI, while most expensive, provides unparalleled spatial resolution and whole-brain coverage, justifying its cost for studies requiring precise localization or subcortical imaging [7] [5].
The integration of multiple modalities can offer superior cost-effectiveness for specific applications. Combined fNIRS-EEG systems, for instance, provide simultaneous electrical and hemodynamic information at a fraction of the cost of fMRI, making them particularly valuable for clinical monitoring and developmental studies [4] [5].
Experimental Protocols and Methodologies
Protocol for Combined fNIRS-EEG Recording
Simultaneous fNIRS-EEG recording requires careful experimental design to optimize data quality from both modalities [5]:
Equipment Setup: Integrate fNIRS optodes and EEG electrodes into a single headcap, ensuring proper positioning according to the international 10-20 or 10-5 systems for co-registration [8] [5]. Use 3D-printed or thermoplastic customized helmets to ensure consistent optode and electrode placement across subjects [5].
Signal Acquisition: For EEG, record with at least 30 electrodes at a sampling rate of 1000 Hz (down-sampled to 200 Hz for analysis) [8]. For fNIRS, use sources emitting at two wavelengths (typically 760 nm and 850 nm) with a sampling rate of 10-12.5 Hz to adequately capture hemodynamic responses [8].
Experimental Paradigm: Implement task designs with appropriate baselines. For motor imagery tasks, use 30 trials of 10-second task periods interspersed with rest periods [8]. For semantic decoding, present stimuli for 3-5 seconds followed by mental imagery periods [6].
Data Quality Control: For fNIRS, apply the scalp-coupling index (SCI) to assess signal quality, excluding channels with SCI < 0.7 [8]. Monitor for excessive head movements using metrics like global variance in temporal derivative (GVTD) and reject contaminated segments [8].
Protocol for Validating fNIRS with fMRI
Validation studies comparing fNIRS with fMRI employ simultaneous or same-day recording protocols [9]:
Session Design: Conduct same-day fNIRS-fMRI studies where participants first undergo fMRI scanning followed by fNIRS recording, performing identical tasks in both sessions [9].
Task Selection: Use well-established functional localizer tasks including motor tasks (e.g., finger tapping) and cognitive tasks (e.g., auditory discrimination or semantic decision tasks) [9].
Data Analysis: Apply first- and second-level general linear models to both datasets for statistical parametric mapping [9]. Coregister fNIRS channels to fMRI space using digitized electrode positions or template-based alignment [9].
Concordance Assessment: Compare activation patterns for spatial overlap, lateralization, and temporal characteristics, recognizing that some discordance is expected due to different physiological sensitivities [9].
Signaling Pathways and Neurovascular Coupling
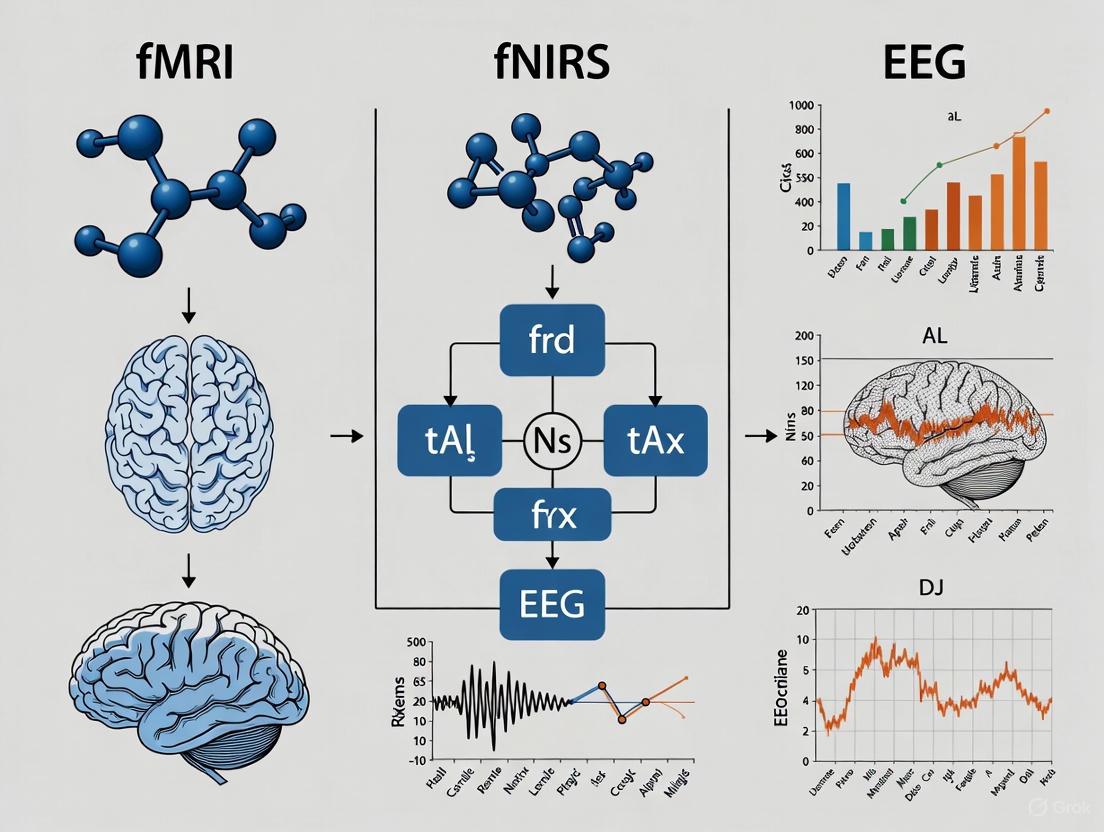
The relationship between neuronal activity and hemodynamic responses involves a complex signaling pathway. The following diagram illustrates the primary mechanisms of neurovascular coupling that generate the BOLD signal for fMRI and the hemoglobin concentration changes for fNIRS:
Neurovascular Coupling from Neuronal Activity to BOLD and fNIRS Signals
This diagram illustrates the primary signaling pathway linking neuronal activity to hemodynamic responses. The process begins with glutamate release from active neurons, which triggers calcium dynamics in astrocytes [3]. These calcium signals stimulate the production of vasoactive substances like prostaglandins (PGE2) and epoxyeicosatrienoic acids (EETs) [3]. These compounds cause arteriole dilation, leading to increased cerebral blood flow [3] [2]. The resulting oversupply of oxygenated blood relative to metabolic demand causes an increase in oxygenated hemoglobin (HbO) - the primary signal for fNIRS - and a decrease in deoxygenated hemoglobin (HbR) - the source of the BOLD signal for fMRI [1] [2]. This pathway highlights how fMRI and fNIRS both measure hemodynamic consequences of neural activity, while EEG directly measures the electrical activity itself.
Essential Research Reagent Solutions
Successful implementation of neuroimaging studies requires specific technical components and analytical tools. The following table details essential research solutions for studies involving these modalities:
Table 3: Essential Research Reagent Solutions for Neuroimaging Studies
| Solution Category | Specific Examples | Function and Application |
|---|---|---|
| fMRI Data Analysis | Physiologically-informed Dynamic Causal Modeling (P-DCM) [1] | Generative model to determine effective connectivity between brain regions |
| fMRI Biophysical Modeling | Laminar BOLD Signal Model [1] | Extends modeling to high-resolution, cortical-depth resolved BOLD data |
| EEG Analysis | Power Spectral Density (PSD) Analysis [4] | Quantifies power in different frequency bands (delta, theta, alpha, beta, gamma) |
| EEG Biomarkers | Power Ratio Index (PRI), Brain Symmetry Index (BSI) [4] | Prognostic markers for motor recovery; quantifies interhemispheric asymmetry |
| fNIRS Signal Processing | Principal Component Analysis (PCA) for physiological noise removal [8] | Reduces systemic physiological effects and superficial skin responses |
| fNIRS Quality Metrics | Scalp-Coupling Index (SCI) [8] | Assesses fNIRS signal quality based on heart-rate correlation |
| Multimodal Integration | Integrated fNIRS-EEG Helmets [5] | Customized headgear for simultaneous acquisition with precise co-registration |
| Multimodal Analysis | Graph Signal Processing (GSP) Framework [8] | Mathematical framework for combining structure-function analyses across modalities |
| Neurovascular Modeling | Balloon Model [3] [2] | Models hemodynamic responses and BOLD signal formation from blood flow changes |
| Calcium Imaging | Li-Rinzel Model with IP3 Dynamics [3] | Describes calcium flux between cytosolic and endoplasmic reticulum compartments |
The selection of an appropriate neuroimaging modality depends critically on the specific research question, required spatial and temporal resolution, subject population, and budget constraints. fMRI provides unparalleled spatial resolution for localizing brain activity, particularly in deep structures, but at high cost and limited temporal resolution. EEG offers millisecond-level temporal precision for capturing neural dynamics at a lower cost, but with limited spatial specificity. fNIRS represents a balanced compromise with moderate spatial and temporal resolution, excellent portability, and lower cost, though restricted to superficial cortical regions. The integration of multiple modalities, particularly fNIRS-EEG, presents a promising direction for comprehensive brain mapping that captures both electrical and hemodynamic aspects of neural activity. Understanding the biophysical basis of these signals, particularly the neurovascular coupling mechanisms that generate BOLD and fNIRS responses, is essential for proper experimental design and data interpretation across all these techniques.
In the pursuit of understanding brain function, researchers must navigate the fundamental trade-off between temporal resolution (the ability to track rapid changes in neural activity) and spatial resolution (the precision in locating where this activity occurs). This comparison guide provides an objective analysis of three non-invasive neuroimaging techniques—functional magnetic resonance imaging (fMRI), electroencephalography (EEG), and functional near-infrared spectroscopy (fNIRS)—framed within a cost-effectiveness context crucial for research and drug development. Each technique captures different physiological aspects of brain activity: fMRI and fNIRS measure hemodynamic responses (blood oxygenation changes), while EEG directly measures electrical activity from neuronal firing [10] [11] [7]. Understanding their spatiotemporal capabilities and limitations enables scientists to select the most appropriate tool for specific research questions, from basic cognitive neuroscience to clinical trials and pharmaceutical development.
Technical Specifications: Quantitative Comparison
Table 1: Core Technical Specifications of fMRI, fNIRS, and EEG
| Feature | fMRI | fNIRS | EEG |
|---|---|---|---|
| Spatial Resolution | High (millimeters) [11] [7] | Moderate (centimeters) [10] [7] | Low (centimeters) [10] [11] |
| Temporal Resolution | Low (seconds) [11] [7] | Moderate (seconds) [10] [11] | High (milliseconds) [10] [11] |
| Depth of Measurement | Whole brain (cortical & subcortical) [7] | Superficial cortex (1-2.5 cm) [10] [7] | Cortical surface [10] |
| Primary Signal | Blood Oxygenation (BOLD) [7] | Hemoglobin concentration (HbO/HbR) [12] [10] | Electrical potentials [10] [13] |
| Portability | Low (immobile scanner) [7] | High (wearable systems) [14] [7] | High (wearable systems) [13] |
Table 2: Practical Research Considerations
| Consideration | fMRI | fNIRS | EEG |
|---|---|---|---|
| Approximate Cost | Very High (>$1000/scan) [11] | Moderate [10] | Low to Moderate [10] |
| Environment | Restrictive, loud [7] | Naturalistic, mobile [10] [7] | Controlled lab to naturalistic [10] |
| Tolerance to Movement | Low [7] | High [10] | Low to Moderate [10] |
| Setup Time | Minutes (subject positioning) | Minutes [12] | Moderate (can require gel application) [10] [11] |
Experimental Protocols & Methodologies
Protocol for Simultaneous EEG-fNIRS Recording
The integration of EEG and fNIRS has become a powerful multimodal approach to overcome the limitations of either technique used individually [12] [6]. The following protocol outlines a standard methodology for simultaneous data acquisition.
Title: Simultaneous EEG-fNIRS Experimental Workflow
Key Research Reagent Solutions:
- Integrated EEG-fNIRS Cap: Utilizes the international 10-20 system for standardized sensor placement. Often made of elastic fabric with pre-defined openings to accommodate both EEG electrodes and fNIRS optodes, ensuring co-registration of measurement channels [12] [10].
- EEG Electrodes & Conductive Gel: Ag/AgCl electrodes are standard for high-quality signal acquisition. Conductive gel reduces impedance between the scalp and electrode, improving signal quality, though preparation time is longer than dry electrodes [10] [13].
- fNIRS Optodes (Sources & Detectors): Sources emit near-infrared light (typically at 760 and 850 nm), and detectors measure light intensity after passing through brain tissue. The inter-optode distance (e.g., 30 mm) determines penetration depth and spatial resolution [8] [6].
- Synchronization Interface: A crucial hardware or software component (e.g., TTL pulses, shared clock systems) that temporally aligns the EEG and fNIRS data streams with millisecond precision, enabling meaningful multimodal analysis [12] [10].
- Motion Tracking Sensors: Inertial Measurement Units (IMUs) containing accelerometers and gyroscopes are sometimes integrated to monitor head movement. This data is used post-hoc to identify and correct motion artifacts in both EEG and fNIRS signals [13].
Protocol for fMRI-fNIRS Validation Studies
fMRI is often used as a gold standard to validate fNIRS measurements due to their shared physiological basis (hemodynamic response). This protocol is common in methodological studies.
Title: fMRI-fNIRS Validation Protocol
Signaling Pathways & Physiological Basis
The signals measured by fMRI, fNIRS, and EEG originate from fundamentally different but related physiological processes. The following diagram illustrates the neurovascular coupling pathway linking neuronal electrical activity to hemodynamic changes.
Title: From Neural Firing to Hemodynamic Response
Cost-Effectiveness Analysis in Research & Drug Development
The choice of neuroimaging technology has significant implications for research design, operational costs, and the ecological validity of findings, all critical factors in drug development.
Table 3: Cost-Effectiveness and Application Scope
| Aspect | fMRI | fNIRS | EEG |
|---|---|---|---|
| Capital & Operational Costs | Very high (equipment, maintenance, site) [11] [7] | Moderate [10] | Low to Moderate [10] |
| Participant Throughput | Low | High [10] [7] | High [10] |
| Ecological Validity | Low (restrictive environment) [7] | High (naturalistic settings, tolerance to movement) [10] [15] | Moderate (lab to mobile) [10] |
| Best-Suited Research Applications | Precise spatial localization of drug targets, deep brain structure studies [7] | Longitudinal therapy monitoring, pediatric studies, real-world cognitive testing, clinical trials [12] [15] | Rapid cognitive processing, sleep studies, epilepsy monitoring, brain-computer interfaces [10] [13] |
Strategic Implications for Drug Development
- fMRI is unparalleled for target validation and engagement studies in early-phase trials where precise anatomical localization of a drug's effect is paramount, despite its high cost [7].
- fNIRS offers a compelling solution for proof-of-concept and longitudinal efficacy trials, especially in psychiatric and neurological disorders (e.g., ADHD, epilepsy, addiction) [12] [15]. Its portability allows for repeated measurements in clinical settings, reducing patient burden and cost per scan.
- EEG provides unmatched value for quantifying direct neural effects with high temporal resolution, ideal for studying acute drug impacts on brain networks, seizure activity, or sleep architecture [10] [13].
- Multimodal approaches (EEG+fNIRS) are increasingly valuable for comprehensive biomarker development, offering a more complete picture of neurovascular coupling and brain function, which can enhance the sensitivity of clinical trials [12] [14] [6].
The spatiotemporal resolution showdown between fMRI, fNIRS, and EEG reveals a landscape of complementary strengths rather than a single superior technology. fMRI remains the gold standard for high-resolution spatial mapping of deep brain structures. EEG provides unparalleled insight into the brain's millisecond-scale electrical dynamics. fNIRS occupies a strategic middle ground, offering a favorable balance of moderate spatiotemporal resolution, portability, and tolerance for movement, which is invaluable for ecologically valid research and clinical applications. From a cost-effectiveness perspective, the choice depends critically on the research question. For drug development professionals, this analysis underscores that fNIRS and EEG present economically viable and scientifically robust alternatives or supplements to fMRI for many clinical trial scenarios, particularly those requiring longitudinal monitoring, naturalistic settings, or specific electrophysiological biomarkers.
Understanding the intricate functions of the human brain requires tools that can capture its complexity without constraining its natural operation. Neuroimaging technologies exist on a spectrum, balancing the conflicting demands of high spatial resolution, high temporal resolution, portability, and ecological validity. On one end, highly controlled laboratory environments offer precision at the cost of real-world relevance; on the other, naturalistic settings provide ecological validity while introducing measurement challenges.
This guide objectively compares three foundational neuroimaging modalities—functional Magnetic Resonance Imaging (fMRI), functional Near-Infrared Spectroscopy (fNIRS), and Electroencephalography (EEG)—framed within a cost-effectiveness analysis for research and drug development. We examine their core technical capabilities, portability, and suitability for naturalistic paradigms, providing a structured framework for selecting the optimal tool based on specific research goals and constraints.
Core Technology Comparison: fMRI, fNIRS, and EEG
The following table summarizes the fundamental characteristics, strengths, and limitations of each modality.
Table 1: Fundamental comparison of fMRI, fNIRS, and EEG technologies.
| Feature | fMRI | fNIRS | EEG |
|---|---|---|---|
| What It Measures | Blood Oxygenation Level Dependent (BOLD) signal [7] | Concentration changes in oxygenated (HbO) and deoxygenated hemoglobin (HbR) [16] | Electrical potentials from synchronized neuronal firing [16] |
| Spatial Resolution | High (millimeter-level) [7] | Moderate (1-3 cm) [7] | Low (centimeter-level) [16] |
| Temporal Resolution | Low (seconds, limited by hemodynamic response) [7] | Low (seconds, limited by hemodynamic response) [16] | High (milliseconds) [16] |
| Depth Penetration | Whole brain (cortical and subcortical) [7] | Superficial cortex (1-2.5 cm) [7] [16] | Cortical surface [16] |
| Portability | Very Low (immobile scanner) [7] | High (wearable systems available) [17] | High (lightweight, wireless systems) [16] |
| Tolerance to Motion Artifacts | Very Low [7] | Moderate/High [16] [18] | Low [16] |
| Relative Operational Cost | Very High | Moderate [19] | Low [16] |
| Best Suited For | Localizing deep brain activity with high precision; validating other modalities [7] | Naturalistic studies of cortical function; clinical bedside monitoring; child development [7] [17] | Studying rapid cognitive processes (e.g., ERPs); sleep research; brain-computer interfaces (BCIs) [16] |
The Portability and Ecological Validity Spectrum
Ecological validity refers to how well an experimental setting reflects real-world experiences and natural behavior. Portability is a key enabler of ecological validity, allowing brain imaging to move from the scanner to environments that mimic daily life.
Table 2: Comparative analysis of portability and ecological validity for fMRI, fNIRS, and EEG.
| Aspect | fMRI | fNIRS | EEG |
|---|---|---|---|
| Typical Environment | Highly controlled, shielded scanner room [7] | Lab, clinic, classroom, and some real-world settings [17] [18] | Controlled lab environments are ideal, but mobile setups are feasible [16] |
| Subject Mobility | Must remain completely still, lying down [7] | Allows for seated, standing, and some ambulatory movement [17] | Limited mobility; best with minimal movement [16] |
| Naturalistic Paradigm Suitability | Low; constrained by noise, posture, and limited stimulus presentation [20] | High; suitable for dynamic stimuli, social interactions, and rehabilitation exercises [7] [20] | Moderate; suitable for dynamic audio-visual stimuli but sensitive to motion artifacts [20] |
| Key Strengths in Context | Gold standard for spatial localization and validating other modalities [7] | Excellent balance of mobility, comfort, and cortical mapping in semi-naturalistic settings [17] [18] | Unparalleled for studying the timing of neural processes in response to stimuli [16] |
Signaling Pathways and Physiological Basis
The following diagram illustrates the physiological events measured by each modality, from neural activity to the recorded signal.
Experimental Protocols and Methodologies
Protocol 1: Naturalistic fNIRS Assessment of Executive Function
This protocol exemplifies the use of wearable fNIRS to study cognitive impacts in a semi-naturalistic setting [17].
- Objective: To investigate the immediate impact of passive social media scrolling on executive functioning (EF) in college students.
- Participants: Twenty participants divided into social media use and control groups.
- Setup: A quiet, private room in a student residence building to enhance ecological validity. A wearable fNIRS system measured prefrontal cortex (PFC) activity.
- Task Design:
- Pre-Intervention Baseline: Participants completed EF tasks (n-back for working memory, Go/No-Go for inhibition).
- Intervention: The social media group scrolled Instagram for a brief period; the control group rested.
- Post-Intervention Assessment: Participants repeated the EF tasks.
- Key Metrics: Behavioral performance (task accuracy) and neural activity (oxygenated hemoglobin levels in PFC subregions).
- Findings: Post-social media use, participants showed reduced behavioral accuracy and altered PFC activation—increased medial PFC activity (suggesting compensatory effort) and decreased dorsolateral and ventrolateral PFC activity (indicating impaired working memory and inhibition) [17].
Protocol 2: Multimodal EEG-fNIRS for Motor Imagery Neurofeedback
This protocol details a method for combining EEG and fNIRS to enhance Brain-Computer Interface (BCI) applications, such as post-stroke motor rehabilitation [19].
- Objective: To evaluate the effects of multimodal EEG-fNIRS neurofeedback (NF) during upper-limb motor imagery (MI) tasks.
- Participants: Thirty right-handed healthy volunteers.
- Setup: A custom cap integrating 32 EEG electrodes and fNIRS optodes (16 sources, 16 detectors) positioned over the sensorimotor cortices.
- Task Design:
- Calibration: A baseline session to parameterize the NF score calculation for each individual.
- NF Conditions: Participants underwent three randomized NF conditions: EEG-only, fNIRS-only, and combined EEG-fNIRS.
- Motor Imagery Task: In each condition, participants performed imagery of left-hand movement. A visual feedback gauge (a ball moving on a screen) moved according to their real-time brain activity level.
- Key Metrics: The NF score (derived from right motor cortex activity), sensorimotor cortex activation patterns, and participant-reported control and vividness.
- Hypothesis: Presenting NF based on combined EEG and fNIRS signals will result in higher and more specific task-related brain activity than unimodal NF [19].
Protocol 3: Semantic Neural Decoding with Simultaneous EEG-fNIRS
This protocol explores hybrid systems for decoding semantic information, a step toward more intuitive communication BCIs [21].
- Objective: To differentiate between semantic categories (animals vs. tools) during silent naming and sensory-based mental imagery tasks.
- Participants: Twelve native English speakers.
- Setup: Simultaneous recording of EEG and fNIRS signals. fNIRS optodes were placed over frontal or temporal regions based on the montage.
- Task Design:
- Stimulus Presentation: Participants were shown images of animals or tools.
- Mental Tasks: For each image, participants performed four randomly ordered tasks:
- Silent Naming: Silently naming the object.
- Visual Imagery: Visualizing the object.
- Auditory Imagery: Imagining sounds associated with the object.
- Tactile Imagery: Imagining the feeling of touching the object.
- Key Metrics: Classifier accuracy in distinguishing between animal and tool categories based on features extracted from EEG, fNIRS, or their combination.
- Rationale: Combining EEG's temporal precision with fNIRS's spatial information provides a richer feature set for decoding complex mental states [21].
The Scientist's Toolkit: Essential Research Reagents and Materials
Table 3: Key equipment and materials for multimodal neuroimaging research.
| Item | Function | Example Use Cases |
|---|---|---|
| Integrated EEG-fNIRS Caps | A headcap with pre-defined layouts that hold EEG electrodes and fNIRS optodes, ensuring consistent co-registration and minimizing interference [19]. | Motor imagery studies [19], cognitive workload assessment [22]. |
| Synchronization Hardware/Software | External hardware (e.g., TTL pulses) or software to align EEG and fNIRS data streams with sub-second precision, which is crucial for multimodal fusion [16]. | All simultaneous EEG-fNIRS experiments requiring temporal alignment of electrical and hemodynamic events [19] [14]. |
| Short-Separation fNIRS Channels | fNIRS source-detector pairs placed a few millimeters apart. They measure systemic physiological noise from the scalp, which can be regressed out to improve signal quality [14]. | Studies involving motion or strong physiological confounds to isolate cerebral signals [14]. |
| Motion Tracking Systems | Cameras or inertial measurement units (IMUs) to track head movement. This data is used to identify and correct motion artifacts during data preprocessing. | Naturalistic studies with significant participant movement [14]. |
| Data Fusion Software Platforms | Software implementing algorithms like Joint Independent Component Analysis (jICA), Canonical Correlation Analysis (CCA), or machine learning models to integrate features from multiple modalities [16] [14]. | Hybrid BCI systems [19] [22], cognitive state decoding [21]. |
Cost-Effectiveness Analysis in Research and Drug Development
Choosing a neuroimaging tool involves a strategic trade-off between financial cost and the value of the information obtained.
- fMRI: The highest operational cost (scanner maintenance, helium, facility overhead) and patient throughput limitations make it expensive for large-scale or longitudinal studies. Its cost-effectiveness is highest when the primary research question demands precise spatial localization of deep brain structures, such as in target validation for a drug acting on the hippocampus or amygdala [7].
- fNIRS: Offers a favorable cost-profile for studies prioritizing ecological validity and portability without sacrificing all spatial specificity for cortical regions. It is highly cost-effective for longitudinal bedside monitoring in clinical trials, pediatric populations, or studies requiring more natural settings, such as assessing a cognitive therapy's efficacy in a real-world context [17] [18].
- EEG: The most cost-effective solution for studies where high temporal resolution is the primary requirement or for large-scale screening. It is ideal for tracking rapid neural dynamics in response to a drug or stimulus, monitoring sleep stages, or developing BCIs [16].
- Multimodal EEG-fNIRS: While requiring a higher initial investment than either modality alone, this combination can provide superior overall value. By providing concurrent electrical and hemodynamic data, it can improve the accuracy of cognitive state decoding in BCIs [19] [22] and offer a more comprehensive biomarker for therapeutic response, potentially reducing the required sample size or study duration—a key consideration in drug development.
The choice between fMRI, fNIRS, and EEG is not a search for a superior technology but a strategic decision to match the tool to the research question. fMRI remains the gold standard for spatial mapping of the entire brain. EEG is unparalleled for capturing the brain's electrical dynamics at high speeds. fNIRS occupies a critical middle ground, offering a portable and tolerant method for mapping cortical hemodynamics in increasingly naturalistic contexts.
For researchers and drug developers, the portability and ecological validity spectrum directly impacts data quality, participant diversity, and the real-world relevance of findings. By understanding the technical capabilities, experimental requirements, and cost-benefit trade-offs of each modality, scientists can make informed decisions that optimize their research outcomes and advance our understanding of the brain in health and disease.
For researchers, scientists, and drug development professionals, selecting an appropriate neuroimaging modality is a critical decision that balances scientific requirements with financial constraints. This guide provides a direct cost analysis and performance comparison of three prominent non-invasive functional brain imaging technologies: functional Magnetic Resonance Imaging (fMRI), Electroencephalography (EEG), and functional Near-Infrared Spectroscopy (fNIRS). Understanding the total cost of ownership—encompassing acquisition, operation, and maintenance—is essential for effective resource allocation and conducting cost-effective research, particularly within the framework of a broader thesis on economic efficiency in neuroscientific investigation. This analysis objectively compares the technologies based on both cost and performance metrics, supported by experimental data and detailed methodologies from cited studies.
The following table summarizes the fundamental technical characteristics of fMRI, EEG, and fNIRS, which form the basis for both their performance and cost profiles.
Table 1: Fundamental Technical Comparison of fMRI, EEG, and fNIRS [11] [23] [24]
| Feature | fMRI | EEG | fNIRS |
|---|---|---|---|
| What It Measures | Blood-Oxygen-Level-Dependent (BOLD) response | Electrical potentials from synchronized neuronal firing | Changes in oxygenated (HbO) and deoxygenated hemoglobin (HbR) |
| Signal Source | Hemodynamic response (indirect) | Post-synaptic potentials (direct) | Hemodynamic response (indirect) |
| Temporal Resolution | Low (seconds) | High (milliseconds) | Low (seconds) |
| Spatial Resolution | High (millimeters) | Low (centimeters) | Moderate (centimeters) |
| Depth of Measurement | Whole brain | Cortical surface | Outer cortex (~1-2.5 cm) |
| Portability | Low (stationary) | High | High |
| Tolerance to Movement | Low | High (but susceptible to artifacts) | Moderate to High |
fMRI is widely regarded as a gold standard for in-vivo brain imaging due to its high spatial resolution, providing detailed anatomical and functional localization [24]. However, it measures neural activity indirectly through the hemodynamic response, which unfolds over seconds, resulting in poor temporal resolution. Its operation is constrained by a demanding physical environment.
EEG measures the brain's electrical activity directly, offering millisecond-level temporal resolution ideal for studying fast cognitive processes, event-related potentials, and brain oscillations [23]. Its main limitation is low spatial resolution due to the blurring of electrical signals as they pass through the skull and scalp.
fNIRS, like fMRI, measures the hemodynamic response through changes in blood oxygenation, offering a similar temporal resolution but with superior portability [24]. It strikes a balance, providing better spatial resolution than EEG and greater tolerance to movement than fMRI, though it is limited to measuring cortical brain regions.
Direct Cost Analysis
A comprehensive cost analysis must look beyond the initial purchase price to include operational and lifetime expenses. The following table provides a structured breakdown.
Table 2: Direct Cost Analysis of Neuroimaging Hardware
| Cost Component | fMRI | EEG | fNIRS |
|---|---|---|---|
| Acquisition / Hardware Cost | Very High ($1,000,000+) | Low to Moderate | Moderate to High [25] |
| Operational Cost (per scan/session) | High (~$1,000+ per scan [11]) | Low | Low to Moderate [24] |
| Maintenance & Service Contracts | Very High (specialized engineers, cryogens) | Low | Moderate |
| Facility & Infrastructure Requirements | Very High (shielded room, cryogen supply) | Low | Low |
| Consumables & Accessories | Low | Moderate (electrodes, gels) | Low (optodes, adhesives) |
| Personnel & Training | High (specialized technicians) | Moderate | Moderate |
| Total Cost of Ownership | Very High | Low | Moderate |
fMRI carries the highest total cost of ownership. Acquisition costs for scanners run into millions of dollars. Operational costs are similarly high, with a single scan estimated to cost over $1,000 [11]. Maintenance requires expensive annual service contracts, a continuous supply of liquid helium for cooling, and dedicated, highly trained personnel. Furthermore, installing an fMRI scanner necessitates significant infrastructure, including a magnetically shielded room, adding to the capital outlay.
EEG is the most cost-effective technology. Hardware costs are generally lower, and the systems are highly portable, requiring no dedicated facility. Operational costs are minimal, primarily involving consumables like electrode gels and replacement caps. While setup requires training, the expertise is more common and less specialized than for fMRI.
fNIRS occupies a middle ground. The acquisition cost of fNIRS systems is generally higher than that of research-grade EEG systems but remains substantially lower than fMRI [24]. Operational costs are low, as the systems are portable and do not require expensive facilities or supplies. This makes fNIRS particularly affordable for studies involving multiple measurements or large sample sizes [24]. Maintenance and personnel training requirements are more intensive than for EEG but less so than for fMRI.
Experimental Protocols and Methodologies
To illustrate the application of these modalities, particularly the emerging trend of multimodal integration, this section details a protocol for combined EEG-fNIRS in a neurofeedback context.
Detailed Protocol: Multimodal EEG-fNIRS Neurofeedback for Motor Imagery
This protocol is adapted from a study investigating the effects of multimodal EEG-fNIRS neurofeedback (NF) during motor imagery (MI), a task relevant for motor rehabilitation research [19] [26].
Objective: To assess the benefits of combining EEG and fNIRS for NF in the context of upper-limb MI by comparing unimodal (EEG-only, fNIRS-only) and multimodal (EEG-fNIRS) NF conditions [19].
Experimental Platform: The setup involves a custom platform featuring:
- Integrated Cap: A single cap (e.g., EasyCap) with co-located EEG electrodes and fNIRS optodes positioned over the sensorimotor cortices according to the 10-10 international system [19].
- Hardware: A 32-channel EEG system (e.g., ActiCHamp, Brain Products) and a continuous-wave fNIRS system (e.g., NIRScout XP, NIRx) [19].
- Software: Custom software for real-time signal processing, NF score calculation, and visual feedback presentation [19].
Methodology:
- Participant Preparation: Thirty participants undergo three NF conditions in a randomized order: EEG-only, fNIRS-only, and EEG-fNIRS. The integrated cap is fitted, and the quality of both EEG and fNIRS signals is checked.
- Task Paradigm (Motor Imagery): Participants are instructed to perform kinesthetic motor imagery of left-hand movements (e.g., squeezing a ball) without executing the movement. The task follows a block design (e.g., 20s rest, 15s MI, repeated).
- Real-Time Signal Processing:
- EEG: The key feature is the event-related desynchronization (ERD) in the sensorimotor rhythm (e.g., mu rhythm, 8-13 Hz) over the right primary motor cortex (C3/C4 montage) [19].
- fNIRS: The key feature is the increase in oxygenated hemoglobin (HbO) concentration in the right primary motor cortex.
- Neurofeedback Calculation: An NF score is computed in real-time from the relevant features:
- Unimodal Conditions: The score is based solely on the ERD (EEG) or HbO (fNIRS) amplitude.
- Multimodal Condition: The score is a combined metric derived from both EEG and fNIRS signals.
- Visual Feedback: Participants are presented with a visual representation, such as a ball on a one-dimensional gauge that moves upward in response to increases in their NF score, providing real-time feedback on their brain activity during the MI task [19].
- Data Analysis: The primary analysis involves comparing the NF scores and the amplitude of the brain signals (EEG ERD, fNIRS HbO) across the three conditions to determine if multimodal NF leads to more specific and robust sensorimotor cortex activation.
The workflow of this multimodal experiment is summarized in the following diagram:
Multimodal EEG-fNIRS Neurofeedback Workflow
The Scientist's Toolkit: Key Research Reagent Solutions
For researchers looking to implement similar neuroimaging studies, particularly in multimodal contexts, the following table details essential materials and their functions.
Table 3: Essential Materials for a Multimodal EEG-fNIRS Neurofeedback Study
| Item | Function / Description | Relevance to Protocol |
|---|---|---|
| Integrated EEG-fNIRS Cap | A head cap with pre-defined openings and holders to integrate EEG electrodes and fNIRS optodes without interference. | Critical for simultaneous data acquisition from the same scalp regions. Based on the 10-10 system for standardized placement [19] [23]. |
| EEG Recording System | A system to amplify and digitize electrical signals from the scalp. Includes amplifiers and active/passive electrodes. | Measures direct neural electrical activity (ERD) from the sensorimotor cortex [19] [26]. |
| fNIRS Recording System | A system with laser or LED sources and detectors to measure near-infrared light attenuation through tissue. | Measures the hemodynamic response (HbO) in the sensorimotor cortex, complementing the EEG signal [19] [26]. |
| Electrode Gel & Abrasion Kit | Conductive gel and skin preparation tools to ensure low impedance between the scalp and EEG electrodes. | Essential for obtaining high-quality, low-noise EEG signals. |
| Synchronization Hardware/Software | A shared clock system or hardware triggers (e.g., TTL pulses) to temporally align EEG and fNIRS data streams. | Crucial for multimodal integration, ensuring the electrical and hemodynamic signals can be correlated accurately [23]. |
| Real-Time Processing Software | Custom software (e.g., from a Git repository) for online signal processing, feature extraction, and feedback generation. | Calculates the NF score from one or both modalities and controls the visual feedback presented to the participant [19]. |
| Visual Feedback Display | A screen to present the neurofeedback metaphor (e.g., a moving ball or gauge) to the participant in real-time. | Provides the closed-loop necessary for neurofeedback, allowing participants to self-regulate brain activity [19] [26]. |
The choice between fMRI, EEG, and fNIRS involves a direct trade-off between financial investment and technical capability. fMRI offers unparalleled spatial resolution for whole-brain imaging but at a very high total cost of ownership, limiting its availability and the scale of studies. EEG provides the highest temporal resolution at the lowest cost, making it ideal for studying rapid neural dynamics and large-scale trials, albeit with significant limitations in spatial localization. fNIRS emerges as a balanced and cost-effective compromise, providing localized hemodynamic monitoring with the portability necessary for ecologically valid research and clinical applications, particularly with populations and in settings where fMRI is impractical.
For a comprehensive understanding of brain function, the future lies in multimodal integration. As demonstrated in the experimental protocol, combining EEG and fNIRS leverages their complementary strengths—direct electrical measurement with high temporal resolution and localized hemodynamic information with good spatial specificity—while mitigating their individual weaknesses. This approach, though requiring initial investment in hardware integration and data fusion techniques, provides a richer, more complete picture of brain activity, ultimately offering greater scientific value and potentially a more favorable cost-benefit ratio for advanced neuroscience and clinical research.
In the competitive landscape of neuroscience and drug development research, direct equipment costs often dominate budgeting discussions. However, three critical indirect cost components—subject throughput, staff training requirements, and facility infrastructure—significantly impact the overall cost-effectiveness and operational efficiency of neuroimaging research programs. These factors determine not only initial setup expenses but also long-term operational viability, directly influencing a laboratory's capacity to generate publishable data and meet research milestones.
Functional magnetic resonance imaging (fMRI), functional near-infrared spectroscopy (fNIRS), and electroencephalography (EEG) represent a spectrum of neuroimaging technologies with divergent operational characteristics and associated indirect costs. While fMRI provides unparalleled spatial resolution for deep brain structures, its requirements for specialized infrastructure and limited subject throughput create substantial indirect cost implications [27]. Conversely, EEG and fNIRS offer portability and lower operational barriers but present different trade-offs in data quality and analytical complexity [28] [29]. This analysis objectively compares these technologies through the lens of indirect cost considerations to inform strategic research investment decisions.
The fundamental operational principles of fMRI, fNIRS, and EEG dictate their respective infrastructure needs and operational workflows. fMRI measures brain activity indirectly through blood oxygenation level-dependent (BOLD) signals, requiring high-field magnetic environments, electromagnetic shielding, and specialized facilities [27]. fNIRS employs near-infrared light (650-950 nm) to measure cortical hemodynamic responses through changes in oxygenated (HbO) and deoxygenated hemoglobin (HbR) concentrations [27] [29]. EEG records electrical activity from synchronized neuronal firing via electrodes placed on the scalp, capturing millisecond-level neural dynamics [28] [29].
Table 1: Fundamental Characteristics of Neuroimaging Modalities
| Feature | fMRI | fNIRS | EEG |
|---|---|---|---|
| Primary Signal | Hemodynamic (BOLD) | Hemodynamic (HbO/HbR) | Electrical activity |
| Spatial Resolution | High (millimeter-level) | Moderate (1-3 cm) | Low (centimeter-level) |
| Temporal Resolution | Low (0.33-2 Hz) | Moderate (seconds) | High (milliseconds) |
| Depth Penetration | Whole brain (cortical & subcortical) | Superficial cortex (1-2.5 cm) | Cortical surface |
| Portability | None (fixed installation) | High (wearable systems) | High (wearable systems) |
These technical differences directly influence indirect cost considerations. fMRI's superior spatial resolution comes at the expense of stringent environmental requirements and limited experimental flexibility [27]. fNIRS balances spatial and temporal resolution with significantly better portability and tolerance for movement [28]. EEG excels at capturing rapid neural dynamics but provides limited spatial localization, affecting the types of research questions it can effectively address [29].
Subject Throughput: Operational Efficiency Compared
Subject throughput—the number of participants that can be successfully imaged within a given timeframe—directly impacts research pace and data collection costs. Throughput is determined by multiple factors including setup time, data acquisition duration, participant comfort, and procedural constraints.
Table 2: Subject Throughput Comparison
| Throughput Factor | fMRI | fNIRS | EEG |
|---|---|---|---|
| Setup Time | 15-30 minutes | 10-20 minutes | 20-45 minutes (with gel) |
| Typical Session Duration | 60-90 minutes | 30-60 minutes | 30-60 minutes |
| Motion Constraints | Severe (complete immobilization required) | Moderate (tolerant of minor movement) | Moderate to high (sensitive to movement artifacts) |
| Participant Screening | Extensive (metal implants, claustrophobia, weight) | Minimal (mostly hair color/ density) | Minimal |
| Daily Capacity | 4-6 participants | 8-12 participants | 6-10 participants |
fMRI throughput is severely constrained by its operational requirements. The need for complete immobilization, loud acoustic environment, and claustrophobic conditions limits participant populations and increases no-show rates and data exclusion due to motion artifacts [27]. The extensive screening process for metal implants and other contraindications further reduces effective throughput by excluding significant portions of potential participant pools.
fNIRS demonstrates superior throughput characteristics due to its tolerance for movement and minimal participant screening requirements. The technology's applicability across diverse populations—including infants, elderly patients, and those with mobility impairments—enhances recruitment efficiency [27] [29]. Setup time is moderate, with newer systems featuring quick-application caps further reducing preparation requirements.
EEG presents a mixed throughput profile. While acquisition sessions are typically shorter, setup time is often prolonged due to the need for conductive gel application and impedance checking [28] [29]. Participant movement constraints are more significant than fNIRS but less restrictive than fMRI. Dry electrode systems have improved EEG setup efficiency but may compromise signal quality in some applications.
Staff Training and Expertise Requirements
The specialized knowledge required to operate neuroimaging equipment and process resulting data constitutes a significant indirect cost through staffing requirements, training time, and expertise acquisition.
fMRI Staffing Complexity
fMRI operation demands highly specialized personnel including MRI technologists (often requiring certification), physics support for pulse sequence optimization, and safety officers to manage the controlled access environment [27]. Data analysis requires expertise in complex preprocessing pipelines including slice-time correction, motion realignment, and statistical parametric mapping. These specialized skills command higher salary levels and extend training timelines for new researchers.
fNIRS Operational Accessibility
fNIRS systems require moderate specialization with training focused on proper optode placement, signal quality assessment, and understanding of light-tissue interaction principles [29]. Analysis techniques build on general linear modeling approaches familiar to fMRI researchers, reducing the learning curve. The technology's visual feedback systems enable rapid troubleshooting by technical staff.
EEG Technical Requirements
EEG operation demands understanding of electrode impedance management, montage selection, and artifact identification [28] [29]. While basic setup can be learned relatively quickly, advanced analysis techniques including time-frequency decomposition and source localization require substantial expertise. The proliferation of consumer-grade EEG systems has lowered the barrier to entry but may create data quality issues without proper training [29].
Table 3: Staff Training and Expertise Requirements
| Competency Area | fMRI | fNIRS | EEG |
|---|---|---|---|
| Technical Operation | Advanced (certification often required) | Intermediate | Intermediate |
| Experimental Setup | Complex (limited access, participant safety) | Moderate (optode placement) | Moderate to complex (electrode placement) |
| Data Processing | Advanced (specialized software, preprocessing pipelines) | Intermediate (similar to fMRI but simpler) | Intermediate to advanced (depending on analysis method) |
| Troubleshooting | Requires physics/engineering support | Straightforward (visual feedback available) | Complex (artifact source identification) |
| Typical Training Timeline | 6-12 months for full competency | 1-3 months for operational proficiency | 2-4 months for basic competence |
Facility Requirements and Infrastructure Costs
The physical infrastructure required to support neuroimaging operations represents one of the most substantial indirect cost considerations, encompassing both initial construction and ongoing maintenance expenses.
fMRI Facility Demands
fMRI facilities require significant infrastructure investments including magnetic shielding, structural reinforcement for high-field systems, specialized cooling systems, and RF shielding throughout the scanning suite [27]. These requirements necessitate dedicated space with controlled access, emergency safety systems, and significant power requirements. Ongoing costs include cryogen replenishment (for superconducting magnets), high energy consumption, and specialized maintenance contracts often exceeding 10% of system capital cost annually.
fNIRS Facility Adaptability
fNIRS systems require minimal dedicated infrastructure, operating effectively in standard laboratory or clinical environments [27] [29]. Their portability enables use across multiple locations—research labs, patient rooms, naturalistic settings—maximizing utilization rates. No specialized power, cooling, or shielding is required, significantly reducing indirect facility costs.
EEG Facility Flexibility
EEG systems share fNIRS's advantages of minimal infrastructure requirements, though they may benefit from electrically shielded rooms for high-quality data acquisition in environments with significant electromagnetic interference [28]. Most research applications can proceed in standard lab spaces with basic power requirements.
Diagram: The substantial facility requirements for fMRI compared to the minimal infrastructure needed for fNIRS and EEG create significant differences in indirect costs.
Experimental Protocols and Data Quality Considerations
The methodological approaches for validating and comparing neuroimaging technologies reveal critical performance characteristics that indirectly impact research costs through data quality, completion rates, and analytical efficiency.
Protocol 1: Hemodynamic Response Validation
Objective: To compare the hemodynamic response measurement capabilities of fMRI and fNIRS during controlled motor tasks [27]. Methodology: Simultaneous fMRI-fNIRS acquisition during finger-tapping paradigm with block design (30s rest, 30s activation). fMRI parameters: 3T scanner, TE/TR=30/2000ms, voxel size=3×3×3mm³. fNIRS parameters: 16 sources, 16 detectors covering motor cortex, sampling rate=10Hz. Key Findings: Strong correlation (r=0.78-0.85) between fMRI BOLD signals and fNIRS HbO concentrations in primary motor cortex. fNIRS demonstrated superior tolerance for movement artifacts while fMRI provided comprehensive whole-brain activation maps including subcortical structures [27].
Protocol 2: Temporal Resolution Assessment
Objective: To evaluate temporal precision of EEG versus fNIRS for capturing rapid neural dynamics during cognitive tasks [28] [29]. Methodology: Simultaneous EEG-fNIRS recording during auditory oddball paradigm. EEG: 64-channel system, 1000Hz sampling. fNIRS: 8-channel prefrontal coverage, 10Hz sampling. Key Findings: EEG accurately captured millisecond-scale event-related potentials (N100, P300 components) while fNIRS hemodynamic responses lagged by 4-6 seconds. fNIRS provided better spatial localization of prefrontal cortex engagement during working memory components [29].
Protocol 3: Naturalistic Environment Testing
Objective: To assess data quality during naturalistic movements simulating real-world applications [28]. Methodology: Sequential testing of fMRI (restricted movement), fNIRS, and EEG during simulated driving task with increasing movement complexity. Key Findings: fMRI data severely compromised by movement artifacts beyond minimal head motion. fNIRS maintained signal quality during moderate movements. EEG required extensive artifact correction algorithms with significant data loss during vigorous movement [28].
Integrated Cost-Benefit Analysis
When evaluating the total cost of ownership for neuroimaging technologies, indirect costs must be balanced against scientific requirements and data quality needs. The following integrated analysis synthesizes key considerations across the three modalities.
Table 4: Comprehensive Indirect Cost Comparison
| Cost Factor | fMRI | fNIRS | EEG |
|---|---|---|---|
| Facility Investment | Very High ($500K-$1M+) | Low (<$10K) | Low to Moderate (<$50K) |
| Subject Throughput | Low (4-6/day) | High (8-12/day) | Moderate (6-10/day) |
| Staff Expertise Level | Advanced (multiple specialists) | Intermediate | Intermediate |
| Training Timeline | Extended (6-12 months) | Moderate (1-3 months) | Moderate (2-4 months) |
| Data Quality Trade-offs | Excellent spatial resolution, limited ecological validity | Good surface coverage, moderate resolution | Excellent temporal resolution, poor spatial resolution |
| Participant Population Limitations | Severe (excludes many clinical populations) | Minimal | Minimal |
| Maintenance Costs | Very High (specialized service contracts) | Low (routine calibration) | Low to Moderate |
Diagram: Decision pathway for neuroimaging technology selection based on research requirements and indirect cost considerations.
Essential Research Reagent Solutions
Successful implementation of neuroimaging technologies requires specific materials and software solutions that contribute to indirect costs through ongoing consumable expenses and licensing fees.
Table 5: Essential Research Materials and Solutions
| Item Category | Specific Examples | Function | Approximate Cost |
|---|---|---|---|
| fMRI Consumables | MR-compatible response devices, audiovisual interfaces, physiological monitoring equipment | Enable experimental paradigms and participant monitoring during scanning | $10,000-$50,000 |
| fNIRS Components | Custom optode caps, light source assemblies, calibration phantoms | Ensure proper light transmission and measurement reliability | $2,000-$10,000 |
| EEG Supplies | Conductive gel/paste, electrode nets/caps, abrasive preparations, replacement electrodes | Maintain signal quality and electrode-scalp interface | $1,000-$5,000 annually |
| Data Processing Software | SPM, FSL, AFNI (fMRI); Homer2, NIRS-KIT (fNIRS); EEGLAB, FieldTrip (EEG) | Data preprocessing, analysis, and visualization | $0-$10,000 (varies by licensing) |
| Quality Assurance Tools | Head phantoms, signal test equipment, motion tracking systems | Regular system validation and performance monitoring | $5,000-$20,000 |
Indirect cost considerations significantly impact the total cost of ownership and operational efficiency of neuroimaging technologies. fMRI, while providing unparalleled spatial resolution, incurs substantial indirect costs through facility requirements, limited subject throughput, and specialized staffing needs. fNIRS offers a favorable indirect cost profile with minimal infrastructure requirements, higher participant throughput, and moderate training demands while maintaining good spatial resolution for cortical studies. EEG provides exceptional temporal resolution with relatively low operational barriers, though data quality can be compromised in mobile applications.
Strategic selection should balance scientific requirements with resource constraints, considering that multimodal approaches (particularly fNIRS-EEG integration) are increasingly feasible and can provide complementary data streams while managing indirect costs [5]. Research programs should carefully evaluate their specific participant populations, experimental paradigms, and analytical requirements against the indirect cost profiles presented here to optimize their neuroimaging investments.
Matching Modality to Mission: Application-Specific Workflows and Use Cases
For researchers in neuroscience and drug development, selecting the optimal brain imaging technology involves balancing spatial resolution, temporal resolution, cost, and practical applicability. This guide provides a detailed, evidence-based comparison of functional Magnetic Resonance Imaging (fMRI), functional Near-Infrared Spectroscopy (fNIRS), and Electroencephalography (EEG), with a specific focus on high-precision spatial mapping of deep brain structures and networks.
Neuroimaging Modalities at a Glance
The table below summarizes the core technical specifications and practical considerations for each modality, highlighting their distinct trade-offs.
Table 1: Comparative Overview of fMRI, fNIRS, and EEG for Brain Mapping
| Feature | fMRI | fNIRS | EEG |
|---|---|---|---|
| Spatial Resolution | High (millimeter-level) [7] [30] | Low (1-3 cm), superficial cortex only [7] | Very Low (centimeter-level) [7] |
| Temporal Resolution | Low (0.5-2 Hz, hemodynamic lag) [7] | Moderate (up to 10 Hz) [8] | Very High (millisecond-level) [7] [19] |
| Depth Penetration | Whole brain, including deep structures (e.g., thalamus, hippocampus) [7] | Superficial cortex (up to 2-3 cm) [7] | Superficial cortex, excellent temporal detail [19] |
| Portability & Cost | Low (immobile, high cost) [7] [19] | High (portable, lower cost) [7] [19] | High (portable, low cost) [19] |
| Tolerance to Motion | Low (highly sensitive) [7] | High (relatively robust) [7] | Moderate (sensitive to artifacts) |
| Key Strength for Mapping | Precision mapping of individual-specific deep brain networks [31] [32] | Ecological validity, long-term bedside monitoring [7] [33] | Capturing rapid neural dynamics and oscillations [19] |
Spatial Mapping Capabilities and Key Applications
The choice of modality directly determines the scope and precision of spatial brain analysis.
fMRI: The Gold Standard for Deep Brain Mapping
Functional MRI excels at revealing the intricate organization of brain networks, including subcortical regions, within individual subjects, a process known as precision functional mapping [31] [32]. A key finding is that an individual's unique, idiosyncratic network architecture remains stable and can be reliably mapped not only during rest but also using data collected from various task states [31] [32]. Furthermore, methodological advances are continuously enhancing its power. A novel deep learning approach for adaptive spatial smoothing of task fMRI data has been developed to improve the detection of active regions while preserving spatial specificity, which is critical for clinical applications like presurgical planning [34].
fNIRS: A Complementary Tool for Cortical Mapping
fNIRS finds its niche in applications where fMRI's limitations are prohibitive. Its portability and motion tolerance make it ideal for studying brain function in naturalistic settings, social interactions, and for bedside monitoring of clinical populations [7] [33]. For instance, resting-state fNIRS can differentiate between patients in a minimally conscious state (MCS) and those in an unresponsive wakefulness syndrome (VS/UWS) by detecting differences in prefrontal and frontoparietal network connectivity, offering a valuable diagnostic tool [33]. However, its utility is constrained to the cortical surface and provides coarser spatial detail compared to fMRI [7].
The Multimodal Integration Approach
No single modality captures the full picture. Consequently, a powerful trend is the integration of complementary techniques to achieve a more holistic view of brain activity. For example, simultaneous EEG-fNIRS recording is being explored for motor imagery-based neurofeedback, potentially offering more specific biomarkers for post-stroke motor rehabilitation by combining electrical and hemodynamic information [19]. Meanwhile, sophisticated encoding models that fuse fMRI and MEG data are being developed to estimate brain activity with both high spatial and temporal resolution, overcoming the inherent trade-offs of each individual method [30].
Experimental Protocols for Network Analysis
The following are standardized methodologies for mapping brain networks with each modality.
Protocol 1: Precision Functional Connectivity with fMRI
This protocol is used to estimate individual-specific brain networks from fMRI data [31] [35] [32].
- Data Acquisition: Acquire BOLD fMRI data during a resting state (e.g., eyes open, fixation) or during passive/active task paradigms. A minimum of 27 minutes of data (e.g., 4 runs) is recommended for stable within-individual estimates [32].
- Preprocessing: Standard preprocessing pipelines include slice-timing correction, motion realignment, and normalization to a standard space. Spatial smoothing with a 2-4 mm kernel is typically applied to improve signal-to-noise ratio while preserving spatial specificity [34] [32].
- Network Estimation: Extract time series from predefined brain regions or a whole-brain atlas. Calculate a functional connectivity matrix using pairwise statistics. While Pearson's correlation is common, benchmarking studies show that measures like precision (inverse covariance) can optimize structure-function coupling and individual fingerprinting [35].
- Validation: Estimated networks can be validated by their ability to predict held-out functional data or to dissociate adjacent functional regions (e.g., triple dissociations within association cortex) in independent task data [31].
Protocol 2: Resting-State Network Analysis with fNIRS
This protocol is adapted for assessing cortical network integrity in clinical populations at the bedside [33].
- Data Acquisition: Perform a 5-minute resting-state recording using a multi-channel fNIRS system covering regions of interest (e.g., prefrontal, motor, parietal). Ensure a quiet environment with minimal external stimulation.
- Preprocessing: Convert raw light intensity to oxygenated (HbO) and deoxygenated (HbR) hemoglobin concentrations. Apply trimming of initial data, band-pass filtering (e.g., 0.02-0.1 Hz) to remove physiological noise, and correction for motion artifacts using algorithms like PCA or wavelet-based methods [8] [33].
- Network Analysis: Compute functional connectivity between all channel pairs using Pearson correlation for HbO signals. HbO is generally more reproducible and sensitive for detecting task-related and resting-state changes [36] [33]. Connectivity matrices can be compared between patient groups and healthy controls.
- Statistical & Classification Analysis: Use group-level statistics (e.g., t-tests) to identify connections with significantly altered connectivity. Employ machine learning (e.g., Support Vector Machines) to evaluate the classification performance of specific connectivity features for differentiating clinical groups [33].
Visualizing Multimodal Integration for High-Resolution Mapping
The following diagram illustrates a computational framework that integrates fMRI and MEG to achieve high spatiotemporal resolution, representing the cutting edge of multimodal neuroimaging.
Diagram 1: A multimodal encoding model for high-resolution source estimation.
Essential Research Reagents and Tools
The table below lists key analytical tools and computational methods essential for advanced brain network mapping.
Table 2: Key Analytical Tools for Brain Network Mapping
| Tool / Method | Function | Relevant Modality |
|---|---|---|
| Adaptive Spatial Smoothing DNN | A deep learning model that improves detection of subject-level task fMRI activity with high spatial specificity [34]. | fMRI |
| Precision/Inverse Covariance | A pairwise statistic for functional connectivity that optimizes structure-function coupling and individual fingerprinting [35]. | fMRI |
| Graph Signal Processing (GSP) | A mathematical framework for analyzing the relationship between structural connectivity and functional signals (EEG/fNIRS) on brain graphs [8]. | fNIRS, EEG |
| Transformer-Based Encoding Model | A framework that integrates MEG and fMRI data from naturalistic experiments to estimate latent cortical source activity with high resolution [30]. | Multimodal (MEG-fMRI) |
| Structure-Decoupling Index (SDI) | Quantifies the degree of (dis)alignment between structural and functional networks for each brain region [8]. | fNIRS, EEG |
The quest for high-precision spatial mapping of deep brain structures and networks does not have a one-size-fits-all solution. fMRI remains the undisputed leader for mapping the detailed, individual-specific architecture of whole-brain networks, including critical subcortical structures. fNIRS offers a cost-effective, portable alternative for cortical mapping in real-world and clinical settings, while EEG provides unparalleled insight into rapid neural dynamics. The future of neuroimaging lies not in the supremacy of a single tool, but in the strategic combination of these modalities, leveraging computational models to integrate their complementary strengths and achieve a unified, high-resolution understanding of brain function in health and disease.
In the pursuit of understanding the human brain, researchers and clinicians are perpetually balancing the need for comprehensive data against practical constraints like cost, portability, and participant comfort. Functional Magnetic Resonance Imaging (fMRI), functional Near-Infrared Spectroscopy (fNIRS), and Electroencephalography (EEG) have emerged as cornerstone neuroimaging techniques, each with a distinct profile of strengths and limitations. Framed within a cost-effectiveness analysis, this guide objectively compares these modalities, with a particular focus on the synergistic potential of integrating fNIRS and EEG. This hybrid approach is rapidly establishing a new paradigm for brain research in real-world and clinical settings, offering a unique combination of hemodynamic and electrophysiological data without the prohibitive cost and immobility of fMRI [7].
While fMRI provides high spatial resolution and deep brain coverage, its operational costs are substantial, it requires a restrictive environment, and it is unsuitable for mobile applications [7]. In contrast, fNIRS and EEG are more cost-effective and portable, but have traditionally been limited by lower spatial resolution (EEG) and shallower signal depth (fNIRS), respectively [37] [12]. The integration of fNIRS and EEG into a single platform directly addresses these individual limitations. It creates a multimodal system that is not only more powerful than the sum of its parts but also remains within the bounds of practical and financial feasibility for a wider range of applications, from drug development to bedside monitoring [19] [12].
Fundamental Comparison of fMRI, fNIRS, and EEG
To make an informed decision on neuroimaging tools, it is essential to understand the core technical specifications and performance metrics of each modality. The following table provides a detailed, data-driven comparison.
Table 1: Technical and Performance Comparison of Key Neuroimaging Modalities
| Feature | fMRI | fNIRS | EEG |
|---|---|---|---|
| What It Measures | Blood Oxygenation Level Dependent (BOLD) signal [7] | Concentration changes in oxygenated (HbO) and deoxygenated hemoglobin (HbR) [37] | Electrical potentials from synchronized neuronal firing [37] |
| Temporal Resolution | Low (0.33 - 2 Hz); limited by hemodynamic response (4-6 sec lag) [7] | Moderate (seconds); limited by hemodynamic response [37] | Very High (milliseconds) [37] |
| Spatial Resolution | High (millimeter-level); whole-brain coverage [7] | Moderate (1-3 cm); limited to cortical surface [7] | Low (centimeter-level); suffers from signal dispersion [37] |
| Depth of Measurement | Whole brain (cortical and subcortical) [7] | Superficial cortex (1-2.5 cm depth) [37] [7] | Cortical surface [37] |
| Portability & Motion Tolerance | Very low; requires immobility in a scanner [7] | High; robust to movement, wearable systems available [37] | Moderate; increasingly portable but sensitive to motion artifacts [37] |
| Approximate Cost & Accessibility | Very High; limited to specialized facilities [12] | Moderate; generally higher than EEG [37] | Low to Moderate; most accessible and cost-effective [37] |
| Best Use Cases | Precise spatial localization of deep brain activity; structural connectivity | Naturalistic studies, child development, clinical monitoring, sustained cognitive states [37] | Fast cognitive tasks, event-related potentials, sleep studies, brain-computer interfaces [37] |
The fNIRS-EEG Integration: A Synergistic Partnership
The combination of fNIRS and EEG is more than just using two tools at once; it is a synergistic partnership that leverages their complementary nature. fNIRS provides a better spatial localization of the hemodynamic response on the cortical surface, which can help resolve the source ambiguity inherent in EEG signals. Conversely, EEG provides millisecond-level temporal precision to the partnership, capturing neural dynamics that are entirely invisible to the slow hemodynamic response measured by fNIRS [37] [38].
This complementary relationship is powerfully illustrated in motor imagery tasks, which are crucial for neurorehabilitation. A hybrid EEG-fNIRS system has been shown to achieve higher classification accuracy (91.02%) for left vs. right hand movements compared to using EEG (85.64%) or fNIRS (85.55%) alone [38]. This performance boost demonstrates the tangible benefit of a multimodal approach for Brain-Computer Interfaces (BCIs) and neuroprosthetic applications [19] [38].
The following diagram illustrates the complementary strengths of EEG and fNIRS that form the basis for their powerful synergy in a hybrid system.
Experimental Protocols: Validating the Hybrid Approach
The theoretical advantages of EEG-fNIRS integration are validated through rigorous experimental protocols. These methodologies provide a blueprint for how the two signals are captured, processed, and fused to yield a more complete picture of brain activity.
Protocol: Motor Execution Task for Hybrid BCI Classification
This protocol is designed to maximize classification accuracy for a hybrid BCI system by leveraging early temporal features from both modalities [38].
- Objective: To perform binary classification (left vs. right hand movement) using a minimal number of channels and early temporal features to enhance system speed and accuracy.
- Participants: Healthy, right-handed subjects.
- Task Paradigm: A randomized block design. Each trial consists of 20 seconds of rest (fixation cross) followed by 5 seconds of motor execution (squeezing a rubber ball with the hand indicated by a left or right arrow) [38].
- Data Acquisition: Simultaneous recording using a 16-channel EEG system (e.g., BrainAmp) and a continuous-wave fNIRS system (e.g., NIRx) with optodes placed over the left and right motor cortices.
- Key Methodology:
- Channel Selection: A General Linear Model (GLM) is used to identify the single most informative EEG and fNIRS channel on each hemisphere.
- Early Feature Extraction:
- EEG Features: Extracted from a short time window (0-1 seconds) after task onset.
- fNIRS Features: The "initial dip" (0-2 seconds) in the hemodynamic response is captured.
- Data Fusion & Classification: The extracted early temporal features from both modalities are combined and classified using a Support Vector Machine (SVM).
- Outcome: This method achieved a lofty classification accuracy of 91.02% ± 4.08%, significantly outperforming unimodal approaches [38].
Protocol: Evaluating Multimodal Neurofeedback for Motor Imagery
This protocol, designed for a 2025 study, investigates the effects of multimodal neurofeedback (NF) in the context of upper-limb motor imagery, with direct applications in post-stroke motor rehabilitation [19].
- Objective: To assess whether a NF score based on combined EEG and fNIRS signals results more specific task-related brain activity during motor imagery than unimodal NF.
- Study Design: A randomized controlled trial where participants undergo three conditions: EEG-only NF, fNIRS-only NF, and combined EEG-fNIRS NF.
- Platform: A custom-made cap integrating EEG electrodes and fNIRS optodes over the sensorimotor cortices.
- Task & Feedback: Participants perform motor imagery tasks (e.g., imagining left-hand movement) and are presented with a real-time visual feedback (e.g., a ball moving on a gauge) that represents their calculated NF score.
- Data Fusion: The NF score is computed from activity in the contralateral primary motor cortex, derived from the respective signals for each condition (EEG power changes, fNIRS HbO/HbR changes, or a combination of both).
- Hypothesis: The combined NF approach will lead to more specific and robust activation of the sensorimotor cortices, potentially enhancing neuroplasticity for clinical recovery [19].
The Scientist's Toolkit: Essential Reagents and Materials
Implementing a successful fNIRS-EEG study requires specific hardware and software components. The following table details the essential "research reagents" for building a multimodal imaging system.
Table 2: Essential Materials for a Hybrid fNIRS-EEG Setup
| Item | Function & Importance | Examples & Specifications |
|---|---|---|
| Integrated Cap/Harness | The physical platform that holds EEG electrodes and fNIRS optodes in precise, co-registered positions on the scalp. Critical for signal quality and spatial alignment. | Custom EasyCaps with pre-defined holes; 3D-printed helmets; commercial integrated systems (e.g., DSI-EEG+fNIRS from Wearable Sensing) [19] [12] [39]. |
| EEG Amplifier | Measures minute electrical potentials from the scalp. Requires high sampling rate and synchronization capabilities. | Brain Products' LiveAmp (wireless) or ActiCHamp Plus (stationary) [40]. |
| fNIRS System | Emits near-infrared light and detects its attenuation after passing through brain tissue to calculate hemoglobin concentrations. | NIRScout systems (NIRx); Cortivision systems [19] [40]. |
| Synchronization Hardware/Software | Ensures temporal alignment of EEG and fNIRS data streams with millisecond precision. | Lab Streaming Layer (LSL) protocol; external trigger hubs (e.g., Wireless Trigger Hub); TTL pulses [37] [40]. |
| Data Processing & Fusion Algorithms | Software tools for preprocessing, analyzing, and integrating the fundamentally different EEG and fNIRS signals. | Joint Independent Component Analysis (jICA), Canonical Correlation Analysis (CCA), Machine Learning classifiers (e.g., SVM), Custom code in Python/MATLAB [37] [38]. |
The workflow for a typical multimodal experiment, from setup to data fusion, is visualized below.
The integration of fNIRS and EEG represents a significant advancement in mobile and clinical neuroimaging, offering a compelling balance of performance and cost-effectiveness. While fMRI remains the gold standard for deep brain spatial resolution, its high cost and static nature limit its application in naturalistic and longitudinal clinical settings. The fNIRS-EEG hybrid platform successfully bridges the critical gap between temporal and spatial resolution in a portable, user-friendly package [37] [12].
Future developments in this field will focus on standardizing analysis pipelines to improve reproducibility [41], refining hardware for greater comfort and higher density, and developing more sophisticated, real-time data fusion algorithms driven by machine learning. As these technologies mature, the fNIRS-EEG mobile lab is poised to become an indispensable tool for researchers and clinicians alike, unlocking new possibilities for understanding brain function in the real world and improving patient care in neurology and psychiatry [19] [12].
In motor rehabilitation, particularly for post-stroke recovery, neurofeedback (NF) enables patients to self-regulate brain activity through real-time feedback, promoting neuroplasticity [19]. Motor imagery (MI)—the mental rehearsal of movement without physical execution—activates sensorimotor brain regions similar to actual movement, making it a valuable therapeutic tool [19] [42]. Selecting the optimal neuroimaging modality for MI-based NF involves critical cost-effectiveness trade-offs between spatial resolution, temporal resolution, operational cost, and ecological validity [7] [43] [44]. While functional magnetic resonance imaging (fMRI) offers superior spatial resolution, its high cost, immobility, and operational constraints limit widespread clinical adoption [7] [43]. Electroencephalography (EEG) and functional near-infrared spectroscopy (fNIRS) present portable, cost-effective alternatives, yet each has limitations [45] [43]. This case study investigates multimodal EEG-fNIRS neurofeedback as a synergistic solution that combines the temporal strength of EEG with the spatial specificity of fNIRS, potentially offering a balanced, cost-effective approach for clinical rehabilitation settings [19] [45].
Table 1: Key Neuroimaging Modalities for Motor Imagery Neurofeedback
| Modality | Spatial Resolution | Temporal Resolution | Portability & Cost | Key Advantages | Main Limitations |
|---|---|---|---|---|---|
| fMRI | High (millimeter level) [7] | Low (0.33-2 Hz) due to hemodynamic lag [7] | Low portability, very high cost [43] | Whole-brain coverage including subcortical structures [7] | Expensive, immobile, sensitive to motion artifacts [7] |
| EEG | Low (~2 cm) [45] [6] | High (millisecond level) [45] [6] | High portability, low cost [45] [43] | Direct measurement of electrical neural activity, excellent temporal resolution [19] [45] | Susceptible to motion artifacts, limited spatial specificity [45] |
| fNIRS | Moderate (1-3 cm) [7] [43] | Moderate (~1 Hz) limited by vascular response [45] | High portability, low cost [45] [43] | Tolerates more motion, measures hemodynamic response [43] [44] | Limited to cortical regions, lower temporal resolution [7] [45] |
| EEG-fNIRS (Multimodal) | Combines moderate spatial resolution from fNIRS [45] | Combines high temporal resolution from EEG [45] | Portable and cost-effective for a multimodal setup [19] | Complementary information, improved classification accuracy [45] | Technical integration complexity, requires synchronization [19] |
Experimental Protocol: Investigating Multimodal NF for Upper-Limb Motor Imagery
Study Design and NF Platform
A 2025 study designed a fully operational experimental platform to assess multimodal EEG-fNIRS NF for left-hand motor imagery [19] [26]. The study protocol involves thirty right-handed participants undergoing three randomized NF conditions: EEG-only, fNIRS-only, and combined EEG-fNIRS [19]. Sensors are positioned over the sensorimotor cortices, and participants receive visual feedback via a ball moving along a one-dimensional gauge, controlled by their brain activity levels during MI tasks [19]. The platform integrates a custom cap with EEG electrodes and fNIRS optodes, coupled with software for real-time signal processing and NF score calculation [19] [26]. This design enables direct comparison of unimodal versus multimodal NF efficacy [19].
Signal Acquisition and Processing
The integrated system uses a 32-channel EEG system (ActiCHamp, Brain Products GmbH) and a continuous-wave fNIRS system (NIRScout XP, NIRx) with 16 detectors, 16 LED sources, and 8 short channels [19]. EEG measures event-related desynchronization (ERD) in mu (8-13 Hz) and beta (14-30 Hz) frequency bands, indicating sensorimotor cortex activation [42]. fNIRS measures concentration changes in oxygenated hemoglobin (HbO) and deoxygenated hemoglobin (HbR) in the primary motor cortex [19] [42]. A dedicated application processes these signals in real-time to compute a unified NF score [19]. The source code is publicly available, promoting reproducibility [19].
Diagram 1: EEG-fNIRS Neurofeedback Workflow. The process begins with simultaneous data acquisition, progresses through real-time signal processing and feature extraction, and culminates in visual feedback that enables participant self-regulation.
Comparative Efficacy: Multimodal Versus Unimodal Approaches
Performance and Classification Accuracy
Multimodal EEG-fNIRS systems demonstrate 5%-10% improvement in classification accuracy for distinguishing left-hand versus right-hand MI compared to unimodal systems [46]. This enhanced accuracy stems from complementary information: EEG captures rapid neuronal oscillations, while fNIRS tracks slower hemodynamic changes associated with cortical reorganization [46]. One review notes that combining peak and mean fNIRS signals with the highest band powers of EEG signals is particularly promising for improving system accuracy in brain-computer interfaces (BCIs) [19].
Age-Dependent Responses and Clinical applicability
Simultaneous EEG-fNIRS recordings reveal that age significantly influences neural correlates of MI [42]. During MI, older adults show less lateralized ERD and HbR concentration in sensorimotor cortices compared to younger adults [42]. This reduced asymmetry in older adults—the primary stroke demographic—highlights the importance of tailoring NF protocols to the end-user's age [42]. Furthermore, evidence suggests that individuals who struggle with EEG-based NF ("BCI illiterates") may perform better with fNIRS-based NF, indicating that multimodal approaches could accommodate a broader patient population [42].
Table 2: Quantitative Performance Comparison of Neurofeedback Modalities
| Performance Metric | EEG-only NF | fNIRS-only NF | EEG-fNIRS Multimodal NF |
|---|---|---|---|
| Temporal Resolution | Millisecond precision [45] [6] | ~1 second due to vascular response [45] | Millisecond precision from EEG component [45] |
| Spatial Specificity | Low, limited by skull conductivity [45] | Moderate (5-10 mm resolution in sensorimotor cortex) [46] | Enhanced through fNIRS spatial localization [46] |
| Motion Artifact Tolerance | Low susceptibility [45] | Higher tolerance [43] [44] | Balanced approach [43] |
| MI Classification Accuracy | Moderate | Moderate | 5%-10% improvement over unimodal systems [46] |
| Modulation of Brain Activity | Increased task-specific activity with NF [42] | Increased lateralized HbO concentration over sessions [42] | Potentially more specific task-related brain activity [19] |
The Scientist's Toolkit: Essential Research Reagents and Materials
Table 3: Essential Materials for EEG-fNIRS Motor Imagery Research
| Item | Specification/Example | Function/Purpose |
|---|---|---|
| EEG System | 32-channel ActiCHamp (Brain Products GmbH) [19] | Records electrical brain activity with high temporal resolution |
| fNIRS System | NIRScout XP (NIRx) with 16 detectors, 16 sources [19] | Measures hemodynamic responses in cortical regions |
| Integrated Cap | Custom EasyCap with EEG electrodes & fNIRS optodes [19] [46] | Enables simultaneous multimodal data acquisition |
| Stimulus Presentation Software | E-Prime 3.0 [46] | Presents visual cues and triggers synchronized data recording |
| Signal Processing Platform | Custom software for real-time analysis [19] | Computes NF score from combined EEG and fNIRS features |
| Calibration Tools | Dynamometer, stress ball [46] | Enhances motor imagery vividness through tactile reinforcement |
| Clinical Assessment Scales | Fugl-Meyer Assessment for Upper Extremities (FMA-UE) [46] | Quantifies motor function recovery in clinical populations |
Multimodal EEG-fNIRS neurofeedback represents a promising, cost-effective solution for motor imagery-based rehabilitation, balancing the trade-offs between spatial and temporal resolution while maintaining practical clinical applicability [19] [45]. The synergistic combination of electrical and hemodynamic activity monitoring enhances brain activity classification and provides more comprehensive biofeedback [45] [46]. This approach addresses a critical need in neurorehabilitation—particularly for post-stroke patients—by offering a portable, accessible alternative to fMRI that surpasses the capabilities of unimodal EEG or fNIRS systems [19] [43] [44]. Future research should focus on standardizing integration protocols, optimizing real-time data fusion algorithms, and validating efficacy in large-scale clinical trials with patient populations [19] [43].
Diagram 2: Causal Pathway from Motor Imagery to Rehabilitation. Visual cues trigger kinesthetic motor imagery, generating complementary electrical and hemodynamic brain responses measured simultaneously by EEG and fNIRS. This multimodal measurement enables enhanced neurofeedback, which promotes neuroplasticity and ultimately supports functional motor recovery.
This case study investigates the cost-effectiveness and performance of combined electroencephalography (EEG) and functional near-infrared spectroscopy (fNIRS) for semantic decoding and cognitive state monitoring. Against the backdrop of neuroimaging cost-benefit analysis, we objectively compare this hybrid approach against standalone fMRI, fNIRS, and EEG systems. By synthesizing recent experimental data and detailing specific methodologies, we demonstrate that the integrated EEG-fNIRS modality delivers superior classification accuracy for decoding semantic categories and mental states compared to unimodal systems, while offering a favorable balance of portability, cost, and tolerance to motion artifacts that is unattainable by fMRI.
Selecting a neuroimaging technique involves balancing financial cost, temporal and spatial resolution, portability, and operational complexity. Functional magnetic resonance imaging (fMRI) is considered the gold standard for spatial resolution in semantic decoding research [6]. However, its high equipment cost, lack of portability, and restrictive scanning environment significantly limit its practicality for widespread or real-world BCI applications [6] [12]. In contrast, both EEG and fNIRS are portable, cost-effective, and better suited for real-world applications [6]. EEG provides a direct measure of neuronal electrical activity with millisecond temporal resolution but suffers from low spatial resolution and high sensitivity to motion artifacts and electrical noise [38] [47]. fNIRS measures hemodynamic responses similarly to fMRI, providing better spatial localization than EEG and higher tolerance to movement, but it has a slow temporal resolution due to the latent hemodynamic response [6] [47]. The integration of EEG and fNIRS into a single system creates a synergistic tool that compensates for their individual limitations, offering a compelling alternative for comprehensive brain monitoring that is both performant and cost-effective.
Performance Comparison of Neuroimaging Modalities
The table below summarizes the key characteristics of common non-invasive neuroimaging modalities, highlighting the complementary strengths of EEG and fNIRS.
Table 1: Cost-Effectiveness and Performance Analysis of Non-Invasive Neuroimaging Modalities
| Feature | fMRI | EEG (Standalone) | fNIRS (Standalone) | Hybrid EEG-fNIRS |
|---|---|---|---|---|
| Spatial Resolution | High (mm-level) [12] | Low (cm-level) [6] [47] | Moderate (cm-level, surface cortex) [6] [47] | Moderate-High (Improved spatial localization) [12] |
| Temporal Resolution | Low (seconds) [12] | High (milliseconds) [6] [47] | Low (seconds) [47] | High (via EEG) & Low (via fNIRS) |
| Portability | Low | High [47] | High [47] | High |
| Approx. Hardware Cost | Very High | Low [47] | Moderate [47] | Low to Moderate |
| Motion Artifact Tolerance | Low | Low [38] [47] | High [38] [47] | Moderate-High (fNIRS robustness complements EEG) |
| Best Use Case | Detailed spatial mapping of brain activity | Studying rapid neural dynamics, ERPs [47] | Naturalistic studies, sustained cognitive states [47] | Real-time BCIs, cognitive monitoring requiring speed & localization |
Case Study 1: Semantic Decoding of Imagined Concepts
Experimental Protocol and Methodology
A seminal study on semantic decoding required participants to perform silent naming and sensory-based imagery tasks (visual, auditory, tactile) for concepts from two semantic categories: animals and tools [6]. Dataset 1 involved 12 native English speakers, with simultaneous EEG and fNIRS recordings taken during 3-second task periods. The EEG captured immediate electrical correlates of neural processing, while fNIRS monitored the slower hemodynamic responses in the cortex [6].
Key Findings and Performance Data
The hybrid system successfully captured distinct brain activity patterns for the two semantic categories. While quantitative classification accuracy for this specific study was not provided in the source, the research established the feasibility of acquiring decodable signals for semantic categories using the combined modality [6]. The study underscores the value of EEG's temporal resolution in tracking the rapid onset of mental imagery and the value of fNIRS in providing more spatially localized information about the involved brain regions, a combination that is crucial for developing intuitive semantic Brain-Computer Interfaces (BCIs) [6].
Case Study 2: Cognitive Workload Monitoring
Experimental Protocol and Methodology
A study utilizing a public dataset from Technische Universität Berlin exemplifies the hybrid approach for cognitive workload classification [48]. Twenty-six participants performed n-back tasks (0-back, 2-back, 3-back) while 30-channel EEG and 36-channel fNIRS data were recorded simultaneously. The methodology involved sophisticated feature extraction from both modalities: for EEG, Functional Brain Connectivity (FBC) features in time and frequency domains were computed, moving beyond standard power band analysis; for fNIRS, oxygenated (HbO) and deoxygenated hemoglobin (HbR) concentrations were used [48].
Key Findings and Performance Data
The integration of EEG-based connectivity features and fNIRS hemodynamic biomarkers yielded superior classification performance compared to using either modality alone [48].
Table 2: Workload Classification Accuracy in an n-back Task (Hybrid EEG-fNIRS vs. Unimodal)
| Classification Task | EEG Alone | fNIRS Alone | Hybrid EEG-fNIRS |
|---|---|---|---|
| 0-back vs. 2-back | Information Missing | Information Missing | 77% Accuracy [48] |
| 0-back vs. 3-back | Information Missing | Information Missing | 83% Accuracy [48] |
The study further revealed that the most discriminative features for workload classification were located in different brain regions for each modality: the posterior area (POz electrode) for EEG in the alpha band, and the right frontal region (AF8) for fNIRS [48]. This highlights how the hybrid system provides a more comprehensive and complementary view of brain function.
Technical Implementation: Pathways and Workflows
The synergistic relationship between EEG and fNIRS signals is rooted in the principle of neurovascular coupling. The following diagram illustrates this fundamental signaling pathway and the concurrent measurement approach of a hybrid system.
Diagram 1: Neurovascular Coupling and Measurement
The experimental workflow for a hybrid EEG-fNIRS study, from setup to data fusion, can be summarized as follows:
Diagram 2: Hybrid EEG-fNIRS Experimental Workflow
The Scientist's Toolkit: Essential Research Reagents and Materials
Table 3: Essential Equipment and Software for Hybrid EEG-fNIRS Research
| Item Category | Specific Example(s) | Function/Purpose |
|---|---|---|
| EEG System | BrainAmp DC (Brain Products) [38], g.USBamp (g.tec) [49] | Measures electrical potentials on the scalp with high temporal resolution. |
| fNIRS System | NIRScout (NIRx), ETG-4000/4100 (Hitachi) [50], Imagent (ISS Inc.) [49] | Measures cortical hemodynamic responses (HbO/HbR) via near-infrared light. |
| Integrated Caps/Helmets | Custom 3D-printed helmets, EEG caps with fNIRS fixtures [12] | Ensures precise, stable, and co-registered placement of EEG electrodes and fNIRS optodes. |
| Synchronization Hardware | TTL pulses, parallel ports, shared clock systems [47] | Temporally aligns EEG and fNIRS data streams with millisecond precision. |
| Data Preprocessing Tools | EEGLAB, BBCI Toolbox (MATLAB) [48] | Performs artifact removal, filtering, and segmentation of raw data. |
| Feature Extraction & Fusion Methods | Functional Brain Connectivity, Machine Learning (SVM, Deep Learning) [48], ssmCCA [50] | Extracts meaningful features and fuses multimodal data for improved classification. |
The combined EEG-fNIRS platform represents a paradigm shift in non-invasive neuroimaging for applications requiring both high temporal and respectable spatial resolution. As evidenced by the case studies in semantic decoding and workload monitoring, this hybrid approach consistently outperforms unimodal systems in classification accuracy by leveraging complementary information from electrical and hemodynamic brain activities. While fMRI remains superior for precise spatial mapping in controlled settings, the hybrid EEG-fNIRS system offers an unparalleled balance of performance, portability, and cost-effectiveness. This makes it a particularly powerful and pragmatic tool for the next generation of real-world brain-computer interfaces, cognitive state monitoring, and clinical neuroergonomics.
The field of neurofeedback has undergone a significant transformation, evolving from a therapy confined to specialized clinics to a tool accessible for personal wellness and research. This shift is largely driven by the development of consumer-grade devices that leverage non-invasive brain imaging technologies: electroencephalography (EEG) and functional near-infrared spectroscopy (fNIRS). These tools offer a compelling alternative to traditional, high-cost imaging modalities like functional magnetic resonance imaging (fMRI), making brain activity monitoring feasible outside of laboratory settings. For researchers and drug development professionals, understanding the capabilities, limitations, and cost-effectiveness of these consumer technologies is crucial for designing future studies and interpreting the growing body of literature related to at-home brain training and monitoring. This guide provides an objective comparison of these devices and the experimental protocols that validate their use.
Technical Comparison of Brain Imaging Modalities
The choice of neuroimaging technology involves a fundamental trade-off between spatial resolution, temporal resolution, portability, and cost. The table below summarizes the core characteristics of fMRI, fNIRS, and EEG, which form the basis for understanding the value proposition of consumer devices.
Table 1: Fundamental Technical and Cost Comparison of Neuroimaging Modalities
| Characteristic | fMRI | fNIRS | EEG |
|---|---|---|---|
| Spatial Resolution | High (millimeter-level) [7] | Low (1-3 cm) [7] | Low to Moderate |
| Temporal Resolution | Low (0.33-2 Hz, lags 4-6s) [7] | Moderate (millisecond-level) [7] | High (millisecond-level) [13] |
| Depth Penetration | Whole brain (cortical & subcortical) [7] | Superficial cortical regions only [7] | Superficial cortical regions |
| Portability | No (requires immobile, shielded facility) [7] | Yes (portable and wearable systems) [7] [51] | Yes (highly portable and wearable) [13] |
| Typical Acquisition Cost | Very High (millions of dollars) | Moderate (thousands to tens of thousands) [51] | Low (hundreds to thousands for consumer devices) [52] [53] |
| Operational Context | Controlled laboratory [7] | Naturalistic environments, clinics, home [7] [54] | Naturalistic environments, clinics, home [13] |
This cost-effectiveness analysis reveals why fNIRS and EEG are the foundational technologies for consumer neurofeedback. While fMRI provides unparalleled spatial detail and whole-brain coverage, its immense cost, lack of portability, and low temporal resolution make it unsuitable for widespread, at-home application. In contrast, fNIRS and EEG offer a favorable balance of portability, cost, and sufficient physiological insight for many wellness and research applications.
Comparative Analysis of Leading Consumer Neurofeedback Devices
The consumer neurofeedback market has diversified, offering devices with different technological foundations, target applications, and price points. The following table provides a detailed comparison of leading devices available in 2025.
Table 2: Comparison of Consumer-Grade Neurofeedback Devices (2025)
| Device | Core Technology | Measured Signal | Primary Application | Price (Device) | Subscription | Key Features & Research Context |
|---|---|---|---|---|---|---|
| Myndlift | EEG | Brainwave patterns (e.g., Alpha, Beta) [53] | Clinical-grade neurofeedback; Focus, ADHD [52] | Starts at $199 [52] | $29-$150/month [52] | Custom protocols, human expert guidance, qEEG assessments; used in clinical and research settings [52] |
| Muse S Athena | EEG + fNIRS | Brainwaves + Blood oxygenation (HbO/HbR) [52] [55] | Meditation, Sleep, Focus [52] | $245-$495 [52] [53] | $12.99-$49.99/year [53] | First consumer wearable with combined EEG/fNIRS; ~500 guided meditations; used by NASA, Harvard [52] [55] |
| Sens.ai | EEG, tPBM, HRV | Brainwaves, Heart rate variability [52] [53] | Cognitive Performance, Focus [52] | $1,500 [52] | $239.99/year [53] | Multi-modality training with photobiomodulation (PBM); structured "journeys" [52] |
| Neurosity Crown | EEG (8 channels) | Brainwave patterns [52] | Productivity, Focus [52] | $1,499 [52] | Not specified | Adaptive audio feedback; API for developers; designed for wear during work/study [52] |
| Mendi | fNIRS | Blood oxygenation in Prefrontal Cortex [52] [53] | Focus, Stress Resilience [53] | $299 [52] [53] | $0 [53] | Gamified training; measures hemodynamic response associated with cognitive effort [52] [53] |
| FocusCalm | EEG | Brainwave patterns [52] [56] | Focus, Performance [56] | ~$250 [52] [53] | $149.99 lifetime [53] | Gamified brain training; "FocusCalm score" for mental state tracking [56] |
| Neurable | EEG (headphones) | Brainwave patterns [52] | Focus, Productivity [52] [55] | $499 [52] | Not specified | Premium headphones with embedded EEG; focus tracking and burnout prevention prompts [52] [55] |
Analysis of Device Selection for Research
For researchers, the choice of device hinges on the specific physiological signal of interest. EEG devices are optimal for capturing rapid, millisecond-level changes in brain electrical activity, making them suitable for studying brain states like alertness (beta waves) or relaxation (alpha waves) [13] [53]. In contrast, fNIRS devices like Mendi measure the hemodynamic response (blood oxygenation), which is a slower, metabolic correlate of neural activity, similar to fMRI but with lower spatial resolution and limited to the cortical surface [7] [53]. This makes fNIRS ideal for studies of sustained cognitive effort in the prefrontal cortex. The emergence of hybrid devices like the Muse S Athena, which combines both EEG and fNIRS, is a significant advancement, allowing for a more comprehensive investigation of brain function by capturing both electrical and hemodynamic aspects simultaneously [55].
Experimental Protocols and Validation
The validation of consumer neurofeedback devices relies on rigorous experimental protocols that compare their performance against clinical-grade equipment or established behavioral outcomes.
Protocol: Validation of Combined EEG-fNIRS Neurofeedback
A 2025 study protocol designed to evaluate the efficacy of multimodal EEG-fNIRS neurofeedback for motor imagery (MI) tasks provides a robust template for validation experiments [19].
Objective: To assess whether a neurofeedback (NF) score based on combined EEG and fNIRS signals results in higher and more specific sensorimotor brain activity during left-hand motor imagery, compared to unimodal (EEG-only or fNIRS-only) NF [19].
Methodology:
- Participants: 30 right-handed healthy adults.
- Equipment: A custom cap integrating a 32-channel EEG system (ActiCHamp) and a continuous-wave fNIRS system (NIRScout XP) with 16 detectors and 16 sources positioned over the sensorimotor cortices [19].
- Task: Participants perform kinesthetic motor imagery of their left hand.
- NF Feedback: A visual representation of a ball moving upwards on a screen, controlled in real-time by the NF score derived from brain activity in the right primary motor cortex [19].
- Design: A randomized, within-subjects design where each participant undergoes three separate NF conditions: EEG-only, fNIRS-only, and combined EEG-fNIRS.
- Primary Outcome: The NF score (representing the level of sensorimotor cortex activation) under the three conditions.
- Exploratory Outcomes: Subjective feeling of NF control and the relationship between motor imagery vividness and the NF score [19].
This protocol highlights the trend toward multimodal integration to enhance the specificity and power of neurofeedback, with potential applications in clinical motor rehabilitation, such as for post-stroke patients [19].
Protocol: Assessing Consumer Device Data Quality
For consumer devices, a common validation approach involves assessing the agreement of their outputs with gold-standard clinical systems.
Objective: To determine the signal quality and clinical reliability of a consumer wearable device against a certified medical-grade system.
Methodology:
- Parallel Recording: The consumer device (e.g., a dry-electrode EEG headset) and a clinical-grade wet-electrode EEG system are used simultaneously on the same participant during a standardized task (e.g., resting state, auditory oddball, or motor imagery).
- Signal Comparison: Key metrics are compared, including:
- Cohen’s Kappa: Used to assess agreement in sleep stage classification between a wearable and polysomnography (PSG), with values from 0.21 to 0.53 considered fair to moderate agreement [54].
- Signal-to-Noise Ratio (SNR): Quantifies the clarity of the brain signal against background noise.
- Test-Retest Reliability: Measures the consistency of the device's readings across multiple sessions.
- Artifact Resistance: The device's performance is tested during controlled movements to assess its susceptibility to motion artifacts, a common challenge for EEG [13] [54].
Experimental Flow for Device Validation
The Scientist's Toolkit: Key Research Reagents & Materials
Beyond the core devices, conducting rigorous research with consumer neurofeedback tools requires a suite of software and hardware solutions.
Table 3: Essential Research Tools for Consumer Neurofeedback Studies
| Tool / Solution | Function | Examples & Notes |
|---|---|---|
| Multimodal Data Acquisition Platform | Integrates data streams from multiple devices (EEG, fNIRS, eye-tracking, ECG) for synchronized recording and analysis. | Platforms like iMotions and GRAIL reduce experiment setup time and cost, facilitating the study of complex behaviors [57]. |
| Real-Time Signal Processing Software | Filters raw brain data in real-time to remove noise (e.g., from muscle movement, blinking) and extracts relevant features for neurofeedback. | Custom software (e.g., using Python/Matlab with toolboxes like MNE-Python, BrainFlow) or proprietary SDKs from device manufacturers (e.g., Emotiv, Muse) [19]. |
| Stimulus Presentation Software | Presents visual, auditory, or other stimuli to participants in a controlled manner during experiments. | PsychoPy, Presentation, E-Prime. |
| Data Analysis & Statistical Suite | Performs advanced statistical analysis and machine learning on the acquired brain data. | Python (with Scikit-learn, Pandas), R, MATLAB. Machine learning is increasingly used to decipher EEG/fNIRS signals [13]. |
| Sham/Control Neurofeedback System | A critical component for controlled trials; delivers feedback that is not linked to the participant's actual brain activity. | Required to isolate the specific effect of neurofeedback from placebo effects. Can be implemented by feeding pre-recorded or another participant's data to the control group [55]. |
Logical Workflow of a Neurofeedback Research System
Consumer-grade neurofeedback devices have demonstrably expanded access to brain monitoring, creating new opportunities for large-scale, ecologically valid research in neuroscience and wellness. For the research community, these devices are not a replacement for high-fidelity tools like fMRI but represent a complementary and highly scalable technology. The critical challenge moving forward is to continue rigorous, independent validation of these devices and to develop standardized experimental protocols. By leveraging multimodal approaches and robust study designs that include sham controls, researchers can fully harness the potential of these tools to advance our understanding of brain function and the efficacy of neurofeedback interventions.
Overcoming Practical Hurdles: Data Quality, Standardization, and Analytical Pipelines
In the rigorous fields of cognitive neuroscience and clinical drug development, the integrity of brain activity data is paramount. Non-invasive neuroimaging techniques—functional magnetic resonance imaging (fMRI), functional near-infrared spectroscopy (fNIRS), and electroencephalography (EEG)—are indispensable tools for probing brain function. However, their recordings are invariably contaminated by artifacts stemming from subject motion, physiological noise, and signal interference. These artifacts can obscure true neural signals, compromising data validity and leading to flawed interpretations. The choice of imaging modality directly dictates the nature and severity of these artifacts, presenting a critical trade-off between data quality, operational cost, and experimental setting. This guide provides an objective, data-driven comparison of how fMRI, fNIRS, and EEG perform in mitigating these common artifacts, framing the analysis within a broader cost-effectiveness context essential for research design and resource allocation.
fMRI, fNIRS, and EEG leverage distinct biophysical principles to measure brain activity, which directly influences their artifact profiles. fMRI measures the blood-oxygen-level-dependent (BOLD) signal, an indirect correlate of neural activity [7] [24]. fNIRS also measures a hemodynamic response by detecting changes in oxygenated (HbO) and deoxygenated hemoglobin (HbR) using near-infrared light, but does so more directly on the cortical surface [58] [24]. In contrast, EEG measures the brain's electrical activity directly via electrodes on the scalp, capturing postsynaptic potentials with millisecond precision [58] [11].
Table 1: Technical Specifications and Artifact Vulnerability Profile
| Feature | EEG | fNIRS | fMRI |
|---|---|---|---|
| Primary Signal | Electrical activity from cortical neurons [58] | Hemodynamic response (HbO/HbR) [58] [24] | Hemodynamic BOLD response [7] [24] |
| Temporal Resolution | High (milliseconds) [58] [11] | Moderate (seconds) [58] | Low (seconds) [7] [24] |
| Spatial Resolution | Low (centimeter-level) [58] [11] | Moderate (better than EEG) [58] | High (millimeter-level) [7] [24] |
| Depth of Measurement | Cortical surface [58] | Outer cortex (1–2.5 cm) [58] | Whole brain (cortical & subcortical) [7] |
| Main Artifact Sources | Motion, muscle activity, eye blinks, electrical interference [58] | Motion, scalp blood flow, systemic physiology [7] [41] | Motion, cardiac/respiratory cycles, scanner noise [7] [24] |
Motion Artifacts: From Lab to Real-World Settings
Motion artifacts are a primary determinant of a modality's suitability for naturalistic studies or challenging populations.
Vulnerability and Mechanisms
- fMRI: Extremely sensitive. Even millimeter-scale head movements can cause significant image distortion and signal loss [7] [24]. The confined scanner environment severely restricts natural movement.
- EEG: Highly susceptible. Motion causes electrode displacement, cable sway, and changes in skin-electrode impedance, generating electrical noise that can dwarf neural signals [58].
- fNIRS: Notably more robust. Movement primarily causes optode decoupling from the scalp, which is often manageable [58] [41]. Its portability enables stable recordings during walking, rehabilitation, and other controlled movements.
Mitigation Strategies and Protocols
- fMRI Protocol: Mitigation involves using head restraints, padding, and real-time motion correction algorithms. Participant training is critical to minimize movement [7].
- EEG Protocol: Requires secure cap fitting, often with chin straps. Using active electrodes and accelerometers can help detect and correct for motion post-hoc [58].
- fNIRS Protocol: Involves using robust, flexible head probes and ensuring good optode-scalp contact. Algorithms like the Scalp-Coupled Index (SCI) can automatically identify and exclude poor-quality signals [8].
Physiological Noise: Separating Brain from Body
Physiological processes are a major source of confounding signals that can mimic or mask genuine brain activity.
- fNIRS and fMRI: Both hemodynamic modalities are severely affected by systemic physiological noise. Cardiac pulsatility, respiration, and blood pressure oscillations (Mayer waves) create strong fluctuations in HbO/HbR and the BOLD signal that are not of neural origin [7] [8]. For fNIRS, superficial scalp blood flow is a particularly dominant confound [7].
- EEG: The electrical activity of the heart (ECG) and muscles (EMG) are major noise sources. Eye movements and blinks (EOG) produce large electrical potentials that overwhelm cortical signals [58].
Experimental Mitigation Methodologies
- For fNIRS: A standard protocol involves using short-separation channels (optodes placed 8-15 mm apart) [8]. These channels predominantly capture systemic physiology from the scalp, which can then be regressed out from the standard channels.
- For fMRI: RETROICOR is a common method that uses recordings of cardiac and respiratory cycles to model and remove noise-related signal variations from the BOLD data [7].
- For EEG: Independent Component Analysis (ICA) is a widely used blind source separation technique that can effectively identify and remove components corresponding to EOG, ECG, and EMG artifacts [58].
Signal Interference and Technical Artifacts
- EEG: Highly susceptible to environmental electromagnetic interference from power lines (50/60 Hz) and electronic equipment [58]. This requires shielded rooms and proper grounding.
- fMRI: The primary technical artifact is the intense acoustic noise generated by gradient coils, which can affect cognitive tasks and auditory responses [24].
- fNIRS: Relatively immune to electromagnetic interference, making it suitable for use alongside MRI or EEG, and in electrically noisy environments [24].
The Multimodal Approach: Integrating EEG and fNIRS
Combining EEG and fNIRS is a powerful strategy to overcome the limitations of unimodal systems, providing a more comprehensive view of brain function by capturing both electrical and hemodynamic activity [58] [19] [59].
Experimental Protocol for Simultaneous EEG-fNIRS
A validated protocol for a motor imagery (MI) study involves [19] [8]:
- Hardware Setup: Use an integrated cap (e.g., EasyCap) that holds both EEG electrodes and fNIRS optodes, positioned over sensorimotor cortices according to the international 10-10 or 10-20 systems.
- Synchronization: Synchronize the EEG and fNIRS systems via hardware triggers (TTL pulses) or a shared clock to align the data streams temporally.
- Task Design: Employ a block design. Participants perform cued left or right-hand motor imagery tasks, followed by rest periods.
- Visual Feedback: Provide participants with a real-time neurofeedback signal, such as a visual representation of a ball moving on a screen, controlled by a combined EEG-fNIRS score.
- Data Processing: Process the two signals through separate, optimized pipelines before data fusion. EEG analysis may focus on event-related desynchronization (ERD), while fNIRS analysis examines HbO concentration changes. Fusion techniques like joint Independent Component Analysis (jICA) or machine learning classifiers can then integrate the features [58] [60].
Multimodal Experimental Workflow
Cost-Effectiveness Analysis for Research Planning
Beyond technical performance, the economic and practical costs of these modalities are crucial for research design.
- fMRI: Represents the highest cost paradigm. The equipment is expensive to purchase and maintain, and scan time fees are high, limiting sample sizes and longitudinal testing [24] [11].
- EEG: Is the most cost-effective option. Systems are relatively affordable, have minimal ongoing costs, and allow for rapid testing of large cohorts [58] [24].
- fNIRS: Occupies a middle ground. It is more affordable than fMRI and offers a favorable balance of cost, portability, and tolerance for movement, making it suitable for extended or ecological studies [24].
Table 2: Cost and Operational Comparison for Research Scenarios
| Factor | EEG | fNIRS | fMRI |
|---|---|---|---|
| Equipment/Session Cost | Generally lower [58] | Generally higher than EEG [58] | Very high acquisition and operational cost [24] [11] |
| Portability & Setting | High (lightweight, wireless systems) [58] | High (ideal for mobile, real-world settings) [58] [24] | None (restricted to shielded lab) [7] [24] |
| Participant Limitations | Few | Few (suitable for infants, patients with implants) [24] | Many (claustrophobia, metal implants, inability to lie still) [24] |
| Best-Suited Research | Fast cognitive tasks, ERPs, sleep studies, large-N studies [58] | Naturalistic studies, child development, motor rehab, clinical populations [58] [24] | Precise spatial localization of deep brain structures, clinical diagnostics [7] |
Essential Research Reagent Solutions
The following table details key materials and tools required for conducting artifact-resistant neuroimaging studies.
Table 3: Key Research Reagents and Materials
| Item | Function & Application |
|---|---|
| Integrated EEG-fNIRS Cap | A single head cap with pre-defined placements for both electrodes and optodes, ensuring consistent co-registration and minimizing setup time [19]. |
| Short-Separation fNIRS Channels | Specialized optode pairs placed close together (<15mm) to measure and subsequently remove systemic physiological noise from the scalp in fNIRS signals [8]. |
| Electrode Electrolyte Gel | A conductive medium applied to EEG electrodes to reduce skin-electrode impedance, which is crucial for improving signal quality and stability against motion [58]. |
| Head Restraint/Padding | Used in fMRI to physically limit head movement, which is the primary source of artifact in this modality [7]. |
| Motion Tracking System | Accelerometers or optical cameras to record head movement. This data is used for post-processing motion correction in all modalities [58] [41]. |
| Blind Source Separation Software | Software tools (e.g., implementing ICA) to separate neural signals from artifacts like eye blinks and muscle activity in EEG data [58]. |
No single neuroimaging modality is universally superior; the optimal choice is a direct function of the research question, experimental constraints, and budget.
- Choose EEG when your primary interest lies in the timing of fast cognitive processes and when budget and portability are key, accepting limitations in spatial precision and vulnerability to motion [58].
- Choose fNIRS when you need a better spatial localization of cortical activity than EEG can provide, in settings that involve movement, or with populations (infants, patients) incompatible with fMRI [58] [24].
- Choose fMRI when your research demands whole-brain coverage including subcortical structures, and millimeter-level spatial resolution, and you have the necessary resources and controlled environment [7].
For the most comprehensive insight into brain function, a multimodal EEG-fNIRS approach is increasingly viable. It harnesses the temporal resolution of EEG and the improved spatial resolution of fNIRS, mitigating the individual weaknesses of each and providing a richer, more robust dataset for understanding the complex dynamics of the human brain [58] [19] [59].
The growing complexity of data analysis pipelines in brain imaging research has made understanding how methodological choices affect results essential for ensuring reproducibility and transparency. This is particularly relevant for functional Near-Infrared Spectroscopy (fNIRS), a rapidly growing neuroimaging technique for assessing brain function in naturalistic settings across the lifespan that still lacks standardized analysis approaches [41]. Failures to replicate or reproduce published work have raised major concerns across scientific fields, catalyzing initiatives to improve these critical aspects of research. In neuroimaging specifically, the problem relates significantly to analysis complexity, as current pipelines encompass multiple stages with numerous parameters at each step, providing researchers with considerable flexibility that also poses challenges for result comparability [41].
The fNIRS Reproducibility Study Hub (FRESH) initiative represents a direct community response to these challenges. In this landmark effort, 38 research teams worldwide were asked to independently analyze the same two fNIRS datasets, revealing that despite using different pipelines, nearly 80% of teams agreed on group-level results, particularly when hypotheses were strongly supported by literature [41] [61]. Teams with higher self-reported analysis confidence, which correlated with years of fNIRS experience, showed greater agreement, while at the individual level, agreement was lower but improved with better data quality [41]. The main sources of variability were related to how poor-quality data were handled, how responses were modeled, and how statistical analyses were conducted [41] [61]. These findings highlight that while flexible analytical tools are valuable, clearer methodological and reporting standards could greatly enhance reproducibility in fNIRS research.
Comparative Analysis of Neuroimaging Modalities
Technical Foundations and Measurement Principles
Understanding the fundamental differences between fMRI, fNIRS, and EEG is crucial for evaluating their respective reproducibility challenges and cost-effectiveness.
fMRI relies on different magnetic properties of oxygenated hemoglobin (diamagnetic) and deoxygenated hemoglobin (paramagnetic). Using magnetic resonance imaging and radio frequency pulses, it measures the blood-oxygen-level-dependent (BOLD) response, which reflects changes in deoxygenated hemoglobin due to increased blood flow when brain regions activate [24].
fNIRS utilizes the different absorption characteristics of oxygenated and deoxygenated hemoglobin to near-infrared light (650-1000 nm) to measure relative concentration changes in both hemoglobin species [24]. Like fMRI, it measures the hemodynamic response, but using optical rather than magnetic principles.
EEG measures the brain's electrical activity via electrodes placed on the scalp, detecting voltage changes caused by synchronized firing of cortical neurons, primarily pyramidal cells [62]. It provides a direct measurement of neural activity rather than the indirect hemodynamic response measured by fMRI and fNIRS.
Performance and Capability Comparison
Table 1: Technical comparison of fMRI, fNIRS, and EEG neuroimaging modalities
| Feature | fMRI | fNIRS | EEG |
|---|---|---|---|
| What It Measures | BOLD signal (deoxygenated hemoglobin) | Hemodynamic response (oxygenated & deoxygenated hemoglobin) | Electrical activity of neurons |
| Temporal Resolution | Low (0.33-2 Hz) [7] | Moderate (seconds) [62] | High (milliseconds) [62] |
| Spatial Resolution | High (millimeter-level) [7] | Moderate (1-3 cm) [7] | Low (centimeter-level) [62] |
| Depth of Measurement | Whole brain (cortical & subcortical) [7] | Superficial cortex (1-2.5 cm) [7] [62] | Cortical surface [62] |
| Portability | Low (requires MRI scanner) | High (wearable systems available) [24] | High (wireless systems available) [62] |
| Tolerance to Motion Artifacts | Low (highly sensitive) [7] | Moderate (relatively robust) [24] [62] | Low (susceptible) [62] |
| Subject Population Limitations | People with metal implants, claustrophobia | Minimal limitations [24] | Minimal limitations |
Cost-Effectiveness Analysis
Table 2: Economic and practical considerations for research use
| Consideration | fMRI | fNIRS | EEG |
|---|---|---|---|
| Equipment Cost | Very high [24] | Moderate [24] | Lower [62] |
| Operational Expenses | High per scan [24] | Low ongoing costs [24] | Low ongoing costs |
| Setup Time | Lengthy preparation [24] | Relatively quick [24] | Moderate (requires electrode prep) [62] |
| Operator Expertise Required | Extensive training needed [24] | Moderate expertise [24] | Moderate expertise [62] |
| Participant Throughput | Lower | Higher | Higher |
| Naturalistic Testing Capability | Limited [7] | High [7] [24] | Moderate [62] |
Key Experiments and Community Initiatives
The FRESH Initiative: Methodology and Findings
The fNIRS Reproducibility Study Hub (FRESH) initiative represents one of the most comprehensive examinations of analytical variability in neuroimaging. The study design involved distributing the same two fNIRS datasets to 38 independent research teams globally, asking each to analyze the data using their preferred pipelines while addressing predefined research questions [41] [61]. The shared datasets included both high-quality and challenging data to examine how data quality affects analytical variability across teams. Each team documented their complete analysis pipeline, including preprocessing steps, statistical models, and hypothesis testing approaches, along with their self-reported experience levels and confidence in their analyses [41].
The findings revealed several critical insights into reproducibility challenges in fNIRS research. First, while nearly 80% of teams agreed on group-level results for hypotheses strongly supported by existing literature, agreement rates were significantly lower for individual-level analyses [41] [61]. Second, researchers with more fNIRS experience and higher self-reported confidence demonstrated greater agreement in their results, suggesting that expertise reduces analytical variability [41]. Third, data quality emerged as a crucial factor, with better quality data yielding more consistent results across different analysis pipelines [41]. The study identified three primary sources of variability: approaches to handling poor-quality data (artifact rejection, signal correction), hemodynamic response modeling (basis functions, timing parameters), and statistical analysis methods (multiple comparison correction, significance thresholds) [41].
Multimodal Validation Studies
Several studies have directly compared fNIRS measurements with established neuroimaging techniques to validate its reliability and identify modality-specific considerations:
fNIRS-fMRI Comparison Studies: A study by Klein et al. (2022) provided fMRI-based validation of fNIRS for measuring brain activity in the supplementary motor area during motor execution and imagination, finding that fNIRS could reliably detect SMA activation with good spatial specificity and task sensitivity [24]. Huppert et al. (2017) performed simultaneous fNIRS-fMRI and fNIRS-MEG measurements during parametric median nerve stimulation, finding good correspondence between modalities and validating source-localized fNIRS in multimodal measurements [24].
EEG-fNIRS Structure-Function Relationship Research: A 2024 study published in Scientific Reports examined simultaneous EEG and fNIRS recordings from 18 subjects during resting state and motor imagery tasks to characterize global and local structure-function coupling [8]. The research found that fNIRS structure-function coupling resembled slower-frequency EEG coupling at rest, with variations across brain states and oscillations. Locally, the relationship was heterogeneous, with greater coupling in the sensory cortex and increased decoupling in the association cortex, following the unimodal to transmodal gradient [8]. Discrepancies between EEG and fNIRS were noted, particularly in the frontoparietal network, highlighting how different physiological mechanisms captured by each modality provide complementary information [8].
The analytical flexibility in fNIRS processing, while valuable for addressing diverse research questions, introduces significant variability that affects reproducibility. The FRESH initiative identified several critical points where analytical decisions diverge, visualized in the following workflow:
This workflow illustrates the three primary sources of analytical variability identified in the FRESH initiative: (1) artifact handling methods, including motion correction algorithms, signal quality assessment criteria, and channel exclusion thresholds; (2) hemodynamic response function modeling, encompassing basis function selection, temporal derivation approaches, and delay modeling parameters; and (3) statistical analysis decisions, including multiple comparison correction techniques, significance thresholds, and region of interest definition [41]. Teams with higher self-reported confidence and more fNIRS experience tended to make more consistent choices at these critical junctures, leading to improved agreement in findings [41].
Research Toolkit: Essential Materials and Solutions
Table 3: Essential research tools and resources for fNIRS research
| Tool Category | Specific Examples | Function/Purpose |
|---|---|---|
| Analysis Software | Brain AnalyzIR [63], NeuroDOT [63], MNE [8], Brainstorm [8] | Data processing, statistical analysis, visualization |
| Educational Resources | SfNIRS Summer School [63] [64], fNIRS Toolbox Workshop [63], NeuroDOT Workshops [63] | Training on methodology, analysis techniques, best practices |
| Community Initiatives | FRESH Initiative [41], SfNIRS Organization [65], fNIRS Conferences [63] | Reproducibility testing, knowledge sharing, standardization |
| Hardware Solutions | High-density DOT systems [63], Integrated EEG-fNIRS caps [62] | Data acquisition, multimodal integration |
| Probe Placement Tools | 3D digitalization systems, AtlasViewer [24] | Anatomical registration, accurate optode positioning |
The reproducibility challenge in fNIRS research stems primarily from analytical flexibility rather than fundamental limitations of the technology itself. Evidence from community initiatives like FRESH demonstrates that while different analysis pipelines can produce variable results, particularly at the individual level and with lower-quality data, strong consensus emerges when hypotheses are well-supported and researchers possess adequate expertise [41]. The fNIRS community has responded proactively to these challenges through educational initiatives, standardized toolbox development, and reproducibility testing frameworks [65] [63].
For researchers and drug development professionals selecting neuroimaging modalities, fNIRS offers a compelling balance of cost-effectiveness, portability, and tolerability that positions it as a valuable tool between the high spatial resolution but limited accessibility of fMRI and the high temporal resolution but limited spatial precision of EEG [24] [62]. The ongoing standardization efforts within the fNIRS community, coupled with clearer methodological reporting standards and enhanced training opportunities, promise to further strengthen its reproducibility and establish its role in comprehensive multimodal brain imaging approaches [41] [63].
The quest to decipher the intricate functions of the human brain requires a multimodal approach, as no single neuroimaging technique can fully capture the complexity of neural activity. Functional Magnetic Resonance Imaging (fMRI), functional Near-Infrared Spectroscopy (fNIRS), and Electroencephalography (EEG) each offer distinct advantages and suffer from unique limitations. fMRI provides high spatial resolution for visualizing deep brain structures but is expensive, immobile, and has limited temporal resolution. fNIRS offers a portable, cost-effective alternative with good temporal resolution but is restricted to monitoring superficial cortical regions. EEG delivers millisecond-level temporal precision but lacks spatial detail and is susceptible to noise [7] [8]. This complementary nature has driven the development of advanced computational strategies for fusing and augmenting these multimodal data streams.
Framed within a broader thesis on cost-effectiveness, this guide objectively compares the performance of integrated fMRI-fNIRS, EEG-fNIRS, and other multimodal approaches. The synergy between these modalities extends beyond mere data acquisition; it enables a more comprehensive characterization of brain processes by leveraging fMRI's spatial detail, fNIRS's portability and hemodynamic tracking, and EEG's temporal precision. This integration is particularly crucial in clinical settings and naturalistic studies where traditional neuroimaging fails, and for advancing brain-computer interfaces (BCIs) that demand both speed and accuracy [7] [66] [67]. The following sections detail the computational frameworks, experimental protocols, and performance benchmarks that are defining the future of multimodal brain research.
Comparative Performance of Multimodal Neuroimaging Technologies
The integration of multiple neuroimaging modalities aims to create a synergistic system where the strengths of one technique compensate for the weaknesses of another. The tables below provide a structured comparison of the technical specifications and integrative performance of fMRI, fNIRS, and EEG, both as standalone technologies and when combined.
Table 1: Technical Specifications and Cost-Effectiveness of Core Neuroimaging Modalities
| Modality | Spatial Resolution | Temporal Resolution | Portability & Cost | Primary Strengths | Inherent Limitations |
|---|---|---|---|---|---|
| fMRI | High (millimeter-level), whole-brain coverage [7] | Low (0.33-2 Hz), hemodynamic lag (4-6 s) [7] | Low portability, high equipment and operational cost [7] | Excellent spatial mapping of cortical and subcortical structures [7] | Sensitive to motion artifacts, unsuitable for naturalistic settings [7] |
| fNIRS | Moderate (1-3 cm), superficial cortex only [7] | Moderate (typically 2-10 Hz) [8] | High portability, cost-effective, bedside use [7] [33] | Resilient to motion artifacts, suitable for naturalistic environments [7] [67] | Limited penetration depth, confounded by scalp blood flow [7] |
| EEG | Low (centimeter-level) [22] | Very High (millisecond-level) [22] | High portability, very cost-effective [22] | Captures rapid neural dynamics, excellent for real-time BCI [22] [67] | Low spatial resolution, susceptible to environmental and motion noise [22] [8] |
Table 2: Performance Benchmarks of Multimodal Integrations
| Multimodal Fusion | Key Integration Strategy | Reported Performance & Advantages | Primary Applications |
|---|---|---|---|
| fMRI-fNIRS | Synchronous and asynchronous data acquisition; leverages fMRI for spatial depth and fNIRS for temporal detail and portability [7] | Validates fNIRS efficacy; enables robust spatiotemporal mapping in motor, cognitive, and clinical tasks [7] | Spatial localization, validation studies, neurological disorders (stroke, Alzheimer's) [7] |
| EEG-fNIRS | Feature-level and data-driven fusion; combines EEG speed with fNIRS spatial robustness [22] [67] | Significantly higher classification accuracy vs. unimodal BCI (e.g., 88.33% vs. 84.28% for EEG alone in MI) [67]. Aids in discriminating clinical states (e.g., DOC) [33] | Motor Imagery BCIs, mental workload assessment, disorders of consciousness (DOC) [22] [33] [67] |
| EEG-fNIRS with Data Augmentation (EFDA-CDG) | Fusion of Denoising Diffusion Probabilistic Model (DDPM) with added Gaussian noise on unified spatiotemporal features [22] | Achieves high accuracy on BCI tasks: 82.02% (motor imagery), 91.93% (mental arithmetic), 90.54% (n-back) [22] | Overcoming data scarcity for deep learning; enhancing hybrid BCI system performance and robustness [22] |
Experimental Protocols for Multimodal Data Acquisition and Fusion
Protocol 1: Motor Imagery BCI with EEG-fNIRS Feature-Level Fusion
This protocol details a validated methodology for classifying left and right-hand motor imagery tasks, achieving high accuracy through feature-level fusion of EEG and fNIRS.
- Objective: To accurately discriminate between left and right-hand motor imagery tasks for BCI applications by fusing complementary information from EEG and fNIRS [67].
- Equipment Setup:
- EEG System: 30 electrodes placed according to the international 10-5 system, sampled at 1000 Hz [8].
- fNIRS System: 36 channels (14 sources, 16 detectors) with an inter-optode distance of 30 mm, placed following the 10-20 system. Uses wavelengths of 760 nm and 850 nm to measure changes in oxygenated (HbO) and deoxygenated hemoglobin (HbR), sampled at 12.5 Hz [8] [67].
- Paradigm: Participants are shown synchronous dynamic visual cues (e.g., arrows) to guide them in mentally simulating grasping movements with either their left or right hand [67].
- Data Preprocessing:
- EEG: Data is down-sampled to 200 Hz and filtered into specific frequency bands of interest [8] [67].
- fNIRS: Raw light intensity is converted into optical density and then into HbO and HbR concentrations using the modified Beer-Lambert law. Signals are band-pass filtered (e.g., 0.01-0.2 Hz) to remove physiological noise [8] [67].
- Feature Extraction & Fusion:
- EEG Features: Common Spatial Pattern (CSP) features are extracted from multiple frequency bands of the EEG signals to capture event-related synchronization/desynchronization (ERS/ERD) [67].
- fNIRS Features: Modified CSP (MCSP) features are extracted from the HbO and HbR signals [67].
- Feature Selection: A hybrid
Relief-mRMRalgorithm is applied to select the most relevant and non-redundant features from the combined EEG and fNIRS set, reducing dimensionality [67]. - Fusion: The selected EEG and fNIRS features are concatenated into a single feature vector for classification [67].
- Classification: A Support Vector Machine (SVM) classifier is trained on the fused feature vectors to discriminate between the two motor imagery tasks [67].
Protocol 2: Data Augmentation for EEG-fNIRS using Generative Models
This protocol addresses the challenge of limited dataset size in deep learning by creating synthetic, high-quality multimodal data.
- Objective: To enhance the performance and robustness of EEG-fNIRS hybrid BCI systems through data augmentation, particularly for deep learning models that require large training sets [22].
- Data Preprocessing and Unified Representation:
- Raw EEG and fNIRS signals are preprocessed to remove artifacts and noise.
- A critical step involves creating a joint distribution sample where the temporal and spatial dimensions of EEG and fNIRS data are unified. This often involves manual feature extraction and spatial mapping interpolation to align the two modalities into a cohesive data structure [22].
- Augmentation Strategy (EFDA-CDG Framework):
- Denoising Diffusion Probabilistic Model (DDPM): A deep generative model is trained on the joint distribution samples. The DDPM learns the underlying data distribution and can generate novel, synthetic samples that highly resemble the original data, providing diversity for the training set [22].
- Adding Gaussian Noise: In parallel, the original data is augmented by adding Gaussian noise. This traditional method creates samples that improve the classifier's robustness to noise and signal variations [22].
- Combined Training Set: The DDPM-generated samples and the Gaussian-noise-augmented samples are combined with the original training data, significantly expanding and enriching the dataset [22].
- Classification: A dedicated classification module (e.g., one that uses EEG feature attention and fNIRS terrain attention) is then trained on this augmented dataset, leading to improved accuracy and generalization [22].
Workflow Visualization of Multimodal Integration
The following diagram illustrates the overarching workflow for multimodal data fusion and augmentation, integrating key elements from the experimental protocols.
Multimodal Data Fusion and Augmentation Workflow
The Scientist's Toolkit: Essential Research Reagents and Materials
Successful execution of multimodal neuroimaging experiments relies on a suite of specialized hardware, software, and analytical tools. The table below catalogues the key "research reagents" essential for this field.
Table 3: Essential Research Reagents for Multimodal Neuroimaging
| Category | Item / Solution | Specification / Function |
|---|---|---|
| Core Hardware | fMRI Scanner | High-field strength (e.g., 3T) for high spatial resolution BOLD signal acquisition [7]. |
| fNIRS System | Continuous-wave systems with sources (e.g., 730nm, 850nm) and detectors; configurable for high-density (HD-DOT) or portable setups [7] [66] [33]. | |
| EEG System | High-impedance amplifiers with 32+ electrodes according to 10-5 or 10-20 international systems for high-quality electrical signal capture [8] [67]. | |
| Software & Programming Tools | MATLAB with Toolboxes | Homer2 (fNIRS preprocessing), EEGLAB/FieldTrip (EEG processing), NIRS-KIT, BrainNet Viewer (visualization) [8] [33]. |
| Python Libraries | MNE-Python (EEG/MEG analysis), PyTorch/TensorFlow for implementing deep learning models (e.g., DDPM, CSPNet) [22]. | |
| Brainstorm | Open-source application for multimodal data analysis and visualization, compatible with EEG and fNIRS [8]. | |
| Analytical & Computational Methods | Common Spatial Patterns (CSP) | Algorithm for extracting spatial filters that maximize variance for one class of EEG signals while minimizing it for another, crucial for Motor Imagery BCI [67]. |
| Denoising Diffusion Probabilistic Model (DDPM) | A deep generative model used for creating high-quality synthetic EEG-fNIRS data to overcome data scarcity [22]. | |
| Graph Signal Processing (GSP) | Mathematical framework for analyzing functional brain data in relation to the underlying structural connectome [8]. | |
| Support Vector Machine (SVM) | A robust classifier frequently used for BCI tasks due to its effectiveness with high-dimensional features [67]. |
The integration of fMRI, fNIRS, and EEG through advanced computational strategies represents a paradigm shift in neuroimaging. The experimental data and performance comparisons presented in this guide unequivocally demonstrate that multimodal fusion achieves superior outcomes compared to unimodal approaches, offering enhanced classification accuracy for BCIs and more sensitive biomarkers for clinical diagnostics. The cost-effectiveness of portable modalities like fNIRS and EEG, especially when fused, makes advanced brain monitoring feasible in naturalistic settings and at the bedside, broadening the scope of neuroscientific inquiry and clinical application.
Future progress in this field hinges on overcoming several key challenges. Technologically, there is a pressing need for hardware innovation, such as developing MRI-compatible fNIRS probes to reduce interference during simultaneous acquisition [7]. From a computational standpoint, the development of standardized data fusion protocols and public, curated multimodal datasets is crucial for reproducibility and benchmarking [7] [66]. Furthermore, while data augmentation frameworks like EFDA-CDG show immense promise, interpreting the complex models that result from deep learning and ensuring their reliability in real-world, clinical scenarios remains an open frontier. As these technical and methodological hurdles are addressed, multimodal neuroimaging is poised to deepen our fundamental understanding of brain function and dramatically improve diagnostic and therapeutic strategies in neurology and psychiatry.
Simultaneous electroencephalography (EEG) and functional near-infrared spectroscopy (fNIRS) recording offers a compelling, cost-effective approach for brain imaging, combining EEG's millisecond temporal resolution with fNIRS's superior spatial localization for cortical areas. However, the development of a unified hardware platform, particularly the design of the acquisition helmet, presents significant engineering challenges that can compromise data quality. This guide objectively compares the performance of different helmet design strategies—from modified textile caps to fully customized 3D-printed solutions—against the gold standard of functional magnetic resonance imaging (fMRI). We summarize quantitative data on design efficacy, detail experimental methodologies for integration, and provide a toolkit for researchers navigating the trade-offs between cost, accuracy, and practicality in multimodal neuroimaging.
In the context of brain research and drug development, the choice of neuroimaging technology is a critical decision with major implications for research capabilities, participant pools, and budgetary constraints. Functional magnetic resonance imaging (fMRI) is often considered the gold standard for its high spatial resolution and deep tissue penetration [24]. However, its prohibitive cost, lack of portability, and sensitivity to motion artifacts limit its use in large-scale studies, longitudinal monitoring, and ecologically valid experimental settings [24] [68].
The complementary nature of EEG and fNIRS has established their dual-modality system as a portable and cost-effective alternative. EEG measures the brain's electrical activity directly with high temporal resolution, while fNIRS measures hemodynamic responses associated with neural activity, offering better spatial resolution than EEG [12] [68]. Table 1 provides a direct performance and cost comparison of these primary neuroimaging modalities.
Table 1: Comparative Analysis of Key Neuroimaging Modalities
| Feature | fMRI | EEG | fNIRS | fNIRS-EEG |
|---|---|---|---|---|
| Spatial Resolution | High (mm-level) | Low (cm-level) | Moderate (cortical) | Moderate (cortical) |
| Temporal Resolution | Low (seconds) | High (milliseconds) | Low (seconds) | High & Low (combined) |
| Portability | No | High | High | High |
| Subject Movement | Highly restricted | Moderate tolerance | High tolerance | Moderate tolerance |
| Hardware Cost | Very High | Low | Moderate | Moderate |
| Operational Context | Controlled lab | Lab/Field | Lab/Field | Lab/Field |
| Key Measured Signal | BOLD (HbR) | Electrical potentials | HbO & HbR | Electrical & Hemodynamic |
The principal challenge lies in the hardware integration of these two modalities. A successful integration must ensure precise and stable sensor placement, prevent signal interference, and maintain consistent scalp coupling for both electrical electrodes and optical optodes, all while being comfortable for the participant [12] [69]. The following sections dissect the hurdles and solutions in designing the core of this system: the custom helmet.
Core Hurdles in fNIRS-EEG Helmet Design
The Scalp-Coupling and Placement Accuracy Problem
A fundamental hurdle is the mechanical incompatibility between the requirements for EEG electrodes and fNIRS optodes. Prevailing methods that involve integrating fNIRS probes into standard elastic EEG caps are suboptimal for two key reasons [12]:
- Uncontrolled Optode Distance: Elastic fabric caps stretch differently on various head shapes, leading to uncontrollable variations in the distance between fNIRS light sources and detectors. This distance is critical as it directly affects signal strength, sensitivity to brain tissue, and data quality [12] [69].
- Inconsistent Contact Pressure: The high stretchability of fabric provides limited ability to secure rigid fNIRS probes, resulting in fluctuating probe-to-scalp contact pressure. This inconsistency can lead to movement artifacts and poor data quality, especially during long-duration experiments [12].
Furthermore, fNIRS lacks a standardized system like the 10-20 system for EEG. Using EEG coordinates as a proxy for fNIRS layout is a common workaround but is problematic because fNIRS channel distances are absolute and critical, whereas EEG electrode distances are relative to head circumference [69].
Signal Interference and Data Synchronization
Simultaneous recording requires careful hardware design to avoid interference. While fNIRS and EEG generally do not create electro-optical interference, physical hardware layout is crucial [70]. EEG electrodes and fNIRS optodes must be arranged to avoid physical collision and electrical cross-talk [71] [68].
There are two primary methods for system integration [12]:
- Separate Synchronized Systems: Using separate NIRScout and BrainAMP systems synchronized via a host computer. This is simpler but may lack the precision needed for microsecond-level EEG analysis.
- Unified Processor System: A single unified processor simultaneously acquires and processes both EEG and fNIRS signals. This method is more complex but achieves precise synchronization and streamlines analysis.
Table 2: Comparison of fNIRS-EEG Integration Methods
| Integration Method | Synchronization Precision | System Complexity | Implementation Ease | Best For |
|---|---|---|---|---|
| Separate Systems | Moderate | Low | Straightforward | Experiments where precise microsecond alignment is not critical |
| Unified Processor | High | High | More intricate | Studies requiring exact temporal alignment for neurovascular coupling analysis |
Evaluating Custom Helmet Design Solutions
To overcome the scalp-coupling and placement challenges, researchers have moved beyond standard caps to develop customized helmet solutions.
3D-Printed Custom Helmets (ninjaCap)
The "ninjaCap" approach uses 3D printing with flexible thermoplastic polyurethane (TPU) to create personalized headgear [69]. This method translates 3D brain coordinates from a head model (atlas-based or subject-specific) into 2D printable panels, ensuring geometrical fidelity.
- Performance Data: This method offers a probe placement accuracy of 2.7 ± 1.8 mm, significantly outperforming manual cap preparation [69].
- Advantages:
- High Accuracy: Enables precise translation of virtual probe layouts to physical placement.
- Perfect Fit: Tailored to individual head size and shape, improving comfort and signal quality.
- Design Flexibility: Can accommodate complex, high-density probe geometries not possible with standard EEG coordinates.
- Reduced Variability: Eliminates inter-session and inter-subject cap assembly variability [69].
- Disadvantages:
- Higher Initial Cost: Requires access to and cost of 3D printing technology.
- Manufacturing Time: Involves a digital workflow and printing time for each custom cap.
Cryogenic Thermoplastic Sheets
An alternative custom approach uses composite polymer cryogenic thermoplastic sheets. This material becomes soft and pliable at around 60°C, allowing it to be molded directly to a participant's head, where it retains its shape upon cooling [12].
- Advantages: Cost-effective, lightweight, and provides a better custom fit than standard caps.
- Disadvantages: The molded sheet can be slightly rigid and may exert uncomfortable pressure on the head [12].
Modified Textile EEG Caps
The most common approach involves using a flexible EEG electrode cap as a base, creating punctures at specific locations to accommodate fNIRS probe fixtures [12] [71].
- Advantages: Low cost, utilizes familiar equipment, and is quick to implement for proof-of-concept studies.
- Disadvantages: Suffers from the inherent limitations of poor placement accuracy and unstable optode coupling described in section 2.1 [12].
Table 3: Performance Comparison of Helmet Design Solutions
| Design Solution | Placement Accuracy | Stability & Contact | Cost | Setup Speed | Ideal Use Case |
|---|---|---|---|---|---|
| Modified Textile Cap | Low | Low | Low | Fast | Pilot studies, low-budget projects |
| Cryogenic Thermoplastic | Moderate | Moderate | Low | Moderate | Single-subject studies, budget-conscious labs |
| 3D-Printed (ninjaCap) | High (2.7±1.8 mm) | High | Moderate/High | Slow (per cap) | High-density studies, clinical trials, source localization |
Experimental Protocols for Validation
When implementing a custom fNIRS-EEG helmet, its performance must be validated experimentally. The following protocol is adapted from seminal studies in the field [12] [69] [6].
Protocol: Validation of Helmet Fit and Signal Quality
Objective: To quantitatively compare the performance of a custom-designed helmet (e.g., 3D-printed) against a modified textile cap in terms of probe placement accuracy and signal quality.
Methodology:
- Participant Recruitment: Recruit a cohort of participants with varying head circumferences.
- Probe Layout Design: Design a target probe layout covering the prefrontal and motor cortices using brain atlas software (e.g., AtlasViewer).
- Helmet Fabrication: Create two sets of headgear: (A) a standard textile cap with modified holes, and (B) a custom 3D-printed ninjaCap, both using the same target layout.
- Position Digitization: After fitting each helmet on a participant, use a 3D digitizer (e.g., photogrammetry) to record the actual 3D positions of all optodes and electrodes.
- Data Acquisition: Conduct a simple block-design experiment (e.g., finger-tapping motor imagery) while recording simultaneous fNIRS and EEG.
- Signal Quality Metrics:
- For fNIRS: Calculate the signal-to-noise ratio (SNR) based on the strength of the hemodynamic response during the task versus rest periods.
- For EEG: Calculate the strength of event-related desynchronization (ERD) in the alpha and beta bands over the motor cortex during the task.
Expected Outcome: The custom 3D-printed helmet is expected to show significantly higher placement accuracy and superior signal quality metrics (higher SNR for fNIRS, stronger ERD for EEG) due to its stable and precise scalp coupling [69].
The Scientist's Toolkit: Essential Research Reagents & Materials
Successful fNIRS-EEG integration relies on a suite of hardware and software tools.
Table 4: Essential Materials for fNIRS-EEG Helmet Integration
| Item Category | Specific Examples | Function & Importance |
|---|---|---|
| Amplifier & Hardware | g.Nautilus, g.HIamp, NIRSport2 [71] | Biosignal amplifiers that can often support both EEG and fNIRS data acquisition, sometimes in a single device. |
| Electrodes & Optodes | g.SCARABEO electrodes, fNIRS optodes [71] | The physical sensors that make contact with the scalp. Active EEG electrodes help improve signal quality in high-density setups. |
| Custom Cap Material | Thermoplastic Polyurethane (TPU) filament [69] | Flexible, durable material for 3D printing custom helmets that offer a balance of rigidity for stability and flexibility for comfort. |
| Design & Atlas Software | AtlasViewer, Blender3D [69] | Software used to design probe layouts on a virtual head model and to translate the 3D design into 2D printable panels. |
| Digitization System | Photogrammetry systems, 3D scanners [69] | Critical for validating the actual placement of sensors on the head against the intended virtual layout, assessing accuracy. |
Signaling Pathways and Experimental Workflow
The logical workflow for designing and using a custom fNIRS-EEG helmet, from conceptualization to data acquisition, can be visualized as a series of stages. The diagram below outlines this process, highlighting the critical decision points and feedback loops for quality control.
Custom fNIRS-EEG Helmet Design Workflow
The neurovascular coupling relationship, which is the fundamental physiological principle that makes combined fNIRS-EEG so powerful, can be modeled as a signaling pathway where neural activity triggers a delayed hemodynamic response.
Neurovascular Coupling: The fNIRS-EEG Link
The integration hurdle of designing a custom helmet for simultaneous fNIRS-EEG recording is non-trivial, with a direct trade-off between cost, placement accuracy, and operational convenience. Modified textile caps offer a low-barrier entry, while 3D-printed custom helmets represent the state-of-the-art for data quality and accuracy, essential for rigorous clinical research and drug development. When framed within a cost-effectiveness analysis versus fMRI, the fNIRS-EEG platform, despite its integration challenges, emerges as a highly versatile and powerful tool. It enables brain imaging in naturalistic settings and with diverse populations, providing a complementary, and in many cases superior, methodological approach for specific research questions in neuroscience and pharmaceutical studies.
Functional magnetic resonance imaging (fMRI), functional near-infrared spectroscopy (fNIRS), and electroencephalography (EEG) represent three pillars of non-invasive neuroimaging, each with distinct technical profiles that determine their cost-effectiveness for specific research applications. The growing complexity of neuroscience questions demands careful selection of neuroimaging tools based on their complementary strengths and limitations. fMRI provides unparalleled spatial resolution for deep brain structures, fNIRS offers a balance of portability and moderate spatial resolution for cortical regions, and EEG delivers millisecond-level temporal precision for capturing neural dynamics [27] [72]. This comparative analysis examines the technical specifications, experimental applications, and cost-benefit considerations of these modalities to guide researchers in selecting optimal imaging approaches for specific study designs and resource constraints.
Each technique captures different aspects of neural activity: fMRI measures blood-oxygen-level-dependent (BOLD) signals reflecting hemodynamic changes, fNIRS detects concentration changes in oxygenated and deoxygenated hemoglobin in surface cortical regions, and EEG records electrical potentials generated by synchronized neuronal firing [27] [72]. Understanding these fundamental measurement principles is crucial for appropriate modality selection and interpretation of resulting data. This review synthesizes current evidence to establish standardized comparison frameworks and protocol recommendations that enhance cross-study comparability while maximizing research cost-efficiency.
Technical Specifications and Measurement Principles
Fundamental Biophysical Basis of Each Modality
Functional Magnetic Resonance Imaging (fMRI) operates on the principle of detecting blood oxygen level-dependent (BOLD) contrasts, providing an indirect measure of neural activity through neurovascular coupling. When neural activity increases in a specific brain region, it triggers a hemodynamic response that delivers oxygenated blood to that area, altering the magnetic properties of blood and creating detectable signals [27]. fMRI offers high spatial resolution (1-3 mm) capable of imaging both cortical and subcortical structures, including deep brain regions like the hippocampus and amygdala [27]. However, this comes with limited temporal resolution (0.33-2 Hz) due to the slow hemodynamic response, which lags 4-6 seconds behind neural activity [27]. The technique requires expensive, immobile equipment and is highly sensitive to motion artifacts, restricting its use to controlled laboratory environments [27].
Functional Near-Infrared Spectroscopy (fNIRS) utilizes near-infrared light (650-950 nm) to measure changes in hemoglobin concentrations in the superficial cortex. By shining light into the brain and measuring its attenuation after passing through tissue, fNIRS can quantify oxygenated (HbO) and deoxygenated hemoglobin (HbR) concentrations based on their distinct absorption spectra [72]. This optical technique provides moderate spatial resolution (1-3 cm) sufficient for locating cortical activation but is limited to monitoring superficial brain regions due to light penetration constraints [27]. fNIRS offers better temporal resolution than fMRI (up to 10 Hz) and exceptional tolerance to motion artifacts, making it suitable for naturalistic settings [27] [72]. Its portability, lower cost, and compatibility with other modalities represent significant advantages for ecological study designs.
Electroencephalography (EEG) measures electrical potentials generated by synchronized postsynaptic activity of cortical pyramidal neurons. When tens of thousands of these neurons fire synchronously with aligned dendritic orientation, they create electrical fields detectable at the scalp surface [72]. EEG provides exceptional temporal resolution (milliseconds) capable of capturing rapid neural oscillations but suffers from limited spatial resolution (2-3 cm) due to signal smearing as electrical currents pass through various tissue layers [72] [50]. The technique categorizes neural oscillations into frequency bands including theta (4-7 Hz), alpha (8-14 Hz), beta (15-25 Hz), and gamma (>25 Hz), each associated with different brain states and functions [72]. While highly portable and cost-effective, EEG is vulnerable to motion artifacts and muscle activity, complicating measurements during physical activities [72].
Comparative Technical Specifications
Table 1: Technical comparison of fMRI, fNIRS, and EEG neuroimaging modalities
| Specification | fMRI | fNIRS | EEG |
|---|---|---|---|
| Spatial Resolution | 1-3 mm [27] | 1-3 cm [27] | 2-3 cm [72] |
| Temporal Resolution | 0.33-2 Hz [27] | Up to 10 Hz [72] | Milliseconds [72] |
| Penetration Depth | Whole brain (cortical & subcortical) [27] | Superficial cortex (1-2 cm) [27] | Cortical surface [72] |
| Portability | No (requires fixed scanner) [27] | Yes [27] | Yes [72] |
| Cost | Very high [27] | Moderate [72] | Low [72] |
| Motion Tolerance | Low [27] | High [27] [72] | Moderate [72] |
| Measured Signal | BOLD response [27] | HbO/HbR concentration [72] | Electrical potentials [72] |
| Primary Applications | Deep brain mapping, precise localization | Naturalistic settings, clinical environments | Temporal dynamics, brain states |
Experimental Protocols and Methodological Applications
Action Observation Network (AON) Paradigms
The Action Observation Network (AON) exemplifies how different neuroimaging modalities capture complementary aspects of neural processes. The AON encompasses brain regions activated during both action execution and observation, including premotor cortex, supplementary motor area, primary motor cortex, and inferior/superior parietal lobules [73] [50]. Research investigating AON typically employs paradigms involving motor execution (ME), motor observation (MO), and motor imagery (MI) to study shared neural mechanisms [50].
fMRI studies have identified consistent AON correlates but often lack ecological validity due to movement restrictions in the scanner environment. Many fMRI studies omit action execution conditions entirely or use simplified movements to minimize motion artifacts [73]. A meta-analysis revealed that only approximately 30% of fMRI studies on AON included an action execution condition, significantly limiting conclusions about true "mirroring" capacity in identified regions [73].
EEG investigates AON activity through mu rhythm desynchronization (8-12 Hz) at central scalp sites during both action observation and execution [73]. However, this measure faces criticism regarding specificity, as desynchronization in this frequency band also appears in frontal and occipital regions during these conditions, potentially reflecting global alpha desynchrony related to attention rather than specific AON activity [73]. The poor spatial resolution of EEG further complicates precise localization of AON components.
fNIRS addresses several limitations of both fMRI and EEG in AON research. Its tolerance for motion artifacts enables inclusion of ecologically valid action execution conditions in naturalistic settings [73] [50]. Simultaneous fNIRS-EEG recordings during motor execution, observation, and imagery have revealed differentiated activation patterns across conditions, with fNIRS identifying activation in left angular gyrus, right supramarginal gyrus, and right superior/inferior parietal lobes [50]. The multimodal approach combines fNIRS's spatial specificity with EEG's temporal precision, offering a more comprehensive characterization of AON dynamics [50].
Semantic Decoding and Mental Imagery Paradigms
Semantic decoding research investigates how different neuroimaging modalities can distinguish between semantic categories (e.g., animals vs. tools) during various mental tasks. These paradigms typically include silent naming, visual imagery, auditory imagery, and tactile imagery tasks [6].
fMRI has demonstrated the most promising results in semantic neural decoding, with whole-brain coverage allowing comprehensive mapping of distributed semantic networks [6]. However, its practical applications are limited by cost, portability constraints, and restrictive scanning environments that limit the range of cognitive tasks that can be studied [6].
Simultaneous EEG-fNIRS recordings provide a viable alternative for semantic brain-computer interfaces [6]. EEG contributes excellent temporal resolution for tracking rapid neural dynamics during semantic processing, while fNIRS offers better spatial localization of hemodynamic responses in cortical regions associated with semantic retrieval and imagery [6]. This combination has proven effective in differentiating between semantic categories during mental imagery tasks, with fNIRS providing the spatial specificity that EEG lacks [6].
Experimental protocols for semantic decoding typically present participants with visual stimuli representing different semantic categories, followed by mental tasks lasting 3-5 seconds [6]. Participants are instructed to minimize movements during these periods to reduce artifacts. The combination of electrophysiological (EEG) and hemodynamic (fNIRS) measures provides complementary information that enhances classification accuracy in semantic decoding applications [6].
Occupational and Naturalistic Research Applications
Occupational workload research demonstrates the practical advantages of fNIRS in real-world settings where traditional neuroimaging modalities face limitations. Studies investigating neural correlates of cognitive load in professionals such as pilots, urban rail transport operators, and office workers have utilized fNIRS to measure prefrontal cortex activation associated with increasing task demands [74].
fNIRS has identified consistent increases in oxygenated hemoglobin (HbO) concentration and functional connectivity in the prefrontal cortex under higher occupational workload conditions [74]. These neural markers provide objective measures of cognitive demand that surpass traditional subjective reports like the NASA Task Load Index [74]. The portability and motion tolerance of fNIRS enable monitoring in realistic work environments, offering insights into how workload accumulates and impacts cognitive performance during actual job tasks [74].
Comparatively, EEG studies in occupational settings face challenges from muscle artifacts and electrical interference common in work environments, while fMRI is completely unsuitable for naturalistic workplace assessment due to immobility requirements [74]. fNIRS strikes an optimal balance between spatial resolution and practicality for ecological research, though standardization of optode placement and signal processing methods remains necessary to enhance cross-study comparability [74].
Multimodal Integration Approaches
fNIRS-EEG Integration
The combination of fNIRS and EEG represents one of the most promising multimodal approaches, leveraging their complementary strengths while mitigating individual limitations. This integration capitalizes on the fact that fNIRS and EEG measure different but related aspects of neural activity: fNIRS captures hemodynamic responses reflecting metabolic demands, while EEG records direct electrical activity with millisecond precision [72]. The integration is facilitated by their compatibility, as neither system produces significant electromagnetic interference with the other [5].
Structured sparse multiset Canonical Correlation Analysis (ssmCCA) has emerged as an effective method for fusing fNIRS and EEG data [50]. This analytical approach identifies brain regions consistently detected by both modalities, enhancing confidence in localized neural activity. For example, during motor execution, observation, and imagery tasks, ssmCCA has consistently identified activation in the left inferior parietal lobe, superior marginal gyrus, and post-central gyrus—key AON regions [50].
Two primary technical approaches exist for fNIRS-EEG integration: separate system synchronization and unified hardware platforms. The former method utilizes specialized software to synchronize data from separate fNIRS and EEG systems, while the latter employs integrated hardware with a unified processor for simultaneous signal acquisition and processing [5]. Integrated systems provide more precise synchronization but require more complex design and implementation [5].
Helmet design represents a critical consideration for fNIRS-EEG integration. Early approaches used elastic caps with integrated electrodes and optodes, but these often resulted in variable optode placement and inconsistent scalp coupling across participants [5]. Recent advancements utilize 3D-printed customized helmets or thermoplastic materials that can be heat-molded to individual head shapes, improving placement consistency and signal quality [5].
Figure 1: fNIRS-EEG Multimodal Integration Pathway. This diagram illustrates the complementary measurement pathways and fusion approaches for combined fNIRS-EEG studies.
fMRI-fNIRS Integration
The combination of fMRI and fNIRS capitalizes on their shared measurement of hemodynamic responses while leveraging their respective spatial and practical advantages. This integration serves two primary purposes: validating fNIRS measurements against the gold-standard spatial resolution of fMRI, and extending fMRI findings to more naturalistic settings through fNIRS [27].
Simultaneous fMRI-fNIRS recordings have demonstrated correlations between the fMRI BOLD signal and fNIRS hemoglobin concentrations, particularly for oxygenated hemoglobin [75]. This validation is crucial for establishing fNIRS as a reliable neuroimaging tool and interpreting its signals in relation to the extensive existing fMRI literature [27] [75].
Integrated fMRI-fNIRS systems require MRI-compatible fNIRS components, including specialized optical fibers and optodes that function within high magnetic fields without interfering with MRI acquisition [75]. Digital trigger synchronization ensures temporal alignment between the two modalities, enabling precise correlation of their respective signals [75].
The complementary nature of this integration allows researchers to leverage fMRI's whole-brain coverage and superior spatial resolution for precise localization, while utilizing fNIRS for follow-up studies in naturalistic environments or for populations unsuitable for MRI scanning [27]. This approach is particularly valuable for clinical applications where portability and tolerance to motion are essential, such as bedside monitoring of patients with neurological disorders [27].
Research Reagent Solutions and Essential Materials
Table 2: Essential research materials and equipment for multimodal neuroimaging studies
| Category | Specific Items | Function & Application | Modality |
|---|---|---|---|
| Headgear Systems | Integrated EEG-fNIRS caps [50] [5] | Simultaneous electrophysiological and hemodynamic measurement | fNIRS-EEG |
| 3D-printed custom helmets [5] | Improved optode placement consistency and scalp coupling | fNIRS-EEG | |
| MRI-compatible optodes & fibers [75] | Safe operation within high magnetic fields | fMRI-fNIRS | |
| Signal Acquisition | Continuous-wave NIRS systems [72] | Measure HbO/HbR concentration changes via modified Beer-Lambert law | fNIRS |
| High-density EEG electrode systems [72] | Capture electrical potentials with optimal spatial sampling | EEG | |
| Digital trigger synchronization modules [75] | Precise temporal alignment across multimodal systems | All | |
| Localization & Registration | 3D magnetic space digitizers [50] | Precisely record optode/electrode positions relative to head landmarks | fNIRS-EEG |
| Anatomical MRI scans | Co-registration of functional data with structural anatomy | All | |
| Software & Analysis | Structured sparse multiset CCA (ssmCCA) [50] | Multimodal data fusion and integrated analysis | fNIRS-EEG |
| Multilayer network analysis tools [59] | Investigate cross-modal connectivity and network topology | fNIRS-EEG | |
| Real-time signal processing platforms [26] | Neurofeedback and brain-computer interface applications | fNIRS-EEG |
Experimental Workflow and Protocol Standardization
Figure 2: Standardized Experimental Workflow for Multimodal Neuroimaging Studies. This diagram outlines a systematic approach from study design through data interpretation.
The comparative analysis of fMRI, fNIRS, and EEG reveals a clear trade-off between spatial resolution, temporal resolution, and ecological validity that must guide modality selection based on specific research questions and resources. fMRI remains unparalleled for precise localization of deep brain structures, EEG excels in capturing neural dynamics with millisecond precision, and fNIRS offers an optimal balance for studying cortical function in naturalistic environments. The growing field of multimodal integration, particularly fNIRS-EEG, demonstrates how combining complementary modalities can overcome individual limitations and provide a more comprehensive understanding of brain function.
Future developments should focus on standardizing experimental protocols, analytical approaches, and reporting standards to enhance cross-study comparability. Technical innovations in hardware integration, signal processing, and real-time analysis will further expand applications in both basic research and clinical settings. The strategic selection and integration of neuroimaging modalities based on their cost-effectiveness profiles will maximize research impact while efficiently utilizing available resources, ultimately advancing our understanding of brain function across diverse populations and contexts.
A Rigorous, Data-Driven Comparison: Performance, Validation, and Clinical Efficacy
Functional Near-Infrared Spectroscopy (fNIRS) has emerged as a promising neuroimaging technology, offering portability, cost-effectiveness, and higher tolerance for movement compared to established modalities. However, as a newer technology, its validation against the current gold standard—functional Magnetic Resonance Imaging (fMRI)—is crucial for scientific and clinical acceptance [76]. Concurrent fMRI-fNIRS studies represent a critical methodological approach where both techniques simultaneously measure brain activity, enabling direct comparison and validation of fNIRS signals [27]. This guide examines the experimental evidence from these multimodal studies, providing researchers and drug development professionals with a objective analysis of fNIRS performance relative to fMRI, framed within a broader cost-effectiveness context that also includes EEG alternatives.
Technical Fundamentals: fMRI and fNIRS Compared
Core Principles and Measurement Focus
Both fMRI and fNIRS measure the hemodynamic response following neural activity but utilize fundamentally different physical principles to achieve this.
fMRI relies on the different magnetic properties of oxygenated hemoglobin (diamagnetic) and deoxygenated hemoglobin (paramagnetic). Using magnetic resonance imaging and radio frequency pulses, it detects the Blood-Oxygen-Level-Dependent (BOLD) signal, which primarily reflects changes in deoxygenated hemoglobin [24] [76].
fNIRS utilizes the differential absorption characteristics of near-infrared light (650-1000 nm) by oxygenated hemoglobin (HbO) and deoxygenated hemoglobin (HbR). By shining NIR light through the scalp and measuring its attenuation, it calculates relative concentration changes in both chromophores [24] [27].
Table 1: Fundamental Technical Specifications of fMRI and fNIRS
| Parameter | fMRI | fNIRS |
|---|---|---|
| Primary Measured Signal | Blood-Oxygen-Level-Dependent (BOLD) | HbO and HbR concentration changes |
| Spatial Resolution | Millimeter-level (high) | 1-3 centimeters (moderate) [27] |
| Temporal Resolution | 0.33-2 Hz (limited by hemodynamics) | Up to 100+ Hz (high) [27] |
| Penetration Depth | Whole brain (including subcortical structures) | Superficial cortex (outer 1-1.5 cm) [24] [27] |
| Portability | No (requires fixed scanner) | Yes (fully portable systems available) [24] |
| Measurement Basis | Magnetic susceptibility of hemoglobin | Optical absorption of hemoglobin [24] |
Complementary Strengths and Limitations
The technical differences create a complementary profile where each technology's strengths mitigate the other's weaknesses.
fMRI Advantages: fMRI provides unparalleled spatial resolution for localizing brain activity throughout the entire brain, including deep structures like the hippocampus and amygdala. It is considered the gold standard for in-vivo brain imaging due to its whole-brain coverage and precise anatomical co-registration [24] [27].
fMRI Limitations: The technology is expensive, immobile, and highly sensitive to motion artifacts. The scanner environment produces loud noise, requires supine positioning, and prohibits metal implants, limiting its use with infants, children, some clinical populations, and in naturalistic settings [24] [76].
fNIRS Advantages: fNIRS offers superior temporal resolution, portability for field studies, relative affordability, and higher tolerance for movement. Its silent operation enables auditory research, and it poses no restrictions for subjects with metal implants [24] [27].
fNIRS Limitations: fNIRS provides lower spatial resolution and cannot access subcortical brain regions. It also lacks inherent anatomical information, requiring additional co-registration methods for precise sensor placement [24].
Key Validation Studies and Experimental Protocols
Spatial Correspondence Studies
Research directly investigating the spatial overlap between fNIRS and fMRI activations provides critical validation evidence.
Motor and Visual Cortex Activation: A 2024 study with 22 healthy adults performing finger tapping and visual checkerboard tasks found promising spatial correspondence. At the group level, fNIRS overlapped with up to 68% of fMRI-activated regions, while within-subject analyses showed an average overlap of 47.25%. The positive predictive value of fNIRS was 51% at the group level and 41.5% for individual analyses, indicating fNIRS can reliably detect activity in superficial cortical regions adjacent to the skull [77].
Working Memory Tasks: A 2017 study validated a novel image reconstruction technique that transforms fNIRS signals from channel-space to voxel-space. During a visual working memory task, both modalities showed similar trends in activation within the fronto-parietal network as memory load increased. Significant voxel-wise correlations were observed across fronto-parieto-temporal cortices, validating fNIRS for cognitive applications beyond simple motor tasks [78].
Methodology for Simultaneous Data Acquisition
Simultaneous fNIRS-fMRI recording requires specific hardware configurations and experimental protocols to ensure data quality and temporal synchronization.
Hardware Configuration: MRI-compatible fNIRS systems use specialized components to function within the high-magnetic-field environment. Optical fibers must be non-magnetic and sufficiently long to connect the headpiece to the external control unit located outside the scanner room. Optodes are constructed from non-ferromagnetic materials, and digital trigger inputs synchronize fNIRS and fMRI data acquisition [79] [80].
Experimental Protocol: A typical simultaneous recording session involves collecting multiple resting-state runs (e.g., 6 minutes each) where participants remain still with eyes closed, alongside task-based paradigms. For example, a block-design finger-tapping task alternates between active and rest periods, generating hemodynamic responses detectable by both modalities [79] [80].
Brain Fingerprinting and Clinical Applications
Individual Identification Validation: A 2023 study demonstrated that fNIRS could achieve 75-98% accuracy in identifying individuals based on their unique functional connectivity patterns ("brain fingerprinting"), approaching the 99.9% accuracy of fMRI when using sufficient data runs and proper spatial coverage. This confirms fNIRS can reliably extract individual neural signatures at the intra-subject level [79].
Clinical Population Applications: Combined fMRI-fNIRS approaches have advanced research in neurological disorders including stroke and Alzheimer's disease. fNIRS's portability enables bedside monitoring of patients alongside the detailed structural and functional insights provided by fMRI, particularly valuable for rehabilitation assessment and tracking neuroplasticity [27] [4].
Quantitative Comparison of fNIRS and fMRI Performance
Table 2: Performance Metrics from Validation Studies
| Study Paradigm | Spatial Correspondence | Correlation Strength | Key Findings |
|---|---|---|---|
| Motor Tasks (finger tapping) | 47-68% overlap with fMRI [77] | Strong correlation in motor cortex [24] | fNIRS reliably detects SMA activation during execution and imagination of movement [24] |
| Visual Working Memory | Front-parietal network activation [78] | Significant voxel-wise correlations [78] | Both modalities show similar load-dependent activation increases [78] |
| Resting-State Connectivity | Functional connectivity patterns [79] | 75-98% classification accuracy for brain fingerprinting [79] | fNIRS can identify individual unique connectivity patterns approaching fMRI accuracy |
| Supplementary Motor Area | Good spatial specificity [24] | High task sensitivity [24] | Validated fNIRS for detecting SMA activation |
Table 3: Cost-Effectiveness Analysis: fMRI vs. fNIRS vs. EEG
| Consideration | fMRI | fNIRS | EEG |
|---|---|---|---|
| Equipment Cost | Very High (>$1M) | Moderate ($50-200K) | Low ($10-100K) [4] |
| Operational Costs | High (specialized facilities, maintenance) | Low (minimal ongoing costs) | Low (minimal ongoing costs) [24] [4] |
| Participant Throughput | Moderate (scheduling constraints) | High (quick setup, mobile) | Very High (instant setup) [24] |
| Spatial Resolution | High (millimeter-level) | Moderate (1-3 cm) | Low (limited spatial precision) [27] [4] |
| Temporal Resolution | Low (0.33-2 Hz) | High (up to 100+ Hz) | Very High (milliseconds) [27] [4] |
| Naturalistic Testing | Limited (scanner environment) | Excellent (portable, movement tolerant) | Excellent (portable, movement tolerant) [27] |
| Clinical Applications | Whole-brain mapping, deep structures | Cortical mapping, bedside monitoring | Epilepsy monitoring, neural dynamics |
The Research Toolkit: Essential Materials and Solutions
Table 4: Essential Research Equipment for Concurrent fMRI-fNIRS Studies
| Equipment Category | Specific Examples | Function & Importance |
|---|---|---|
| fNIRS System | NIRScout, NIRSport with MRI-compatible modules [79] [80] | Provides the core fNIRS measurement capability with hardware safe for MRI environments |
| Optical Probe Setup | 16 sources/32 detectors configuration (760 & 850 nm) [79] | Enables sufficient cortical coverage with appropriate source-detector distances (2.8-3.5 cm) |
| Spatial Registration | 3D digitizer (Fastrak), AtlasViewer software [79] | Critical for co-registering fNIRS optode positions with anatomical MRI data |
| Motion Tracking | Framewise displacement metrics, hybrid motion correction algorithms [79] | Essential for identifying and correcting motion artifacts in both modalities |
| Data Analysis Platforms | SPM12, Homer2, AtlasViewer, in-house MATLAB scripts [79] | Enable preprocessing, statistical analysis, and image reconstruction of both fMRI and fNIRS data |
Signaling Pathways and Neurovascular Coupling
The relationship between fNIRS and fMRI signals stems from their shared basis in neurovascular coupling—the mechanism linking neural activity to subsequent hemodynamic changes.
Concurrent fMRI-fNIRS studies demonstrate strong validation evidence for fNIRS in measuring cortical brain activity. The spatial correspondence between the modalities is substantial, particularly for group-level analyses and in superficial cortical regions. While fNIRS cannot replace fMRI for investigating subcortical structures or when millimeter-level spatial precision is required, it provides a reliable and cost-effective alternative for cortical mapping, especially in populations and settings where fMRI is impractical.
The complementary strengths of these modalities suggest that combined use offers the most powerful approach—leveraging fMRI's spatial precision with fNIRS's temporal resolution, portability, and tolerance for movement. For researchers and drug development professionals, fNIRS represents a validated tool for longitudinal studies, clinical populations, and naturalistic paradigms where traditional fMRI faces limitations, while providing substantial cost advantages for high-throughput or resource-constrained settings.
Understanding the complex structure-function relationships within the human brain represents one of the most significant challenges in modern neuroscience. Non-invasive neuroimaging techniques have become indispensable tools for probing these relationships, with electroencephalography (EEG) and functional near-infrared spectroscopy (fNIRS) emerging as particularly valuable modalities for studying brain network dynamics [12]. While these techniques measure fundamentally different physiological phenomena—electrical activity versus hemodynamic responses—their integration offers a more comprehensive window into brain organization and function than either modality can provide alone [14] [59].
The value of comparing insights from EEG and fNIRS networks becomes particularly evident when framed within a cost-effectiveness analysis that includes functional magnetic resonance imaging (fMRI). Although fMRI provides unparalleled spatial resolution for deep brain structures, its practical limitations include high operational costs, immobility, and sensitivity to motion artifacts [7] [81]. In contrast, EEG and fNIRS systems present more accessible alternatives that enable brain network research in naturalistic settings and with diverse populations [82] [12]. This comparison guide objectively evaluates the performance of EEG and fNIRS for analyzing brain structure-function relationships, supported by experimental data and detailed methodologies from contemporary research.
Fundamental Principles and Technical Specifications
Physiological Basis and Measurement Principles
EEG and fNIRS capture complementary aspects of brain activity through fundamentally different biological mechanisms and physical principles. EEG measures electrical potentials generated by synchronized neuronal activity, primarily from pyramidal cells in the cerebral cortex [82] [83]. These measurements reflect postsynaptic potentials with millisecond-level temporal precision, allowing researchers to track the rapid dynamics of neural communication and network coordination [14] [12].
In contrast, fNIRS relies on neurovascular coupling, the physiological relationship between neural activity and subsequent changes in cerebral blood flow and oxygenation [81]. By emitting near-infrared light (650-950 nm) through the scalp and measuring its attenuation after passing through cerebral tissue, fNIRS quantifies concentration changes in oxygenated hemoglobin (HbO) and deoxygenated hemoglobin (HbR) [7] [81]. This hemodynamic response typically unfolds over 2-6 seconds, providing an indirect measure of neural activity with better spatial specificity than EEG for cortical regions [82].
Technical Comparison and Complementarity
The technical profiles of EEG and fNIRS reveal their complementary strengths and limitations for network neuroscience, particularly when compared to fMRI.
Table 1: Technical Comparison of Neuroimaging Modalities
| Feature | EEG | fNIRS | fMRI |
|---|---|---|---|
| Temporal Resolution | Milliseconds [82] | Seconds (1-10s) [82] | 2-4 seconds [7] |
| Spatial Resolution | Low (centimeter-level) [82] | Moderate (cortical surface) [82] [81] | High (millimeter-level, whole-brain) [7] |
| Depth of Measurement | Cortical surface [82] | Outer cortex (1-2.5 cm) [82] | Whole brain (cortical & subcortical) [7] |
| Portability | High (wearable systems available) [82] [12] | High [7] [81] | Low (requires fixed scanner) [7] |
| Motion Tolerance | Low to moderate [82] | Moderate to high [82] | Low [7] |
| Cost | Generally lower [82] | Moderate [82] | High [7] [81] |
| Primary Signal Source | Electrical potentials from neurons [82] [83] | Hemodynamic response (HbO/HbR) [82] [81] | Blood oxygen level dependent (BOLD) [7] |
This complementary profile enables researchers to address different aspects of brain network organization. EEG captures rapid neural dynamics essential for understanding information transfer timing, while fNIRS provides better spatial localization of sustained cortical activation patterns [59]. When combined, these modalities offer a more complete picture of structure-function relationships than either could provide independently.
Experimental Protocols and Methodologies
Multimodal Data Acquisition and Integration
Simultaneous EEG-fNIRS recording requires careful technical integration to maximize data quality and temporal synchronization. The most common approach involves integrating NIRS probes and EEG electrodes within the same acquisition helmet [12]. Researchers typically use flexible EEG electrode caps as a foundation, creating openings at specific locations for fNIRS probe fixtures [19] [12]. This design approach maintains proper positioning according to the international 10-10 or 10-20 systems while ensuring adequate optode-scalp coupling [19].
Technical synchronization represents a critical methodological consideration. Two primary integration methods exist: separate systems synchronized via computer, and unified processors that simultaneously handle both signal types [12]. While the former offers implementation simplicity, the latter provides more precise microsecond-level synchronization necessary for analyzing neurovascular coupling dynamics [12]. Modern systems often employ external hardware triggers (TTL pulses) or shared clock systems to synchronize acquisition timing across modalities [82].
Network Analysis Approaches
Multimodal network analysis employs both unimodal and integrated approaches to characterize structure-function relationships. In unimodal analyses, EEG functional connectivity is typically assessed using spectral coherence, phase-based measures, or synchronization likelihood in specific frequency bands (theta, alpha, beta, gamma) [59]. fNIRS networks are constructed from correlations between hemodynamic time courses from different cortical regions, often using HbO concentrations due to their superior signal-to-noise ratio [50].
Multilayer network models have emerged as powerful tools for integrating EEG and fNIRS connectivity data [59]. This approach represents each modality as a separate network layer while modeling their interactions, thereby capturing both the rapid electrophysiological dynamics (EEG) and the metabolically sustained hemodynamic patterns (fNIRS) that constitute brain network organization [59]. Studies applying this methodology have demonstrated that it outperforms unimodal analyses, providing a richer characterization of brain function across different states [59].
Table 2: Experimental Findings from Multimodal EEG-fNIRS Studies
| Study Reference | Experimental Paradigm | Key Network Findings | Modality-Specific Contributions |
|---|---|---|---|
| Sci Rep (2023) [50] | Motor execution, observation, imagery | Identified shared AON regions using ssmCCA fusion | EEG: Bilateral central, right frontal & parietal activityfNIRS: Left angular gyrus, right supramarginal gyrus |
| PLoS One (2025) [84] | Visual cognitive processing, intentional memory | Early EEG ERPs differentiated motivation conditions; fNIRS showed distributed engagement | EEG: Parietal & occipital ERP amplitudes at ~300msfNIRS: Variable HbO patterns during decision period |
| Multimodal Network Analysis (2024) [59] | Resting state, motor imagery | Small-world structure across modalities; complementarity in RS vs. tasks | EEG: Faster information transfer timingfNIRS: Sustained neural processes in tasks |
| EFRM (2025) [83] | Representation learning for classification | Learned shared and modality-specific domains improved few-shot classification | Pre-training on 1250 hours from 918 participantsEnabled EEG-only, fNIRS-only, or combined analysis |
Data Fusion Methodologies
Advanced data fusion techniques are essential for extracting complementary information from simultaneous EEG-fNIRS recordings. Structured sparse multiset Canonical Correlation Analysis (ssmCCA) has been successfully applied to identify brain regions consistently activated across both modalities [50]. This method finds linear combinations of EEG and fNIRS features that maximize their correlation while incorporating structural constraints, effectively highlighting neural processes manifesting in both electrical and hemodynamic responses [50].
Other fusion approaches include joint Independent Component Analysis (jICA), canonical correlation analysis (CCA), and machine learning methods that combine feature sets from both modalities [82] [14]. Recent advances in representation learning have introduced models capable of learning both shared and modality-specific domains, enabling effective analysis even with limited labeled data [83]. These methodologies facilitate a more comprehensive understanding of structure-function relationships by leveraging the temporal precision of EEG and the spatial specificity of fNIRS.
Signaling Pathways and Neurovascular Coupling
The relationship between EEG and fNIRS signals is fundamentally governed by neurovascular coupling (NVC)—the biological process that links neural activity to subsequent hemodynamic responses [81] [83]. This coupling represents the critical signaling pathway that connects the electrical activity measured by EEG to the hemodynamic changes detected by fNIRS.
The neurovascular coupling process begins with localized neural activity, typically involving increased firing rates of neurons in specific brain regions [81]. This elevated activity creates increased metabolic demands for oxygen and glucose, triggering a complex signaling cascade involving neurotransmitters (glutamate, GABA) and vasoactive molecules (nitric oxide, prostaglandins) [81]. These signals cause dilation of arterioles in the capillary bed, leading to an increased blood flow that disproportionately exceeds the oxygen extraction, resulting in characteristic changes in hemoglobin concentrations—initial dip in HbO followed by a substantial increase in HbO and decrease in HbR [81].
The temporal relationship between these processes creates the complementary timing profiles observed in EEG and fNIRS signals. EEG captures the initial neural activity with millisecond precision, while fNIRS detects the subsequent hemodynamic response that unfolds over seconds [83]. This temporal disparity is not a limitation but rather an opportunity to study different phases of brain network activity, from rapid electrophysiological events to sustained metabolic engagement.
The Scientist's Toolkit: Research Reagent Solutions
Implementing effective EEG-fNIRS studies requires specific hardware and software solutions optimized for multimodal research. The following table details essential research reagents and their functions in multimodal brain network studies.
Table 3: Essential Research Reagents for Multimodal EEG-fNIRS Studies
| Research Reagent | Function/Purpose | Examples/Specifications |
|---|---|---|
| Integrated EEG-fNIRS Caps | Simultaneous signal acquisition with co-registered positioning | EasyCap with pre-defined fNIRS openings [19] [12], Custom 3D-printed helmets [12] |
| fNIRS Systems | Measure hemodynamic responses via near-infrared light | Continuous wave systems (e.g., Hitachi ETG-4100, NIRScout) [50] [19], Wavelengths: 695±830 nm [50] |
| EEG Systems | Record electrical neural activity | 32-128 channel systems (e.g., ActiCHamp) [19], Sampling rates: 256-1024 Hz [81] |
| Short-Separation Channels | Remove superficial scalp hemodynamics from fNIRS signals | <1 cm source-detector distance [81], Typically 8-12 short channels integrated in array [19] |
| 3D Digitization Systems | Co-register sensor positions with individual anatomy | Fastrak (Polhemus) [50], Precisely locates optodes/electrodes relative to cranial landmarks |
| Synchronization Hardware | Temporal alignment of multimodal data | TTL pulses, Parallel port triggers [82], Shared clock systems between devices |
| Data Fusion Software | Analyze combined EEG-fNIRS datasets | Structured sparse multiset CCA (ssmCCA) [50], Joint ICA, Machine learning approaches [82] [14] |
| Motion Correction Algorithms | Minimize movement artifacts in both modalities | Signal processing techniques for motion artifact reduction [82] [14] |
This toolkit enables researchers to address the specific methodological challenges of multimodal studies. For instance, integrated caps must maintain proper optode-electrode positioning while ensuring adequate scalp coupling, with 3D-printed customized helmets offering potential advantages for improving placement precision across varying head sizes [12]. Similarly, short-separation channels have become increasingly essential for fNIRS studies to distinguish cerebral hemodynamics from superficial scalp blood flow [81].
Comparative Performance Analysis
Spatiotemporal Resolution and Network Characterization
The complementary nature of EEG and fNIRS becomes particularly evident when comparing their performance in characterizing brain networks across temporal and spatial domains. EEG provides unparalleled temporal resolution for tracking rapid network dynamics, with studies demonstrating its sensitivity to millisecond-level changes in functional connectivity during cognitive tasks [59]. This temporal precision enables researchers to track the rapid sequence of information transfer between brain regions, capturing phenomena such as functional connectivity changes in specific frequency bands during motor imagery [59].
In contrast, fNIRS offers superior spatial localization for cortical networks, with studies reporting spatial resolution of 1-3 centimeters—significantly better than EEG's centimeter-level precision [82]. This enhanced spatial capability allows for more accurate mapping of network hubs and better discrimination between adjacent functional regions, particularly in prefrontal and parietal cortices [50] [59]. However, it's important to note that fNIRS remains limited to superficial cortical regions, unlike fMRI which provides whole-brain coverage including subcortical structures [7].
Cost-Effectiveness Analysis
When evaluating cost-effectiveness relative to fMRI, both EEG and fNIRS present significant advantages for certain research scenarios. fMRI systems require substantial capital investment (often exceeding $1 million), high maintenance costs, and dedicated physical space with magnetic shielding [7] [81]. In contrast, commercial EEG systems typically represent 20-30% of this cost, with fNIRS systems positioned at intermediate price points [82]. This cost differential makes multimodal EEG-fNIRS approaches particularly attractive for laboratories with limited budgets or those requiring multiple testing setups.
Beyond equipment costs, operational considerations further enhance the cost-effectiveness profile of EEG-fNIRS solutions. fMRI imposes significant constraints on experimental paradigms due to limited mobility, acoustic noise, and sensitivity to motion artifacts [7]. EEG-fNIRS setups enable research in more naturalistic environments, support longer recording sessions, and accommodate populations typically excluded from fMRI studies (e.g., those with metal implants, claustrophobia, or difficulty remaining still) [82] [12]. These practical advantages expand the research questions that can be addressed while potentially reducing per-participant costs through more efficient data collection.
The comparison of structure-function relationships through EEG and fNIRS networks reveals a complementary landscape where each modality contributes unique and valuable insights. EEG excels in capturing the rapid temporal dynamics of neural communication essential for understanding information transfer timing in brain networks [59]. Meanwhile, fNIRS provides superior spatial localization of sustained cortical activation patterns, offering better characterization of network hubs and their metabolic demands [50] [59].
When evaluated within a cost-effectiveness framework that includes fMRI, multimodal EEG-fNIRS approaches present a compelling alternative for many research scenarios. While fMRI remains unparalleled for whole-brain spatial coverage including subcortical structures, the portability, lower cost, and greater tolerance of movement afforded by EEG-fNIRS systems enable research questions inaccessible to fMRI [7] [82] [12]. This is particularly relevant for studying brain networks in naturalistic contexts, across diverse populations, and in longitudinal designs requiring repeated measurements.
The integration of EEG and fNIRS through advanced fusion methodologies like ssmCCA [50] and multilayer network models [59] demonstrates that the combined approach outperforms unimodal analyses, providing a more comprehensive characterization of brain structure-function relationships. As hardware integration continues to improve and analysis techniques become more sophisticated, multimodal EEG-fNIRS approaches are poised to make increasingly significant contributions to our understanding of brain network organization in health and disease.
In the evolving landscape of neuroscience and drug development, the selection of neuroimaging tools is increasingly guided by a balance of technical capability and cost-effectiveness. Functional magnetic resonance imaging (fMRI) has long been regarded as the gold standard for in-vivo brain imaging due to its exceptional spatial resolution [24]. However, its operational constraints and significant costs have driven researchers to explore practical alternatives for functional brain monitoring. Electroencephalography (EEG) and functional near-infrared spectroscopy (fNIRS) have emerged as prominent non-invasive techniques, each capturing fundamentally different aspects of brain activity with complementary strengths [85] [72]. Where EEG measures the brain's electrical activity with millisecond temporal precision, fNIRS tracks hemodynamic responses reflecting metabolic demand through blood oxygenation changes [85] [86]. This article provides a comprehensive comparison of these modalities, quantifying their unique information content and demonstrating how their integrated use offers a cost-effective solution for comprehensive brain function assessment in research and clinical applications.
Fundamental Principles: Electrical Activity vs. Hemodynamic Response
EEG: Capturing Neural Electrical Dynamics
Electroencephalography (EEG) records electrical potentials generated by synchronized neuronal activity, primarily from cortical pyramidal cells [72]. When tens of thousands of these neurons fire coherently, their post-synaptic potentials summate to produce electrical signals detectable on the scalp [72]. EEG signals are characterized by oscillatory patterns categorized into specific frequency bands: delta (0.5-4 Hz), theta (4-7 Hz), alpha (8-12 Hz), beta (13-30 Hz), and gamma (>30 Hz) [4]. Each frequency band correlates with different brain states, from deep sleep (delta) to active concentration (beta/gamma) [4]. The exceptional temporal resolution of EEG (millisecond scale) enables researchers to track the rapid dynamics of neural processing with precision unmatched by hemodynamic monitoring techniques [85] [72].
fNIRS: Monitoring Metabolic Demand
Functional near-infrared spectroscopy (fNIRS) utilizes the relative transparency of biological tissues to light in the near-infrared spectrum (600-1000 nm) to measure hemodynamic responses associated with neural activity [72] [24]. By emitting light at specific wavelengths and measuring its attenuation after passing through cerebral tissue, fNIRS quantifies concentration changes in oxygenated hemoglobin (HbO) and deoxygenated hemoglobin (HbR) based on their distinct absorption spectra [72]. These hemodynamic changes occur due to the neurovascular coupling mechanism—when neurons become active, they trigger increased blood flow to the region, delivering oxygen and nutrients [72] [4]. This hemodynamic response unfolds over seconds, making fNIRS temporal resolution slower than EEG but providing valuable information about the metabolic aspects of brain function [85].
The Neurovascular Coupling Bridge
Neurovascular coupling forms the fundamental connection between the signals captured by EEG and fNIRS [72]. This physiological mechanism describes the tight relationship between neural electrical activity and subsequent hemodynamic responses [72] [4]. When neurons fire, they create an immediate electrical signature detectable by EEG. This activity increases metabolic demand for oxygen and glucose, triggering a vascular response that delivers oxygenated blood to the active region—precisely what fNIRS measures [72]. This coupling enables the complementary use of both modalities, with EEG capturing the "when" of neural processing and fNIRS providing information about "where" and "how much" metabolic activity occurs [86].
Figure 1: The Neurovascular Coupling Pathway Connecting EEG and fNIRS Signals
Technical Comparison: Quantitative Performance Metrics
Resolution, Sensitivity, and Practical Factors
The technical capabilities of EEG and fNIRS reflect their fundamentally different measurement principles, with complementary strengths that make them suitable for different research scenarios and applications.
Table 1: Technical Specifications of EEG and fNIRS
| Parameter | EEG | fNIRS |
|---|---|---|
| What It Measures | Electrical activity from cortical neurons [85] | Hemodynamic response (HbO, HbR concentration changes) [85] |
| Temporal Resolution | High (milliseconds) [85] [72] | Low (seconds) [85] [72] |
| Spatial Resolution | Low (centimeter-level) [85] | Moderate (better than EEG) [85] [72] |
| Depth of Measurement | Cortical surface [85] | Outer cortex (1-2.5 cm deep) [85] |
| Sensitivity to Motion Artifacts | High [85] | Low to moderate [85] |
| Portability | High (lightweight wireless systems available) [85] | High (wearable formats available) [85] |
| Setup Complexity | Moderate (electrode gel, scalp prep) [85] | Moderate (optode placement, minimal skin contact) [85] |
| Best Use Cases | Fast cognitive tasks, ERP studies, sleep research [85] | Naturalistic studies, child development, motor rehab [85] |
Comprehensive Cost-Benefit Analysis Including fMRI
When evaluating neuroimaging technologies for research and clinical applications, a comprehensive cost-benefit analysis must consider both technical performance and practical implementation factors across the major available modalities.
Table 2: Cost-Effectiveness Comparison of Major Neuroimaging Modalities
| Consideration | EEG | fNIRS | fMRI |
|---|---|---|---|
| Equipment Cost | Generally lower [85] | Generally higher than EEG [85] | Very high [24] |
| Ongoing Costs | Low | Mostly one-time investment [24] | High cost per measurement [24] |
| Temporal Resolution | Milliseconds [85] [72] | Seconds [85] | 1-2 seconds [24] |
| Spatial Resolution | Low [85] | Moderate [85] | High [24] |
| Portability | High [85] [72] | High [85] [72] [24] | None (stationary) [24] |
| Participant Limitations | Few | Few (compatible with implants) [24] | Many (claustrophobia, metal implants) [24] |
| Operational Complexity | Moderate [85] | Moderate [85] | High (specialized expertise) [24] |
| Environment | Controlled lab to real-world [85] | Naturalistic settings, movement possible [85] [24] | Highly controlled lab only [24] |
Experimental Validation: Methodologies and Protocols
Protocol for Dual-Modality Validation Studies
Robust experimental protocols are essential for validating the complementary nature of EEG and fNIRS signals. A standardized approach involves simultaneous recording during carefully designed cognitive tasks that engage specific neural systems, allowing direct comparison of electrical and hemodynamic responses.
Participant Preparation and Setup: Studies typically involve 20-30 participants free from neurological conditions [87]. For simultaneous recording, integrated caps or custom helmets are used that accommodate both EEG electrodes and fNIRS optodes following the international 10-20 system for positioning [85] [12]. Proper optode and electrode placement is verified through 3D digitization or brain mapping software [24]. Synchronization between systems is achieved either through external hardware triggers (TTL pulses) or shared acquisition software with precise timestamping [85] [12].
Task Paradigms: Multiple task conditions are administered to engage different cognitive domains:
- Motor Tasks: Finger-tapping protocols with 15-30 second activity blocks alternating with rest periods [87]. This elicits predictable activation in motor cortex regions.
- Working Memory Tasks: N-back tasks (1-back vs. 2-back) with 20-second task blocks interleaved with 16-second rest periods [87]. These engage prefrontal and parietal regions with varying cognitive load.
- Higher Cognitive Function Tasks: Alternative Uses Tests (AUT) for creativity assessment or mental arithmetic tasks, typically self-paced with 13-second rest periods [87].
Data Acquisition Parameters: EEG data is typically collected at 250-1000 Hz sampling rate, while fNIRS data is acquired at 10-100 Hz depending on the system [85]. Both systems record event markers synchronized to task stimuli presentation for subsequent analysis of temporal relationships between modalities.
Low-Cost System Validation Protocol
Recent research has validated the performance of low-cost, portable fNIRS systems, making the technology more accessible. The validation protocol for these systems involves:
Hardware Specifications: Low-cost fNIRS systems like HEGduino V2 utilize LEDs at specific wavelengths (660 nm, 880 nm) suitable for capturing hemodynamic changes, with detailed component specifications provided for replication [87] [88]. These DIY systems are significantly more affordable than commercial counterparts while maintaining research-grade data quality [87] [88].
Performance Metrics: Validation studies compare the low-cost system's ability to detect significant blood flow variations across different cognitive tasks against established benchmarks [87]. Statistical analyses include paired-sample t-tests to examine differences between task conditions, with effect sizes calculated using Cohen's d [87]. The systems are evaluated for their capability to detect neural activity during increasingly complex tasks, from basic motor actions to higher cognitive functions [87].
Figure 2: Experimental Protocol for Dual-Modality Validation
Integrated Analysis Methods and Performance Metrics
Multimodal Data Fusion Approaches
The integration of EEG and fNIRS data employs sophisticated fusion strategies that leverage the complementary information from both modalities. Three primary methodological categories have emerged for concurrent fNIRS-EEG data analysis [72]:
EEG-Informed fNIRS Analysis: This approach uses the high-temporal resolution EEG data to inform or constrain the analysis of the hemodynamic signals. The electrical activity patterns detected by EEG can help identify precise time windows of interest for analyzing the slower fNIRS responses, improving the specificity of hemodynamic activation detection [72].
fNIRS-Informed EEG Analysis: Conversely, the superior spatial resolution of fNIRS can guide source localization for EEG signals. By using the hemodynamic activation maps as spatial priors, the inverse problem in EEG analysis becomes better constrained, resulting in more accurate identification of neural generators [72].
Parallel fNIRS-EEG Analysis: This method involves independent processing of both modalities followed by integration at the feature or decision level. Feature-level fusion concatenates extracted features from both modalities before classification, while decision-level fusion combines the outputs of separate classifiers [72] [89]. Advanced machine learning techniques, including joint Independent Component Analysis (jICA), canonical correlation analysis (CCA), and deep learning approaches, have shown success in effectively combining these complementary feature sets [85] [89].
Quantitative Performance Improvements
Empirical studies demonstrate significant performance improvements when combining EEG and fNIRS compared to either modality alone across various applications:
Brain-Computer Interface (BCI) Performance: In motor imagery and mental arithmetic tasks, multimodal integration has achieved classification accuracies of 96.74% and 98.42% respectively, substantially outperforming single-modality approaches [89]. One study reported improvements of +31.83% over EEG alone and +15.19% over fNIRS alone using decision fusion strategies [89].
Mental State Detection: For mental stress detection, fusion of fNIRS and EEG signals achieved detection rates of 98%, compared to 91% for fNIRS alone and 95% for EEG alone [89]. Similarly, studies monitoring cognitive workload have demonstrated that combined metrics from both modalities provide more robust indicators of mental state transitions than unimodal approaches [86].
Clinical Assessment Applications: In stroke recovery monitoring, quantitative EEG parameters (Power Ratio Index, Brain Symmetry Index) combined with fNIRS-based connectivity measures have shown enhanced correlation with functional outcomes compared to single-modality assessments [4]. These integrated biomarkers provide more comprehensive insights into neuroplasticity and recovery processes.
Essential Research Reagents and Materials
The implementation of dual-modality EEG-fNIRS research requires specific hardware components and software tools that enable precise data acquisition and integrated analysis.
Table 3: Essential Research Materials for Dual-Modality Studies
| Item Category | Specific Examples | Function & Importance |
|---|---|---|
| EEG Equipment | Electrodes (Ag/AgCl), Amplification systems, EEG caps | Measures electrical activity via scalp potentials [85] [72] |
| fNIRS Components | LED/laser sources (660nm, 880nm), Detectors (photodiodes), Optode holders | Emits and detects NIR light for hemoglobin measurement [87] [72] |
| Integrated Systems | Custom helmets, 3D-printed mounts, Cryogenic thermoplastic sheets | Enables simultaneous positioning of both modalities [12] |
| Synchronization Tools | TTL pulse systems, Shared clock systems, Lab Streaming Layer (LSL) | Ensures temporal alignment of multimodal data [85] [87] |
| Software Platforms | MNE-Python, nin-Py, AtlasViewer, BrainVision Analyzer | Data processing, analysis, and source localization [90] |
| Validation Tools | 3D digitizers, Brain mapping software (AtlasViewer) | Verifies optode/electrode placement and co-registration [24] |
The quantitative comparison of EEG and fNIRS reveals a compelling case for their complementary use in neuroscience research and drug development. While EEG provides unparalleled temporal resolution for tracking rapid neural dynamics, fNIRS offers superior spatial localization of hemodynamic responses with greater resistance to movement artifacts. The integration of these modalities creates a synergistic effect that surpasses the capabilities of either technique alone, providing a more complete picture of brain function by capturing both electrical activity and metabolic demand.
From a cost-effectiveness perspective, the combined EEG-fNIRS approach offers significant advantages over fMRI, particularly for longitudinal studies, naturalistic environments, and populations incompatible with MRI scanning. The development of low-cost, portable systems further enhances accessibility, enabling larger sample sizes and more ecologically valid research designs [87] [88]. For researchers and drug development professionals, this multimodal approach provides a robust methodology for assessing neurophysiological effects of interventions, monitoring disease progression, and developing biomarkers for neurological and psychiatric conditions.
As technological advances continue to improve the integration and analysis of these complementary signals, EEG-fNIRS is poised to become an increasingly valuable tool in the neuroimaging arsenal, offering a practical balance of performance, accessibility, and comprehensive information content for understanding brain function in health and disease.
Within neuroscience research and drug development, selecting an appropriate neuroimaging modality is a critical decision that balances technical capabilities with economic practicality. This choice directly influences the quality of data, the scope of research questions that can be addressed, and the overall sustainability of a research program. Functional Magnetic Resonance Imaging (fMRI), Electroencephalography (EEG), and functional Near-Infrared Spectroscopy (fNIRS) represent the most prominent non-invasive tools for studying human brain function. Framed within the broader context of cost-effectiveness analysis, this guide provides an objective, feature-by-feature comparison of these three technologies. It is designed to assist researchers, scientists, and drug development professionals in making evidence-based decisions by comparing their performance across key technical and economic metrics, supported by experimental data and detailed methodologies.
Technical Performance Comparison
The following tables summarize the core technical and economic attributes of fMRI, EEG, and fNIRS, synthesizing data from recent literature and hardware specifications.
Table 1: Comparison of Key Technical Performance Metrics
| Technical Metric | fMRI | EEG | fNIRS |
|---|---|---|---|
| Spatial Resolution | High (millimeter-level) [7] | Low (centimeters) [12] | Moderate (1-3 cm) [7] |
| Temporal Resolution | Low (0.33-2 Hz, hemodynamic lag) [7] | High (millisecond-level) [12] | Moderate (millisecond to second-level) [19] [7] |
| Depth Penetration | Whole brain (cortical & subcortical) [7] | Superficial (cortical) | Superficial cortical only [7] |
| Portability & Use Case | Not portable; restrictive lab environment [7] | Highly portable; ecological settings [19] [12] | Portable; ecological & clinical settings [12] [7] [91] |
| Tolerance to Motion | Low; highly sensitive to artifacts [7] | Moderate; sensitive to muscle artifacts [12] | High; relatively robust to motion [91] |
| Measured Signal | Blood Oxygenation Level Dependent (BOLD) [7] | Electrical potentials from neuronal firing [12] | Hemodynamic (HbO, HbR) concentration changes [19] [92] |
Table 2: Comparison of Key Economic and Practical Metrics
| Economic/Practical Metric | fMRI | EEG | fNIRS |
|---|---|---|---|
| Equipment Cost | Very High [12] [7] | Low to Moderate [12] | Moderate (cost-effective) [12] [7] |
| Operational Costs | Very High (maintenance, cryogens) | Low | Low |
| Scalability & Access | Limited (few specialized centers) [91] | High (easy to deploy) [12] | High (bedside, naturalistic settings) [12] [7] |
| Participant Throughput | Lower | High | High |
| Test-Retest Reliability | Ranges from poor to fair, varies by metric and region [91] | Variable; higher for resting-state power spectra than for task-evoked potentials [91] | Good to excellent; shown for resting-state, sensory, and cognitive tasks [91] |
Experimental Protocols and Methodologies
To ensure the validity and reproducibility of findings, a clear understanding of standard experimental protocols for each modality is essential. The following sections detail key methodologies cited in comparative studies.
Protocol for a Multimodal EEG-fNIRS Neurofeedback Experiment
This protocol, adapted from a study investigating combined EEG-fNIRS for motor imagery (MI) neurofeedback, highlights how modalities can be integrated [19].
- Objective: To assess the benefits of combining EEG and fNIRS for NF in the context of upper-limb MI, compared to unimodal NF.
- Participant Preparation: Thirty participants are fitted with a custom cap integrating both EEG and fNIRS sensors. EEG electrodes (e.g., 32-channel system) and fNIRS optodes (e.g., 16 sources, 16 detectors) are positioned over the sensorimotor cortices according to the 10-10 international system [19].
- Experimental Task: Participants perform a left-hand motor imagery task. They are presented with a visual feedback interface, typically a one-dimensional gauge or a ball that moves upwards in response to increases in their brain activity level [19].
- Data Acquisition:
- EEG: Recorded from channels over sensorimotor areas (e.g., C3, C4). The key metric is the event-related desynchronization (ERD) in the mu/beta frequency bands.
- fNIRS: Recorded from channels covering the primary motor cortex. The key metrics are changes in oxygenated (HbO) and deoxygenated (HbR) hemoglobin concentrations [19].
- NF Score Calculation: In the combined condition, a single NF score is computed in real-time from features extracted from both the EEG (e.g., ERD power) and fNIRS (e.g., HbO amplitude) signals. This score controls the visual feedback [19].
- Data Analysis: The association between the NF score (under EEG-only, fNIRS-only, and EEG-fNIRS conditions), the neuroimaging modality, and the motor imagery strategy is analyzed, often using statistical tests like repeated-measures ANOVA [19].
Protocol for an fNIRS Clinical Data Analysis Study
This protocol outlines a standard fNIRS experiment for clinical assessment, as used in studies on drug abuse [92].
- Objective: To analyze prefrontal cortex activation differences among individuals abusing different types of drugs (e.g., methamphetamine, heroin, mixed drugs).
- Participant Preparation: Participants are fitted with a high-density fNIRS device (e.g., NIRSIT by OBELAB). The headset is positioned on the forehead to cover prefrontal functional areas including the dorsolateral, ventrolateral, and orbitofrontal cortices (OFC) [92].
- Experimental Paradigm: The experiment follows a block design:
- Resting State: A 5-minute baseline period where participants are asked to remain relaxed and still.
- Task State (Addiction Induction): A 5-minute period involving exposure to drug-related cues or other induction methods to provoke craving. The specific cues are tailored to the participant's drug of abuse [92].
- Data Acquisition: The fNIRS system continuously measures changes in HbO and HbR concentrations across all channels at specific wavelengths (e.g., 760 nm and 850 nm) [92].
- Data Processing:
- Preprocessing: Raw light intensity data is converted to optical density and then to hemoglobin concentrations using the modified Beer-Lambert law. Band-pass filtering is applied to remove physiological noise (e.g., cardiac, respiratory) [92].
- Statistical Analysis: The mean HbO activation during the task is compared to the resting baseline for each channel and functional area. Group-level statistics (e.g., t-tests, ANOVA) are used to compare activation between different drug abuser groups [92].
- Machine Learning: Algorithms like Linear Discriminant Analysis (LDA) and Support Vector Machines (SVM) can be applied to classify the type of drug abuse based on the fNIRS activation patterns [92].
Visualizing Signaling Pathways and Workflows
The following diagrams illustrate the fundamental signaling pathways of each modality and a standardized experimental workflow.
Neural and Hemodynamic Signaling Pathways
Standardized Neuroimaging Experimental Workflow
The Scientist's Toolkit: Essential Research Reagent Solutions
This section details key materials and software solutions essential for conducting neuroimaging experiments, as referenced in the studies.
Table 3: Essential Research Reagents and Materials
| Item | Function/Description | Example Use Case |
|---|---|---|
| EEG-fNIRS Integrated Cap | A custom cap with holders for co-registering EEG electrodes and fNIRS optodes over target brain regions (e.g., sensorimotor cortex). | Ensures precise spatial alignment and stable positioning for multimodal studies [19]. |
| Electrode Gel (EEG) | Conductive gel applied to EEG electrodes to reduce impedance and improve signal quality by facilitating electrical contact with the scalp. | Critical for obtaining high-quality EEG signals in both research and clinical settings. |
| fNIRS Optodes | Sources that emit near-infrared light and detectors that capture light after it has passed through brain tissue. | Key hardware components for measuring hemodynamic responses; specified by wavelength (e.g., 760 & 850 nm) [19] [92]. |
| Real-time Signal Processing Software | Custom software (e.g., developed in Python, MATLAB) for acquiring, processing, and extracting features from EEG/fNIRS signals in real-time. | Enables neurofeedback applications by calculating a NF score and updating the visual display with minimal latency [19]. |
| Visual Feedback Interface | A graphical user interface (GUI) that provides participants with real-time, visual representation of their brain activity (e.g., a moving bar or ball). | Serves as the reinforcement mechanism in neurofeedback training, aiding in self-regulation of brain activity [19]. |
| Data Analysis Pipeline (Software) | A suite of tools for preprocessing (filtering, artifact removal), feature extraction, and statistical analysis (e.g., SPM, FNIRS Soft, MNE-Python, Homer2). | Standard for converting raw data into interpretable results; pipeline choices significantly impact reproducibility [41]. |
The quest to unravel the complexities of brain function has propelled the development of diverse neuroimaging technologies. Functional Magnetic Resonance Imaging (fMRI), functional Near-Infrared Spectroscopy (fNIRS), and Electroencephalography (EEG) stand as three pivotal tools in both clinical neuroscience and drug development research. Each technique offers a unique window into neural activity, with distinct trade-offs in spatial and temporal resolution, operational flexibility, and cost. Framed within a broader thesis on cost-effectiveness, this review objectively compares the efficacy of these modalities, synthesizing current evidence from direct clinical applications in neurological and psychiatric disorders. By integrating quantitative performance data and detailed experimental methodologies, this analysis aims to provide researchers and drug development professionals with a pragmatic framework for selecting the most appropriate and cost-efficient neuroimaging tools for specific clinical research contexts.
Technical and Clinical Performance Comparison
The clinical utility of fMRI, fNIRS, and EEG is determined by their inherent technical capabilities, which directly influence their application across different disorders and settings. The table below provides a structured comparison of their core characteristics and documented performance in key clinical domains.
Table 1: Technical and Clinical Performance Comparison of fMRI, fNIRS, and EEG
| Aspect | fMRI | fNIRS | EEG |
|---|---|---|---|
| Spatial Resolution | High (millimeter-level) [7] | Moderate (1-3 cm), superficial cortex only [7] | Low (poor localization) [22] |
| Temporal Resolution | Low (0.33-2 Hz, hemodynamic lag) [7] | Moderate (typically 2-10 Hz) [8] | High (millisecond-level) [22] |
| Portability & Cost | Low (immobile, high cost) [7] | High (portable, cost-effective) [7] [22] | High (portable, cost-effective) [22] |
| Key Clinical Application: Disorders of Consciousness (DOC) | Gold standard for network mapping; limited bedside use. | 76.92-81.8% accuracy distinguishing MCS from VS/UWS [33] | Not quantified in results, but used for consciousness indexing [33] |
| Key Clinical Application: Motor Recovery & Imagery | Excellent for localization; sensitive to motion artifacts. | Used in hybrid BCI; improves EEG classification accuracy [67] | Foundation for MI-BCI; 84.28% accuracy alone, enhanced with fNIRS fusion [67] |
| Key Clinical Application: Psychiatric Disorders | Whole-brain mapping for biomarker discovery. | Emerging in schizophrenia, depression; portable for therapeutic monitoring. | High temporal resolution for tracking rapid neural dynamics. |
| Robustness to Motion | Low (highly sensitive) [7] | High [7] [67] | Low (susceptible to artifacts) [22] |
The data reveals a clear trade-off between spatial resolution and operational flexibility. fMRI provides unparalleled whole-brain coverage and deep structural imaging, making it the gold standard for precise localization of neural activity and is foundational for mapping large-scale brain networks in psychiatric disorders [7]. However, its high cost, immobility, and sensitivity to motion artifacts limit its use for continuous monitoring or studies involving naturalistic movement.
fNIRS occupies a unique middle ground, measuring hemodynamic activity like fMRI but with superior portability and robustness to motion. Its moderate spatial resolution is sufficient for mapping cortical regions, and its cost-effectiveness enables broader deployment. Crucially, as shown in Table 1, it has demonstrated high classification accuracy (~77-82%) in distinguishing minimally conscious state (MCS) patients from those with unresponsive wakefulness syndrome (VS/UWS), a critical diagnostic challenge in neurology [33]. Furthermore, its integration into hybrid Brain-Computer Interfaces (BCIs) for motor imagery significantly improves the classification performance of systems relying on EEG alone [67].
EEG excels in capturing the brain's rapid electrical activity with millisecond temporal resolution, making it ideal for studying cognitive processes and event-related potentials. Its portability and low cost are significant advantages. However, its low spatial resolution and vulnerability to electrical noise and motion artifacts are notable limitations [22]. In applications like motor imagery BCI, while effective on its own (84.28% accuracy), its performance is consistently enhanced when its features are fused with fNIRS data, leveraging the complementary strengths of both modalities [67].
Detailed Experimental Protocols from Key Studies
fNIRS for Differentiating Disorders of Consciousness (DOC)
A 2025 resting-state study successfully used fNIRS to differentiate patients with Minimally Conscious State (MCS) from those with Unresponsive Wakefulness Syndrome (VS/UWS) [33].
- Participants: The study included 52 DOC patients (26 MCS and 26 VS/UWS) and 49 healthy controls (HCs) [33].
- Data Acquisition: A 5-minute resting-state fNIRS recording was performed using a NirSmart-6000A system with 24 sources and 24 detectors (forming 63 channels) placed according to the international 10/20 system. The system operated at 730 nm and 850 nm with a sampling rate of 11 Hz [33].
- Preprocessing: The first 10 seconds of data were trimmed. Signal quality was assessed using the Coefficient of Variation (CV), with channels exceeding a 20% CV threshold deemed "bad channels." Data were then converted into oxygenated (HbO) and deoxygenated (HbR) hemoglobin concentration changes [33].
- Analysis: Functional connectivity (FC) between all channel pairs was calculated. The study performed whole-brain (channel-to-channel) and network-level analyses (e.g., within auditory, frontoparietal, and default mode networks). FC features were correlated with clinical scores from the Coma Recovery Scale-Revised (CRS-R) [33].
- Classification: A linear support vector machine (SVM) was used to classify MCS vs. VS/UWS based on the most discriminative FC features [33].
Multimodal EEG-fNIRS for Motor Imagery Brain-Computer Interface (MI-BCI)
A study demonstrating the superior classification accuracy of a multimodal approach used the following protocol for left and right-hand motor imagery tasks [67].
- Participants: Eighteen healthy participants were enrolled [67].
- Paradigm: A synchronous dynamic visual guidance paradigm was used to cue participants for grasping movements with the left or right hand [67].
- Simultaneous Data Acquisition: EEG was recorded using a system with 30 electrodes placed according to the international 10-5 system at a 1000 Hz sampling rate. fNIRS was recorded using a system with 36 channels (14 sources, 16 detectors) placed on the motor cortex following the 10-20 system, with wavelengths of 760 nm and 850 nm [67].
- Feature Extraction & Fusion: For EEG, the Common Spatial Pattern (CSP) method was applied to multiple frequency bands to extract features related to event-related desynchronization. For fNIRS, the Modified CSP (MCSP) was applied to HbO and HbR signals. A feature-level fusion strategy was employed, combining the selected features from both modalities [67].
- Feature Selection & Classification: A hybrid Relief and minimum Redundancy Maximum Relevance (mRMR) algorithm was used to select the most relevant features from the large multimodal set. A Support Vector Machine (SVM) classifier was then trained and validated on these fused features [67].
Workflow of a Multimodal EEG-fNIRS Study
The integration of EEG and fNIRS leverages their complementary strengths. The following diagram visualizes a typical workflow for a multimodal experimental study.
The Scientist's Toolkit: Essential Research Reagent Solutions
Successful execution of neuroimaging studies, particularly multimodal ones, relies on a suite of essential tools and software for data acquisition, processing, and analysis.
Table 2: Essential Tools and Software for Neuroimaging Research
| Tool Name | Primary Function | Application Context |
|---|---|---|
| NirSmart-6000A | fNIRS data acquisition [33] | Clinical fNIRS studies (e.g., DOC diagnosis) [33] |
| Homer2 Toolbox | fNIRS data preprocessing & analysis [33] | Converting raw light intensity to HbO/HbR, filtering artifacts [33] |
| NIRS-KIT | fNIRS data analysis [33] | Advanced analysis and visualization of fNIRS data [33] |
| EEG Systems (10-5 placement) | High-density EEG data acquisition [8] | Capturing electrical brain activity with high temporal resolution [8] |
| Common Spatial Pattern (CSP) | EEG feature extraction [67] | Identifying patterns for motor imagery classification in BCI [67] |
| Modified CSP (MCSP) | fNIRS feature extraction [67] | Adapting CSP for hemodynamic signals in motor imagery tasks [67] |
| Support Vector Machine (SVM) | Classification algorithm [67] | Differentiating brain states (e.g., MCS vs. VS/UWS, left vs. right MI) [33] [67] |
| Relief & mRMR Algorithms | Feature selection [67] | Selecting the most relevant features from multimodal data to improve classifier performance [67] |
The evidence confirms that no single neuroimaging modality is universally superior. The choice between fMRI, fNIRS, and EEG is dictated by the specific clinical or research question, prioritizing either spatial precision, temporal resolution, portability, or cost-effectiveness. fMRI remains indispensable for whole-brain, deep-structure mapping. In contrast, fNIRS has emerged as a highly robust and cost-effective tool for bedside monitoring and cortical mapping, demonstrating particular efficacy in classifying states of consciousness and enhancing motor imagery BCIs. EEG provides unmatched temporal resolution for tracking fast neural dynamics. The most powerful and promising approach, however, lies in multimodal integration, particularly of EEG and fNIRS. This synergy leverages their complementary strengths, overcoming individual limitations to provide a more comprehensive picture of brain function, ultimately driving forward both neurological diagnostics and psychiatric drug development.
Conclusion
The choice between fMRI, fNIRS, and EEG is not a matter of identifying a single superior technology, but of strategically aligning their unique cost-effectiveness profiles with specific application needs. fMRI remains unparalleled for whole-brain, high-spatial-resolution mapping but carries the highest cost and lowest ecological validity. EEG provides unmatched temporal resolution for tracking rapid neural dynamics at a low cost, albeit with spatial limitations. fNIRS occupies a crucial middle ground, offering a favorable balance of portability, cost, and hemodynamic-based spatial resolution suitable for naturalistic and clinical settings. The future of neuroimaging lies not in the supremacy of one modality, but in their synergistic integration, as demonstrated by the growing promise of multimodal fNIRS-EEG systems. Future directions should focus on hardware co-development, standardized analytical pipelines, and advanced machine learning for data fusion to further enhance the cost-effectiveness and translational impact of these powerful tools in biomedical and clinical research.
References
- 1. Physiological modeling of the BOLD signal and ... [https://www.sciencedirect.com/science/article/pii/S1053811923004007]
- 2. Biophysical and physiological origins of blood oxygenation ... [https://pmc.ncbi.nlm.nih.gov/articles/PMC3390806/]
- 3. Modeling the relationship between neuronal activity and ... [https://www.nature.com/articles/s41598-023-32618-0]
- 4. Current implications of EEG and fNIRS as functional ... [https://pmc.ncbi.nlm.nih.gov/articles/PMC11629311/]
- 5. A Cross-Disciplinary Review of the fNIRS-EEG Dual ... [https://www.mdpi.com/2076-3425/14/10/1022]
- 6. Simultaneous EEG and fNIRS recordings for semantic ... [https://www.nature.com/articles/s41597-025-04967-0]
- 7. Applications and advances of combined fMRI-fNIRs ... [https://www.frontiersin.org/journals/neurology/articles/10.3389/fneur.2025.1542075/full]
- 8. Comparing structure–function relationships in brain ... [https://www.nature.com/articles/s41598-024-79817-x]
- 9. Comparison of Whole-Head Functional Near-Infrared ... [https://www.sciencedirect.com/science/article/pii/S0887899421001259]
- 10. fNIRS vs EEG: Comparing Non-Invasive Brain Imaging ... [https://imotions.com/blog/learning/research-fundamentals/fnirs-vs-eeg/?srsltid=AfmBOoqEJLzulwxPJbEXBqTOzZf22dAMu2A8Oi5O-woVb8-A4WqYyZDC]
- 11. What is the difference between fMRI, EEG and TD-fNIRS? [https://docs.kernel.com/docs/what-is-the-difference-between-fmri-eeg-and-td-fnirs]
- 12. A Cross-Disciplinary Review of the fNIRS-EEG Dual-Modality ... [https://pmc.ncbi.nlm.nih.gov/articles/PMC11506513/]
- 13. Consumer-Grade Electroencephalogram and Functional ... [https://pmc.ncbi.nlm.nih.gov/articles/PMC10610697/]
- 14. Multimodal fNIRS–EEG sensor fusion: Review of data-driven ... [https://pmc.ncbi.nlm.nih.gov/articles/PMC12592382/]
- 15. Unfolding the real-time neural mechanisms in addiction [https://www.sciencedirect.com/science/article/pii/S2772392522000438]
- 16. fNIRS vs EEG: Comparing Non-Invasive Brain Imaging ... [https://imotions.com/blog/learning/research-fundamentals/fnirs-vs-eeg/?srsltid=AfmBOopDMTMV-NOrSgLK-jM7WldHJX0i1EZhYmW47a-mgaDvFlbWygB2]
- 17. Naturalistic fNIRS assessment reveals decline in executive ... [https://www.nature.com/articles/s41598-025-20844-7]
- 18. A Scoping Review of Functional Near-Infrared ... [https://arxiv.org/html/2411.02650v2]
- 19. Evaluating the effects of multimodal EEG-fNIRS ... [https://pmc.ncbi.nlm.nih.gov/articles/PMC12425317/]
- 20. Integrating EEG and fMRI in naturalistic paradigms [https://pmc.ncbi.nlm.nih.gov/articles/PMC12590575/]
- 21. Simultaneous EEG and fNIRS recordings for semantic ... [https://pmc.ncbi.nlm.nih.gov/articles/PMC11993746/]
- 22. Neurophysiological data augmentation for EEG-fNIRS ... [https://www.sciencedirect.com/science/article/abs/pii/S0169260725000112]
- 23. fNIRS vs EEG: Comparing Non-Invasive Brain Imaging ... [https://imotions.com/blog/learning/research-fundamentals/fnirs-vs-eeg/?srsltid=AfmBOorpFDMFZ9aH3Z3Vy7ypxjj2svqvscvhEwk7Ll8MJ2RlZ7prlJZg]
- 24. Comparison of fNIRS with other neuroimaging modalities [https://www.artinis.com/blogpost-all/comparison-fnirs-vs-fmri]
- 25. fNIRS Brain Imaging Equipment 2025-2033 Trends [https://www.datainsightsmarket.com/reports/fnirs-brain-imaging-equipment-1715135]
- 26. Evaluating the effects of multimodal EEG-fNIRS ... [https://journals.plos.org/plosone/article?id=10.1371/journal.pone.0331177]
- 27. Applications and advances of combined fMRI-fNIRs ... [https://pmc.ncbi.nlm.nih.gov/articles/PMC11958174/]
- 28. fNIRS vs EEG: Comparing Non-Invasive Brain Imaging ... [https://imotions.com/blog/learning/research-fundamentals/fnirs-vs-eeg/?srsltid=AfmBOoo6AtYJzKsq9WJaE1PyA2bNk2KIKVnUSxrLsy__Eks2azADQajz]
- 29. Consumer-Grade Electroencephalogram and Functional ... [https://www.mdpi.com/1424-8220/23/20/8482]
- 30. Estimating Brain Activity with High Spatial and Temporal ... [https://arxiv.org/html/2510.09415v1]
- 31. Within-individual precision mapping of brain networks ... [https://www.sciencedirect.com/science/article/pii/S0896627325006646]
- 32. Within-Individual Precision Mapping of Brain Networks ... [https://pmc.ncbi.nlm.nih.gov/articles/PMC11888310/]
- 33. Functional connectivity in whole-brain and network analysis ... [https://translational-medicine.biomedcentral.com/articles/10.1186/s12967-025-07181-z]
- 34. A deep neural network for adaptive spatial smoothing of ... [https://www.frontiersin.org/journals/neuroimaging/articles/10.3389/fnimg.2025.1554769/full]
- 35. Benchmarking methods for mapping functional connectivity ... [https://www.nature.com/articles/s41592-025-02704-4]
- 36. Reproducibility of fNIRS within Subject for Visual and Motor ... [https://www.sciencedirect.com/science/article/pii/S1053811925004951]
- 37. fNIRS vs EEG: Comparing Non-Invasive Brain Imaging ... [https://imotions.com/blog/learning/research-fundamentals/fnirs-vs-eeg/?srsltid=AfmBOor2a-72WSpnbWoWd1cUB99AyLPfCbMetENBHYU_j6Syx_J5ZLts]
- 38. Enhancing Performance of a Hybrid EEG-fNIRS System ... [https://www.frontiersin.org/journals/human-neuroscience/articles/10.3389/fnhum.2017.00462/full]
- 39. DSI-EEG+fNIRS [https://wearablesensing.com/dsi-eegfnirs/]
- 40. fNIRS+EEG | BrainProducts [https://www.cortivision.com/integrations-fnirs-eeg/]
- 41. fNIRS reproducibility varies with data quality, analysis ... [https://www.nature.com/articles/s42003-025-08412-1]
- 42. Simultaneous EEG-fNIRS reveals how age and feedback ... [https://www.sciencedirect.com/science/article/abs/pii/S0197458016302512]
- 43. The Potential of Functional Near-Infrared Spectroscopy ... [https://pmc.ncbi.nlm.nih.gov/articles/PMC7396619/]
- 44. The Potential of Functional Near-Infrared Spectroscopy ... [https://www.frontiersin.org/journals/neuroscience/articles/10.3389/fnins.2020.00594/full]
- 45. fNIRS-EEG BCIs for Motor Rehabilitation: A Review - PMC [https://pmc.ncbi.nlm.nih.gov/articles/PMC10740927/]
- 46. HEFMI-ICH: a hybrid EEG-fNIRS motor imagery dataset for ... [https://www.nature.com/articles/s41597-025-06100-7]
- 47. fNIRS vs EEG: Comparing Non-Invasive Brain Imaging ... [https://imotions.com/blog/learning/research-fundamentals/fnirs-vs-eeg/?srsltid=AfmBOoq_QibDn5pTNDnm0T4b0QudwLqtLOEJ6jb6cv-TzFTXKwNsvNuQ]
- 48. EEG/fNIRS Based Workload Classification Using ... [https://www.mdpi.com/1424-8220/22/19/7623]
- 49. Bimodal EEG-fNIRS in Neuroergonomics. Current Evidence ... [https://pmc.ncbi.nlm.nih.gov/articles/PMC10790898/]
- 50. Simultaneous multimodal fNIRS-EEG recordings reveal ... [https://www.nature.com/articles/s41598-023-31609-5]
- 51. fNIRS Brain Imaging System Analysis Uncovered [https://www.datainsightsmarket.com/reports/fnirs-brain-imaging-system-1017591]
- 52. Top 8 Neurofeedback Devices For Brain Training [https://www.myndlift.com/post/2026-guide-top-8-neurofeedback-devices-for-brain-training]
- 53. The Best Neurofeedback Device: A Buying Guide [https://www.mendi.io/blogs/brain-health/the-best-neurofeedback-device-a-buying-guide?srsltid=AfmBOoqWTv_Uw6GJMrxAsme6hFXiRvuG5UrUl3Gi3RAH6vlXw9dslIg0]
- 54. Why Brain Wearables Are Making Traditional EEG Labs ... [https://globalrph.com/2025/10/why-brain-wearables-are-making-traditional-eeg-labs-obsolete-in-2025/]
- 55. Why Consumer Neurofeedback Devices Are More Than ... [https://www.embs.org/pulse/articles/why-consumer-neurofeedback-devices-are-more-than-hype-for-brain-health/]
- 56. The Best Home EEG Devices: A Detailed Comparison [https://www.emotiv.com/blogs/news/best-home-eeg-device?srsltid=AfmBOoq9Pu0g4mJnCUYtZ9axqiWCwPou_w9jzbEjdySeSO3qN2T_oDq1]
- 57. Picking Your Brains: Where and How Neuroscience Tools ... [https://www.frontiersin.org/journals/neuroscience/articles/10.3389/fnins.2020.577666/full]
- 58. fNIRS vs EEG: Comparing Non-Invasive Brain Imaging ... [https://imotions.com/blog/learning/research-fundamentals/fnirs-vs-eeg/?srsltid=AfmBOorT5WAN_JAbBSy9JTdJHaGrvI8BTplGBUOq2-rY_yRj_uopVtEV]
- 59. Investigating the interaction between EEG and fNIRS [https://www.sciencedirect.com/science/article/pii/S1877750324002096]
- 60. EEG–fNIRS signal integration for motor imagery ... [https://www.sciencedirect.com/science/article/pii/S2772528625000299]
- 61. fNIRS reproducibility varies with data quality, analysis ... [https://pubmed.ncbi.nlm.nih.gov/40760004/]
- 62. fNIRS vs EEG: Comparing Non-Invasive Brain Imaging ... [https://imotions.com/blog/learning/research-fundamentals/fnirs-vs-eeg/?srsltid=AfmBOorOuB_nVBjxqhx2zztYkS7z38bLpzlKYcvZ3U2DfjSVNb-QqG5J]
- 63. SfNIRS Newsletter March 2025 [https://fnirs.org/sfnirs-newsletter-march-2025/]
- 64. 2025 fNIRS Summer School [https://pureportal.strath.ac.uk/en/activities/2025-fnirs-summer-school/]
- 65. The Society for functional Near Infrared Spectroscopy ... [https://fnirs.org/]
- 66. Multimodal fNIRS-EEG sensor fusion: Review of data- ... [https://pubmed.ncbi.nlm.nih.gov/41211102/]
- 67. A novel strategy for differentiating motor imagination brain ... [https://www.sciencedirect.com/science/article/abs/pii/S1746809424005068]
- 68. fNIRS vs EEG: Comparing Non-Invasive Brain Imaging ... [https://imotions.com/blog/learning/research-fundamentals/fnirs-vs-eeg/?srsltid=AfmBOoqHvjTDh-SR8vwZ81MpJLDk5yZYx1s4SpH1ewFOut13L3OKgA58]
- 69. ninjaCap: a fully customizable and 3D printable headgear for ... [https://pmc.ncbi.nlm.nih.gov/articles/PMC11348010/]
- 70. Simultaneous functional near-infrared spectroscopy and ... [https://pmc.ncbi.nlm.nih.gov/articles/PMC5566595/]
- 71. A Practical Guide for Combined fNIRS & EEG Recordings [https://www.gtec.at/2021/04/12/combined-fnirs-eeg-recordings/?srsltid=AfmBOorXwroYHRnXSApBbDD30ptgtcSC-mUor1rxgkSSOS6tzSnTErbs]
- 72. Concurrent fNIRS and EEG for Brain Function Investigation [https://pmc.ncbi.nlm.nih.gov/articles/PMC9371171/]
- 73. Frontiers | Characterizing the Action-Observation Network Through... [https://www.frontiersin.org/journals/human-neuroscience/articles/10.3389/fnhum.2021.627983/full]
- 74. The application of fNIRS in studies on occupational workload [https://pmc.ncbi.nlm.nih.gov/articles/PMC12053328/]
- 75. - fNIRS | Concurrent NIRS fMRI Recording Measurements... MRI [https://nirxbeta-2015.squarespace.com/fnirs-fmri]
- 76. Functional Magnetic Resonance Imaging and Functional Near ... [https://pmc.ncbi.nlm.nih.gov/articles/PMC5563305/]
- 77. Spatial correspondence of cortical activity measured with ... [https://www.sciencedirect.com/science/article/pii/S1053811924000648]
- 78. Validating an image-based fNIRS approach with fMRI and ... [https://www.sciencedirect.com/science/article/abs/pii/S1053811916307157]
- 79. a simultaneous fNIRS-fMRI study [https://pmc.ncbi.nlm.nih.gov/articles/PMC9896013/]
- 80. fNIRS - fMRI | Concurrent NIRS MRI Recording ... [https://nirx.net/fnirs-fmri]
- 81. Functional Near-Infrared Spectroscopy and Its Clinical ... [https://pmc.ncbi.nlm.nih.gov/articles/PMC7364176/]
- 82. fNIRS vs EEG: Comparing Non-Invasive Brain Imaging ... [https://imotions.com/blog/learning/research-fundamentals/fnirs-vs-eeg/?srsltid=AfmBOoor4ekRHYqOUQy8xKry3yRbsIiem7AIutRsKUzbr3HSauliBDTJ]
- 83. EFRM: A Multimodal EEG–fNIRS Representation-learning ... [https://www.sciencedirect.com/science/article/abs/pii/S0010482525016464]
- 84. Simultaneous EEG-fNIRS study of visual cognitive processing [https://journals.plos.org/plosone/article?id=10.1371/journal.pone.0325017]
- 85. fNIRS vs EEG: Comparing Non-Invasive Brain Imaging ... [https://imotions.com/blog/learning/research-fundamentals/fnirs-vs-eeg/?srsltid=AfmBOoq3Hb-T4muZ7KCgtnTig0vVHCHi4y6ThGOkaDMrkOFXY6e1i_cY]
- 86. The Advantages of Combining fNIRS and EEG for Brain Monitoring... [https://www.artinis.com/blogpost-all/advantages-of-combining-fnirs-and-eeg]
- 87. Validating the reproducibility of a low-cost single-channel ... [https://pmc.ncbi.nlm.nih.gov/articles/PMC11076663/]
- 88. A low-cost, wearable, do-it-yourself functional near-infrared ... [https://www.sciencedirect.com/science/article/pii/S246806722100033X]
- 89. Improved classification performance of EEG-fNIRS ... [https://www.frontiersin.org/journals/human-neuroscience/articles/10.3389/fnhum.2022.973959/full]
- 90. Review of Multimodal Data Acquisition Approaches for... | Preprints.org [https://www.preprints.org/manuscript/202406.0777/v1]
- 91. Reliability of brain metrics derived from a Time-Domain ... [https://www.nature.com/articles/s41598-024-68555-9]
- 92. Prefrontal fNIRS-based clinical data analysis of brain functions ... [https://jbiomedsem.biomedcentral.com/articles/10.1186/s13326-021-00256-y]