Gray Matter Thickness and Behavioral Outcomes: From Neural Correlates to Clinical Applications
This article synthesizes current research on the associations between gray matter thickness/volume and behavioral outcomes, a critical area for neuroscience research and drug development.
Gray Matter Thickness and Behavioral Outcomes: From Neural Correlates to Clinical Applications
Abstract
This article synthesizes current research on the associations between gray matter thickness/volume and behavioral outcomes, a critical area for neuroscience research and drug development. It explores the foundational evidence linking brain structure to behavior across neurological and psychiatric conditions, details the advanced methodologies like FreeSurfer and VBM used for accurate measurement, and addresses key challenges in interpretation and quantification. Furthermore, it examines validation approaches through meta-analyses and the emerging role of computational models, providing a comprehensive resource for researchers and professionals aiming to translate structural brain findings into clinical biomarkers and therapeutic targets.
Mapping the Brain-Behavior Link: Core Principles and Transdiagnostic Evidence
This technical review synthesizes current evidence on neuroplasticity-mediated gray matter (GM) changes following rehabilitative interventions for motor recovery after stroke. Advanced neuroimaging consistently reveals that targeted therapies—including brain-computer interfaces (BCI), surgical interventions, and intensive motor training—elicit structural plasticity in key brain regions, such as the insula, medial orbitofrontal cortex, middle temporal gyrus, and frontal pole. These GM changes correlate with meaningful behavioral improvements in upper extremity function, highlighting the potential of GM metrics as biomarkers for recovery. The findings underscore the necessity of dose-intensive, task-specific rehabilitation to harness the brain's inherent plastic potential and advocate for the integration of multimodal imaging in future clinical trials to refine patient-specific therapeutic strategies.
Stroke remains a leading cause of long-term adult disability, with loss of upper extremity (UE) motor function representing one of its most consequential sequelae [1]. The adult brain, however, retains a significant capacity for functional and structural reorganization—a phenomenon known as neuroplasticity—which provides the fundamental substrate for motor recovery [2]. This recovery process is mediated through diverse mechanisms, including synaptic plasticity, axonal sprouting, and cortical functional reorganization [2].
While initial research focused on functional reorganization, advanced magnetic resonance imaging (MRI) techniques have illuminated the critical role of structural plasticity, particularly changes in gray matter volume (GMV) and cortical thickness, in the recovery process [2]. The density or volume of GM in brain regions closely related to motor function has emerged as a valuable indicator of the response to treatment [2]. This whitepaper examines the evidence for GM changes following post-stroke motor rehabilitation, framing these structural alterations within the context of behavioral outcomes and their implications for drug development and advanced therapeutic interventions.
Gray Matter Alterations Following Specific Interventions
Brain-Computer Interface (BCI) Therapy
A randomized controlled trial investigated the neuroplasticity effects of a UE motor rehabilitation program utilizing BCI therapy on twenty stroke patients [1]. The experimental group, which controlled the BCI system via actual UE motor intention, was compared to a control group that received random feedback (sham-BCI). The study employed a multi-modal neuroimaging approach, using asymmetry indexes derived from electroencephalography (EEG), functional MRI (fMRI), and diffusion tensor imaging (DTI) to quantify changes.
The study found that most patients in the experimental group presented brain activity lateralization to one hemisphere, as measured by EEG and fMRI. In contrast, the control group primarily showed less pronounced bilateral activity patterns [1]. These findings suggest that a BCI intervention can elicit more pronounced neuroplasticity-related lateralizations than a sham-BCI therapy, which could serve as future biomarkers for patient selection and intervention efficacy.
Surgical Intervention vs. Botulinum Toxin A
A randomized clinical trial compared GMV changes in patients with post-stroke upper limb spasticity undergoing either surgical intervention or treatment with Botulinum Toxin A (BoNT-A) [2]. The surgical group underwent single-event multilevel surgery, combining soft tissue procedures, selective neurectomies, and bone procedures.
At the six-month follow-up, structural MRI analysis revealed significant GM changes in the surgery group but not in the BoNT-A group. Specifically, the surgery group demonstrated augmented GMV in the hippocampus and gyrus rectus, and increased cortical thickness at the frontal pole, occipital gyrus, and insular cortex [2]. These anatomical changes occurred in key areas related to motor and behavioral adaptation and were significantly correlated with improvements in subjective pain, Ashworth spasticity scale scores, and quality of life measures. This suggests that upper limb surgery may have a neuroprotective or regenerative effect on GM structures.
Longitudinal Changes in Motor Recovery
A longitudinal study employing multimodal MRI tracked eight subcortical ischemic stroke patients with hemiplegia who demonstrated good motor recovery [3]. Scans were performed in the stable post-acute period and again after three months of rehabilitation.
The analysis revealed a significant increase in GMV in the contralesional middle temporal gyrus (MTG) at follow-up, which correlated with improved scores on the Action Research Arm Test (ARAT) [3]. This finding suggests that the MTG is a key area for neuronal activation and functional reconstruction during motor recovery, highlighting the role of contralesional regions in the rehabilitative process.
Table 1: Summary of Gray Matter Changes by Intervention Type
| Intervention | Study Design | Key Gray Matter Findings | Correlated Functional Outcomes |
|---|---|---|---|
| BCI Therapy [1] | Randomized Controlled Trial (N=20) | Increased brain activity lateralization (EEG/fMRI) | Not specified |
| Surgical Intervention [2] | Randomized Controlled Trial (N=15 surgery, 15 BoNT-A) | ↑ GMV in hippocampus & gyrus rectus; ↑ Cortical thickness in frontal pole, occipital gyrus, insular cortex | Improved spasticity (Ashworth), pain (VAS), quality of life |
| General Motor Rehabilitation [3] | Longitudinal Study (N=8) | ↑ GMV in contralesional Middle Temporal Gyrus (MTG) | Improved upper limb function (ARAT) |
Dose-Response Relationship in Rehabilitation
The principle that extensive practice drives neuroplasticity is central to neurorehabilitation. A meta-analysis of 34 randomized controlled trials explored the dose-response relationship between therapy time and motor recovery in adults post-stroke [4]. The analysis defined "dose" as the total time scheduled for therapy, a consistently reported, if imperfect, metric.
The meta-analysis concluded that there is a significant positive relationship between the time scheduled for therapy and functional outcomes. Treatment groups that received more therapy demonstrated greater improvement than control groups that received less, with a pooled effect size of g = 0.35 (95% CI = [0.26, 0.45]) [4]. Furthermore, meta-regression analyses confirmed that increased time scheduled for therapy was a significant predictor of improvement, even when controlling for time post-stroke. This provides robust evidence that large doses of therapy are crucial for inducing the neuroplastic changes that underlie behavioral recovery.
Methodologies for Experimental Investigation
Neuroimaging and Data Analysis
Structural MRI Acquisition and Processing: T1-weighted images are acquired using 3T MRI scanners. GMV is typically analyzed using automated pipelines like FreeSurfer or voxel-based morphometry (VBM) in SPM [2] [3]. Key steps include:
- Tissue Segmentation: Differentiating gray matter, white matter, and cerebrospinal fluid.
- Spatial Normalization: Registering individual brains to a standard template (e.g., MNI space).
- Modulation: Preserving the absolute volume of tissue after spatial normalization.
- Smoothing: Applying a Gaussian kernel to reduce anatomical noise and improve statistical power.
Diffusion Tensor Imaging (DTI): DTI assesses white matter integrity, often complementary to GM studies. Preprocessing, including correction for eddy currents and head motion, is performed using tools like FSL or PANDA. Tract-based spatial statistics (TBSS) is then used for voxel-wise analysis of fractional anisotropy (FA) and other diffusivity metrics [1] [3].
Functional Connectivity (FC) Analysis: Resting-state fMRI data is preprocessed (motion correction, normalization, smoothing). The CONN toolbox is commonly used for seed-to-voxel or ROI-to-ROI analysis. Time courses from seed regions are correlated with all other brain voxels to map functional networks. Changes in FC between motor-related regions are examined longitudinally [3].
Computational Modeling of Neuroplasticity
Computational models provide a framework for understanding post-stroke plasticity and triaging potential therapies. Norman et al. developed a neural network model of corticospinal plasticity controlling unilateral finger extension [5].
- Architecture: The model consists of corticospinal (CS) neurons connected to a motoneuronal (MN) pool. Each connection has a fixed weight, with distributions reflecting physiological reality (e.g., 9:1 contralateral-to-ipsilateral neuron ratio).
- Learning: The network employs a reinforcement learning rule, using generated finger torque as a scalar teaching signal. Stochastic variation in neuronal firing drives exploration and learning.
- Application: After simulating a stroke that damages contralateral motor cortex, the model tested standard training versus targeted neuroplasticity (TNP) protocols. Interdigitating standard training with trials that provided feedback from targeted neuronal populations restored lateralized activation and improved torque recovery [5].
Diagram 1: BCI therapy workflow
Diagram 2: VBM analysis pipeline
The Scientist's Toolkit: Research Reagent Solutions
Table 2: Essential Materials and Tools for Investigating Post-Stroke GM Plasticity
| Tool/Reagent | Function/Application | Specific Examples / Notes |
|---|---|---|
| 3T MRI Scanner | High-resolution structural (T1) and functional (rs-fMRI, DTI) data acquisition. | Philips Ingenia, Siemens Skyra, GE Discovery [3]. |
| FreeSurfer Software Suite | Automated cortical reconstruction and subcortical volumetric segmentation. | Used for quantifying cortical thickness and GMV across pre-defined ROIs [6]. |
| Statistical Parametric Mapping (SPM) | Voxel-based morphometry (VBM) for whole-brain, voxel-wise analysis of GM differences. | Often used with the VBM toolkit [3]. |
| CONN Functional Connectivity Toolbox | Integration with SPM for preprocessing and analysis of resting-state fMRI data. | Enables seed-to-voxel and ROI-to-ROI functional connectivity analysis [3]. |
| FMRIB Software Library (FSL) | A comprehensive library of MRI analysis tools, including TBSS for DTI analysis. | Critical for white matter integrity assessment alongside GM studies [3]. |
| Brain-Computer Interface System | Translates motor-related brain signals into control of external devices for closed-loop therapy. | Experimental group uses motor intention; control group may use sham feedback [1]. |
| Clinical Outcome Measures | Standardized scales to correlate GM changes with behavioral recovery. | Fugl-Meyer Assessment (FMA), Action Research Arm Test (ARAT), Ashworth Spasticity Scale [2] [3]. |
Discussion and Synthesis
The convergence of evidence from clinical trials and neuroimaging studies solidifies the role of experience-dependent structural neuroplasticity in post-stroke motor recovery. The findings indicate that successful interventions drive GM changes in a network of regions critical for motor control, sensory integration, and cognitive processing, including the insula, medial orbitofrontal cortex, and middle temporal gyrus [1] [2] [3]. These structural changes are not merely epiphenomena but are meaningfully correlated with objective improvements in motor function, spasticity, pain, and quality of life [2].
The dose-response relationship underscores that the volume of specific practice is a critical factor in inducing these plastic changes [4]. This aligns with neurophysiological models and suggests that the efficacy of any intervention, whether a novel BCI system or a pharmacological agent, may depend on its ability to facilitate and be coupled with high-intensity, task-oriented practice. Furthermore, the distinction between different interventions—such as the superior GM outcomes with surgery compared to BoNT-A in chronic spasticity—highlights that the nature of the intervention determines the pattern and extent of neural remodeling [2].
For researchers and drug development professionals, these findings have profound implications. GMV and cortical thickness represent quantifiable, intermediate biomarkers that could significantly accelerate the development of new therapeutics. They offer a more sensitive and proximal measure of efficacy than traditional functional scales alone, potentially reducing the cost and duration of clinical trials. Future research should focus on standardizing imaging protocols across sites, employing rigorous cross-validation strategies to ensure reliability [6], and leveraging computational models to predict and optimize the effects of targeted neuroplasticity protocols [5].
The study of substance use disorders (SUDs) has traditionally followed a diagnostic-specific approach, focusing on the neurological impacts of individual substances. However, emerging neuroimaging evidence reveals that despite different pharmacological mechanisms, chronic use of various drugs of abuse leads to common alterations in brain structure, suggesting a shared neurobiological foundation across dependencies. This transdiagnostic framework posits that these common gray matter correlates underpin core behavioral features of addiction, such as impaired cognitive control, heightened reward sensitivity, and compulsive drug-seeking behaviors. Understanding these shared neural substrates is crucial for developing targeted interventions that address the common core of addiction rather than its substance-specific manifestations. This whitepaper synthesizes evidence from structural neuroimaging studies to delineate the consistent gray matter alterations across substance dependencies and their implications for research and therapeutic development.
Convergent Gray Matter Alterations Across Substance Classes
Meta-analyses of voxel-based morphometry (VBM) studies across multiple substance classes have identified a consistent pattern of gray matter volume (GMV) reductions in specific cortical and subcortical regions, regardless of the primary substance of abuse.
Core Affected Brain Regions
Table 1: Convergent Gray Matter Reductions Across Substance Use Disorders
| Brain Region | Associated Functional Networks | Behavioral/Cognitive Correlates | Substances Involved |
|---|---|---|---|
| Anterior Cingulate Cortex (ACC) | Salience Network, Executive Control Network | Impaired cognitive control, error monitoring, decision-making | Alcohol, nicotine, cocaine, methamphetamine, opioids, cannabis [7] [8] |
| Medial Frontal/Ventromedial Prefrontal Cortex | Default Mode Network, Executive Control Network | Altered reward valuation, compromised decision-making | Alcohol, nicotine, stimulants, opioids, cannabis [8] |
| Insula | Salience Network | Interoceptive awareness, drug craving, urge to use | Alcohol, nicotine, cocaine, methamphetamine, opioids [7] [9] [8] |
| Prefrontal Cortex | Executive Control Network | Reduced inhibitory control, impaired working memory | Cocaine, methamphetamine, alcohol, nicotine [10] [11] |
| Thalamus | Thalamocortical Circuits | Sensory integration, cognitive deficits | Alcohol, tobacco, cocaine [7] |
| Striatum (Putamen) | Cortico-Striato-Thalamo-Cortical Loops | Habit formation, motor coordination | Stimulants, alcohol, nicotine [7] |
These convergent findings suggest that substance use disorders share a common neuroanatomical signature centered on brain regions critical for cognitive control, emotional regulation, interoceptive awareness, and reward processing [8]. The consistency of these alterations across pharmacologically distinct substances indicates they may represent core pathophysiological mechanisms of addiction rather than substance-specific neurotoxic effects.
Divergent and Substance-Specific Alterations
While convergence exists, important variations are noted across substances and use patterns:
- Cocaine use disorder specifically associates with decreased GMV in dorsal anterior cingulate and ventromedial prefrontal cortex compared to both healthy controls and individuals with gambling disorder [10]
- Stimulant users occasionally show volume increases in striatal regions (putamen), potentially reflecting compensatory neural processes or neuroinflammatory mechanisms [11]
- Alcohol use disorder demonstrates more extensive GMV reductions including in the amygdala, hippocampus, and cerebellum beyond the core regions [7]
- Polysubstance use produces morphological alterations that are not simply additive but may involve complex interactions between substances [11]
Methodological Approaches and Experimental Protocols
Voxel-Based Morphometry (VBM) Protocol
Table 2: Essential Research Reagents and Tools for Structural Neuroimaging Studies
| Research Tool Category | Specific Examples | Primary Function |
|---|---|---|
| MRI Acquisition Sequences | T1-weighted MPRAGE, T1-weighted FSPGR | High-resolution structural imaging |
| Preprocessing Software | SPM, FSL, FreeSurfer, DARTEL algorithm | Image normalization, segmentation, registration |
| Analytical Tools | VBM toolbox, GingerALE, SPM12 | Statistical analysis, coordinate-based meta-analysis |
| Brain Atlases | Harvard-Oxford Cortical/Subcortical Atlas, Juelich Histological Atlas | Anatomical reference for region identification |
| Quality Assessment Tools | MATLAB-based scripts, visual inspection protocols | Data quality control, motion artifact detection |
The standard VBM protocol for identifying structural correlates of SUDs involves:
Participant Selection and Matching: Careful recruitment of individuals with specific SUD diagnoses based on DSM criteria, typically excluding for psychiatric comorbidities, neurological conditions, or other confounds. Groups are matched for age, gender, and education where possible [10].
Image Acquisition: High-resolution T1-weighted structural images are acquired using sequences such as magnetization-prepared rapid acquisition gradient echo (MPRAGE) on 1.5T or 3T MRI scanners [9]. Parameters from published studies include: TR=1900 ms, TE=4.38 ms, flip angle=15°, FOV=256×256×160, 1-mm slice thickness [9].
Image Preprocessing:
- Spatial alignment to standardized stereotactic space (e.g., MNI space)
- Tissue segmentation into gray matter, white matter, and cerebrospinal fluid
- Spatial normalization using diffeomorphic anatomical registration (DARTEL)
- Modulation to preserve tissue volume information
- Spatial smoothing to improve signal-to-noise ratio [9]
Statistical Analysis:
- Whole-brain general linear models comparing GMV between groups
- Correction for multiple comparisons (e.g., family-wise error correction)
- Covariates for age, sex, education, and intracranial volume
- Dimensional analyses relating GMV to behavioral measures (e.g., impulsivity) [10]
Figure 1: Experimental workflow for VBM studies in substance use disorders
Meta-Analytic Approaches
For synthesizing findings across studies, coordinate-based meta-analyses using methods such as anatomical likelihood estimation (ALE) are employed:
Literature Search and Screening: Systematic identification of studies reporting whole-brain VBM analyses comparing substance users to healthy controls [7]
Data Extraction: Recording of stereotactic coordinates (MNI or Talairach space) for significant between-group differences
ALE Algorithm: Testing for anatomical consistency across studies by treating foci as spatial probability distributions rather than single points [7]
Statistical Thresholding: Cluster-level inference with family-wise error correction (p<0.05 FWE) to identify significant convergent regions [7]
Functional Connectivity Analyses: Using meta-analytic connectivity modeling (MACM) to identify networks associated with structurally altered regions [8]
Neurobiological Mechanisms and Functional Implications
Network-Level Impacts
The brain regions consistently showing GMV reductions in SUDs correspond to key nodes in three major brain networks:
Figure 2: Network-level impacts of gray matter alterations in SUDs
The salience network (dACC, anterior insula), responsible for detecting behaviorally relevant stimuli, shows GMV reductions that may contribute to the heightened salience of drug-related cues at the expense of natural rewards [8]. The executive control network (dlPFC, inferior frontal, parietal regions) demonstrates structural deficits that correlate with impaired inhibitory control and decision-making capacities [8]. Alterations in the default mode network (vmPFC, PCC, angular gyrus) may underlie the increased self-referential processing and ruminations about drug use characteristic of addiction [8].
Dopaminergic Mechanisms
The relationship between dopamine receptor availability and gray matter integrity provides a neurochemical basis for structural alterations in SUDs:
- Midbrain D2/D3 receptor availability correlates positively with GMV in striatal, prefrontal, insular, hippocampal, and temporal regions in methamphetamine users [9]
- Lower midbrain D2/D3 BPnd may increase vulnerability to gray matter deficits in mesocorticolimbic circuitry, possibly reflecting greater dopamine-induced toxicity [9]
- Drug craving negatively correlates with GMV in insula, prefrontal cortex, amygdala, temporal cortex, and thalamus [9]
Research Implications and Future Directions
The transdiagnostic framework of shared gray matter correlates across substance dependencies has significant implications for both basic research and therapeutic development:
Methodological Considerations
Future research should address several methodological challenges:
- Polysubstance Use: Most real-world substance users consume multiple drugs, yet research has historically focused on single substances [11]
- Longitudinal Designs: Few studies track structural changes over time, limiting understanding of neurodevelopmental trajectories [11] [12]
- Multimodal Integration: Combining structural with functional, neurochemical, and genetic data provides more comprehensive models [9]
- Dimensional Approaches: Combining categorical diagnoses with dimensional measures (e.g., impulsivity) reveals complementary insights [10]
Therapeutic Applications
Understanding shared neural substrates enables:
- Transdiagnostic Interventions: Treatments targeting common neural systems rather than specific substances
- Biomarker Development: Structural measures as prognostic indicators or treatment response biomarkers
- Prevention Strategies: Identifying at-risk individuals based on structural vulnerabilities
- Novel Pharmacological Targets: Focusing on neurobiological mechanisms common across SUDs
The transdiagnostic framework reveals that despite pharmacological differences, substance use disorders share common gray matter correlates centered on prefrontal, cingulate, and insular regions that form key nodes of large-scale brain networks. These shared structural alterations underlie common behavioral manifestations across SUDs, including impaired cognitive control, heightened drug salience, and increased self-referential processing. Methodological advances in neuroimaging and analytic techniques continue to refine our understanding of these shared neural substrates. Future research emphasizing longitudinal designs, polysubstance use patterns, and multimodal integration will further elucidate the transdiagnostic neurostructural basis of addiction, ultimately informing more effective interventions that target these common mechanisms rather than substance-specific effects.
The quest to identify robust neuroanatomical biomarkers for psychiatric disorders represents a central goal of modern clinical neuroscience. Gray matter (GM) volume, a key measure of brain structure, has been extensively studied across major psychiatric conditions. While early research often highlighted overlapping GM alterations in conditions like major depressive disorder (MDD), bipolar disorder (BD), and schizophrenia (SCZ), increasingly sophisticated analytical approaches are now revealing distinct, disorder-specific neuroanatomical signatures. These signatures are critical for advancing our understanding of disease etiology, improving diagnostic accuracy, and developing targeted treatments [13] [14].
This technical guide synthesizes current evidence on disorder-specific GM alterations, framing these findings within the broader context of brain-behavior relationships. We detail the methodological protocols essential for reliable discovery and validation, and provide a toolkit for researchers and drug development professionals working to translate these structural findings into clinical applications.
Key Gray Matter Alterations Across Major Psychiatric Disorders
Meta-analyses and large-scale comparative studies have begun to delineate a complex landscape of shared and unique GM abnormalities. The table below summarizes the most consistent disorder-specific signatures identified in recent literature.
Table 1: Disorder-Specific Gray Matter Volume Alterations
| Disorder | Key Brain Regions with GM Alterations | Nature of Alteration | Clinical & Behavioral Correlates |
|---|---|---|---|
| Major Depressive Disorder (MDD) | Dorsolateral prefrontal cortex, left hippocampus (tail in first-episode; body in recurrent) [13] [15] | Volume reductions | Episode duration, treatment resistance, memory function [15] |
| Bipolar Disorder (BD) | Prefrontal cortex, temporal lobe, limbic areas (e.g., amygdala) [13] [16] | Volume reductions | Emotion regulation, mania severity [16] |
| Schizophrenia (SCZ) | Prefrontal and temporal cortices, inferior parietal lobule, thalamus, insula [17] [13] [16] | Widespread volume reductions | Psychotic symptoms, cognitive deficits, treatment history [17] |
| Anorexia Nervosa (AN) with Personality Disorders | Thalamus, mid-cingulate cortex, superior parietal-occipital lobule [18] | Volume increases (persists post-weight restoration) | Personality disorder severity, histrionic and borderline traits [18] |
| Conduct Disorder (CD) | Superior temporal sulcus (especially left hemisphere) [19] | Volume reductions (non-linear) | Number of CD symptoms, stronger association in girls [19] |
Transdiagnostic and Subtype Considerations
Beyond disorder-specific patterns, a transdiagnostic perspective reveals common neuroanatomical factors that cut across traditional diagnostic boundaries. A recent study identified four robust neuroanatomical differential factors (ND factors) underlying GM variations in depression, schizophrenia, OCD, bipolar disorder, and ADHD. These factors reconcile individual- and group-level abnormalities and are characterized by dissociable cognitive processes and molecular signatures [14].
Furthermore, illness progression significantly influences GM alterations. In Major Depressive Disorder, for example, first-episode, drug-naïve (FEDN) patients show reduced GMV specifically in the left hippocampal tail, while patients with recurrent MDD (R-MDD) exhibit reductions in the bilateral hippocampal body and increases in the bilateral hippocampal tail. This suggests a progressive hippocampal deterioration with prolonged illness [15].
Methodological Protocols for GM Analysis
Reliable identification of GM signatures depends on rigorous, standardized methodologies. The following section outlines key experimental protocols.
Image Acquisition and Preprocessing
Data Acquisition Protocol:
- Scanner: 3.0 Tesla MRI scanner is standard for high-resolution T1-weighted imaging [18] [17].
- Sequence: Volumetric 3D spoiled gradient echo (SPGR) or MPRAGE sequences are recommended.
- Parameters: Typical parameters include: repetition time (TR) = 8.5 ms, echo time (TE) = 3.4 ms, flip angle = 12°, voxel size = ~1mm³ isotropic, matrix = 256 × 256 [17].
Preprocessing Pipeline (Voxel-Based Morphometry - VBM): VBM is a widely used, unbiased whole-brain technique for quantifying regional GM volume [18].
- Spatial Preprocessing: Tissue segmentation, normalization to a standard template (e.g., MNI space), and modulation to preserve absolute volume.
- Smoothing: Application of a Gaussian smoothing kernel (typically 8-12 mm FWHM) to accommodate normal anatomical variability and meet statistical assumptions [15].
- Quality Control: Visual inspection for artifacts, check for normalization accuracy, and assessment of sample homogeneity.
Preprocessing Pipeline (Surface-Based Analysis): This method provides complementary measures like cortical thickness and surface area [20].
- Surface Reconstruction: Using software like FreeSurfer to reconstruct the gray-white matter boundary and pial surface.
- Registration: Surface inflation and registration to a spherical atlas.
- Parcellation: Automated labeling of cortical regions (e.g., Desikan-Killiany atlas) and extraction of morphometric values [17].
The following diagram illustrates the core workflow for a structural MRI analysis investigating gray matter correlates of psychiatric disorders.
Statistical Analysis and Validation
- Group Comparisons: Use general linear models (GLM) to compare GM volume/thickness between patient and control groups, including age, sex, and total intracranial volume as nuisance covariates [17].
- Correlational Analyses: Examine continuous relationships between GM measures and clinical variables (e.g., symptom severity, illness duration) [18].
- Multiple Comparisons Correction: Control the family-wise error rate (FWE) using random field theory or false discovery rate (FDR) procedures. Permutation testing (e.g., 1000 permutations) is a robust non-parametric alternative [20].
- Validation: Employ jack-knife or split-sample reliability analyses to test the robustness of findings. Normative modeling is increasingly used to quantify individual deviations from a healthy reference population [14] [20].
The Scientist's Toolkit: Essential Research Reagents and Materials
Successful research in this field relies on a suite of well-established tools and resources. The following table details key components of the research pipeline.
Table 2: Essential Reagents and Resources for GM Research
| Category | Item / Software | Primary Function | Key Considerations |
|---|---|---|---|
| Analysis Software | SPM/CAT12 (VBM) | Whole-brain voxel-wise analysis of GM volume | Standardized, automated pipeline; requires careful parameter selection [15] |
| FSL/VBM | Alternative VBM pipeline | Open-source, integrates well with FSL suite | |
| FreeSurfer | Surface-based analysis (cortical thickness, area) | Provides detailed cortical parcellation; computationally intensive [17] | |
| Data & Templates | Standardized Brain Atlases (e.g., MNI) | Spatial normalization template | Ensures results are comparable across studies |
| Allen Human Brain Atlas (AHBA) | Transcriptomic data from postmortem brains | Links neuroimaging findings to gene expression profiles [15] | |
| Clinical Instruments | Structured Clinical Interviews (e.g., SCID) | Diagnostic confirmation | Essential for phenotyping and cohort definition [18] [17] |
| Symptom Severity Scales (e.g., PANSS, HAMD) | Quantification of clinical presentation | Allows for correlation of GM measures with symptom load [17] [15] | |
| Computing Resources | High-Performance Computing (HPC) Cluster | Data processing and analysis | Handles large datasets and computationally demanding procedures (e.g., normative modeling) |
Critical Considerations and Future Directions
Addressing Heterogeneity and Replicability
A significant challenge in identifying disorder-specific GM signatures is the tremendous inter-individual heterogeneity among patients with the same diagnosis [14]. Furthermore, studies searching for brain-behavior correlations in healthy adults have reported poor replicability, with significant findings being rare and often failing to replicate in independent samples [20]. This underscores the need for large, multi-site samples, standardized protocols, and a focus on individual-level data analysis through approaches like normative modeling.
Confounding Factors
- Medication: Long-term antipsychotic treatment (e.g., risperidone, clozapine) is associated with GM reductions in prefrontal, temporal, and parietal regions, which can confound illness-related effects [17].
- Illness Chronicity: As seen in MDD, the stage of illness (first-episode vs. recurrent) is associated with distinct patterns of GM alteration, which must be accounted for in study design and interpretation [15].
- Genetics: Unaffected relatives of individuals with SCZ or BD show GM alterations intermediate between patients and healthy controls, indicating that GM signatures reflect both genetic risk and disease processes [16].
The following diagram outlines a conceptual model for how various factors contribute to the final observed gray matter alterations in a psychiatric disorder, guiding analysis and interpretation.
Toward Precision Medicine
Future research must move beyond group-level comparisons to individualized prediction. The identification of transdiagnostic neuroanatomical factors [14] and the use of normative models to quantify individual deviations are promising steps toward precision psychiatry. Furthermore, integrating GM data with other modalities—such as genetic transcriptomics [15] and functional connectivity [21]—will provide a more comprehensive understanding of the neurobiological pathways underlying psychiatric disorders and ultimately inform the development of novel therapeutics.
Gray matter (GM) integrity serves as a critical determinant of cognitive functioning across the human lifespan. Beyond its well-established role in neurodegenerative pathologies, GM structure exhibits substantial variation in healthy individuals, correlating with cognitive performance and evolving dynamically throughout life. This technical review synthesizes current research on neuroanatomical biomarkers, detailing the trajectories of GM change from adolescence through late adulthood and their associations with cognitive functions such as working memory, executive function, and processing speed. We provide comprehensive methodological protocols for assessing GM morphology, quantitative data from longitudinal studies, and emerging biomarkers that signal risk for cognitive decline. For drug development professionals and neuroscientists, this whitepaper offers a foundational reference for understanding non-pathological GM variation and its implications for cognitive health.
The investigation of gray matter (GM) has expanded beyond the realm of pathological states to encompass the dynamic structural changes that occur throughout normal aging and their relationship with cognitive function. GM volume, cortical thickness, and surface area provide distinct yet complementary indices of brain structural integrity [22]. These neuroanatomical measures are increasingly recognized as sensitive biomarkers that can reveal the neurobiological underpinnings of cognitive performance in healthy populations, serving as critical endpoints for clinical trials and therapeutic development.
Research consistently demonstrates that GM alterations follow heterogeneous trajectories across different brain regions and throughout the lifespan [12]. During adolescence, GM undergoes significant reorganization through synaptic pruning and maturation processes, while in later adulthood, a gradual GM atrophy occurs even in the absence of clinical pathology [23]. Understanding these normative patterns is essential for distinguishing healthy aging from early neurodegenerative processes and for identifying factors that promote cognitive resilience.
Quantitative Data on Gray Matter Changes Across the Lifespan
Trajectories of Gray Matter Change
Table 1: Longitudinal Changes in Gray Matter Volume and Cognition in Healthy Older Adults [23]
| Measurement Domain | Baseline Value (Mean) | 4-Year Follow-up Change | Statistical Significance |
|---|---|---|---|
| Global Gray Matter | Widespread distribution | Significant atrophy | p < 0.05 |
| Frontal Lobe GM | Region-specific volume | Decreased volume | p < 0.05 |
| Temporal Lobe GM | Region-specific volume | Decreased volume | p < 0.05 |
| Subcortical GM | Region-specific volume | Decreased volume | p < 0.05 |
| Memory Performance | Domain-specific score | Non-significant change | p > 0.05 |
| Executive Function | Domain-specific score | Significant decline | p < 0.05 |
| Language Ability | Domain-specific score | Non-significant change | p > 0.05 |
| Visuospatial Skills | Domain-specific score | Non-significant change | p > 0.05 |
Table 2: Adolescent Gray Matter Volume Trajectories and Associated Characteristics [12]
| Developmental Group | Prevalence in Cohort | GMV Trajectory Pattern | Cognitive Performance | Environmental & Genetic Factors |
|---|---|---|---|---|
| Group 1 | 46.1% (711 adolescents) | High baseline GMV, continuously decreasing | Higher neurocognitive performance | - |
| Group 2 | 49.6% (765 adolescents) | Lower baseline GMV, slower decrease rate | Lower neurocognitive performance | Lower parental education, greater environmental burden |
| Group 3 | 4.3% (67 adolescents) | Increasing GMV during adolescence | Lower baseline neurocognitive performance | Associated with specific genetic variation |
Table 3: Cortical Thickness as a Biomarker for Dementia Risk [24]
| Cortical Thickness Measure | Hazard Ratio (All-Cause Dementia) | Hazard Ratio (Alzheimer's Dementia) | Statistical Significance |
|---|---|---|---|
| Per 0.1 mm increase (FHS Cohort) | HR = 0.80 (95% CI: 0.75-0.85) | HR = 0.80 (95% CI: 0.73-0.85) | p < 0.001 |
| Per 0.1 mm increase (UCD-ADRC Cohort) | HR = 0.74 (95% CI: 0.70-0.78) | HR = 0.73 (95% CI: 0.68-0.77) | p < 0.001 |
| Lowest Quartile vs. Upper Three Quartiles (FHS) | HR = 3.38 (95% CI: 2.21-5.16) | HR = 3.35 (95% CI: 2.04-5.50) | p < 0.001 |
| Lowest Quartile vs. Upper Three Quartiles (UCD-ADRC) | HR = 5.09 (95% CI: 3.52-7.37) | HR = 5.89 (95% CI: 3.92-8.85) | p < 0.001 |
Regional Vulnerability to Aging
Neuroimaging studies reveal that GM atrophy in healthy aging follows distinct regional patterns rather than affecting the brain uniformly. The frontal and temporal lobes exhibit the most pronounced age-related GM volume reductions [25]. Within the temporal lobe, the entorhinal cortex shows particular vulnerability, with reduced volume correlating with episodic memory performance [25]. The cerebellum also demonstrates significant GM reductions in older adults, especially in regions implicated in cognitive rather than motor functions [25]. In contrast, the occipital lobe remains relatively preserved throughout normal aging [25].
Recent evidence suggests that these GM changes may be influenced by age-related iron accumulation in deep gray matter structures. The caudate nucleus and putamen show increased iron content with advancing age, which affects diffusion tensor imaging metrics and may contribute to the structural changes observed in these regions [26] [27]. This iron accumulation exhibits a different pattern from the generalized interstitial fluid increase that also occurs with aging, creating competing effects on MR signal intensity [26].
Methodological Approaches for Gray Matter Assessment
Neuroimaging Acquisition Protocols
High-resolution T1-weighted magnetic resonance imaging (MRI) sequences form the foundation for GM morphometric analysis. The standard protocol involves 3D acquisition with isotropic voxels ≤1mm³ to enable precise differentiation of GM, white matter (WM), and cerebrospinal fluid (CSF) compartments. For the Genetics of Brain Structure and Function Study, researchers utilized a Siemens MAGNETOM Trio 3T system with a T1-weighted 3D Turbo-FLASH sequence with the following parameters: TR/TI/TE = 2100/785/3.04 ms, flip angle = 13°, and isotropic voxel size = 0.8 mm [22]. To enhance signal-to-noise ratio and reduce motion artifacts, each subject was scanned seven times consecutively, with these images linearly coregistered and averaged [22].
Advanced techniques for quantifying brain iron content employ multi-echo sequences and field-dependent relaxation rate increase (FDRI) measurements. FDRI estimation requires data collection at multiple field strengths (typically 1.5T and 3.0T) to leverage iron's differential effect on transverse relaxation rates [26]. This approach has been validated against postmortem iron concentration measurements [26].
Analytical Pipelines for Gray Matter Quantification
Voxel-Based Morphometry (VBM)
Voxel-based morphometry provides an automated, quantitative approach to assess GM volume differences across the entire brain [25]. The optimized VBM pipeline involves several sequential steps: (1) spatial normalization of all images to a standardized template space; (2) tissue segmentation to classify voxels as GM, WM, or CSF; (3) modulation to correct for volume changes introduced during spatial normalization; and (4) smoothing with an isotropic Gaussian kernel to enhance the signal-to-noise ratio and accommodate residual anatomical differences [28]. This method enables whole-brain analysis without a priori region-of-interest definitions, facilitating unbiased identification of structural differences associated with aging or cognitive performance [25].
Surface-Based Analysis
Surface-based methods, implemented in software packages such as FreeSurfer, reconstruct the cortical surface to measure thickness, surface area, and folding patterns [22]. The processing pipeline involves: (1) intensity normalization and skull stripping; (2) identification of the gray-white matter boundary; (3) tessellation to create a triangular mesh representing this boundary; (4) deformation of this surface to the pial boundary; and (5) spherical registration to align cortical folding patterns across individuals [22]. Surface-based analysis provides superior visualization of cortical sheet geometry and enables more accurate intersubject registration by aligning homologous regions based on cortical folding rather than absolute spatial location [22].
Table 4: Essential Research Resources for Gray Matter Imaging Studies
| Resource Category | Specific Tools/Measures | Primary Application | Technical Function |
|---|---|---|---|
| Neuroimaging Software | FreeSurfer, FSL, SPM | Image processing and analysis | Cortical reconstruction, volumetric segmentation, spatial normalization |
| Cognitive Assessments | Working memory tasks, Cambridge Gambling Task, WISC-IV | Cognitive phenotyping | Quantification of executive function, memory, decision-making abilities |
| Molecular Assays | IL-6 quantification, Neurofilament Light (NfL) analysis | Biomarker measurement | Assessment of inflammatory markers and neuronal injury biomarkers |
| Genetic Analysis Tools | Genome-wide association studies (GWAS), Epigenome-wide association studies (EWAS) | Genetic and epigenetic profiling | Identification of genetic variants and epigenetic modifications associated with GM traits |
| Statistical Packages | R, SPSS, MATLAB with SPM | Data analysis and modeling | Statistical modeling of brain-behavior relationships, longitudinal analyses |
Key Experimental Protocols in Gray Matter Research
Longitudinal Study of Aging: Protocol from ADNI
The Alzheimer's Disease Neuroimaging Initiative (ADNI) provides a robust protocol for longitudinal assessment of GM changes in healthy older adults. Participants undergo comprehensive assessment at baseline and follow-up timepoints (typically separated by 2-4 years), including: (1) high-resolution T1-weighted MRI using standardized acquisition parameters across multiple sites; (2) cognitive evaluation across multiple domains (memory, executive function, language, visuospatial skills); and (3) clinical assessment to ensure continued cognitive health [23]. Data analysis employs voxel-based morphometry to quantify GM changes over time, with statistical models adjusting for age, sex, education, and intracranial volume [23]. This protocol revealed that despite widespread GM atrophy over four years, cognitive performance remained largely stable except for executive functions, which showed significant decline [23].
Multimodal Biomarker Integration: Inflammatory Markers and GM
A comprehensive protocol for investigating associations between inflammatory biomarkers, GM integrity, and cognitive performance involves: (1) blood collection and processing to quantify peripheral levels of interleukin-6 (IL-6) and neurofilament light polypeptide (NfL) using immunoassays; (2) high-resolution structural MRI to measure GM volume in regions of interest; and (3) administration of standardized cognitive tasks, particularly working memory assessments [29]. Statistical analyses employ multiple regression models to test associations between IL-6, NfL, GM volume, and cognitive performance, followed by path analytic models to test putative functional relationships between these variables [29]. This approach demonstrated that GM volume, but not NfL alone, links age and cognitive performance in healthy older adults [29].
Gray-White Matter Signal Ratio Analysis
A novel protocol for assessing gray-white matter signal ratio (GWR) involves: (1) acquisition of high-resolution T1-weighted images with optimized gray-white matter contrast; (2) intensity normalization across the entire image; (3) sampling of signal intensity values at the gray-white matter boundary; (4) calculation of the ratio between gray matter and white matter signal intensity; and (5) spatial normalization of GWR maps to a standard template for group comparisons [30]. This method has shown superior sensitivity to neurodegenerative changes compared to cortical thickness measurements alone and provides complementary information about tau and amyloid pathology in Alzheimer's disease [30].
Advanced Biomarkers and Emerging Research Directions
Genetic and Environmental Influences on GM Trajectories
Research into individual differences in GM development has revealed significant genetic and environmental contributions to structural brain trajectories. Genome-wide association studies have identified specific genetic variations associated with different GM developmental patterns, particularly in groups showing atypical trajectories such as increasing GM volume during adolescence [12]. Epigenome-wide association studies further indicate that environmental factors may exert their effects on brain structure through DNA methylation changes, with distinct epigenetic profiles observed in individuals with different GM trajectories [12]. These findings highlight the importance of considering both genetic predisposition and environmental exposure when investigating GM variations in healthy populations.
Microstructural Biomarkers Beyond Volume
Advanced imaging techniques are revealing microstructural GM properties that provide additional information beyond macroscopic volume measures. Diffusion tensor imaging of deep GM structures shows age-related changes distinct from those observed in white matter, with increased anisotropy and diffusivity in the caudate nucleus and putamen of older adults [26] [27]. These diffusion changes appear related to age-related iron accumulation in these structures [26]. Similarly, the gray-white matter signal ratio has emerged as a sensitive marker of microstructural integrity that may detect neurodegenerative changes before overt atrophy is evident [30]. These advanced biomarkers offer promising avenues for detecting subtle GM alterations that correlate with cognitive changes in healthy aging.
The investigation of gray matter variations in healthy cognition and aging has moved beyond purely pathological frameworks to reveal complex, dynamic trajectories of brain development and maintenance throughout life. The integration of multimodal biomarkers—including volumetric measures, cortical thickness, microstructural indices, and molecular signatures—provides a comprehensive picture of the factors influencing cognitive health. For drug development professionals, these structural biomarkers offer valuable endpoints for evaluating interventions aimed at promoting cognitive resilience and mitigating age-related decline. Future research directions should focus on personalized trajectories of brain aging, the interaction between genetic predisposition and modifiable environmental factors, and the development of sensitive biomarkers that can detect at-risk profiles long before clinical symptoms emerge.
Measuring the Mind: Tools and Techniques for Quantifying Gray Matter
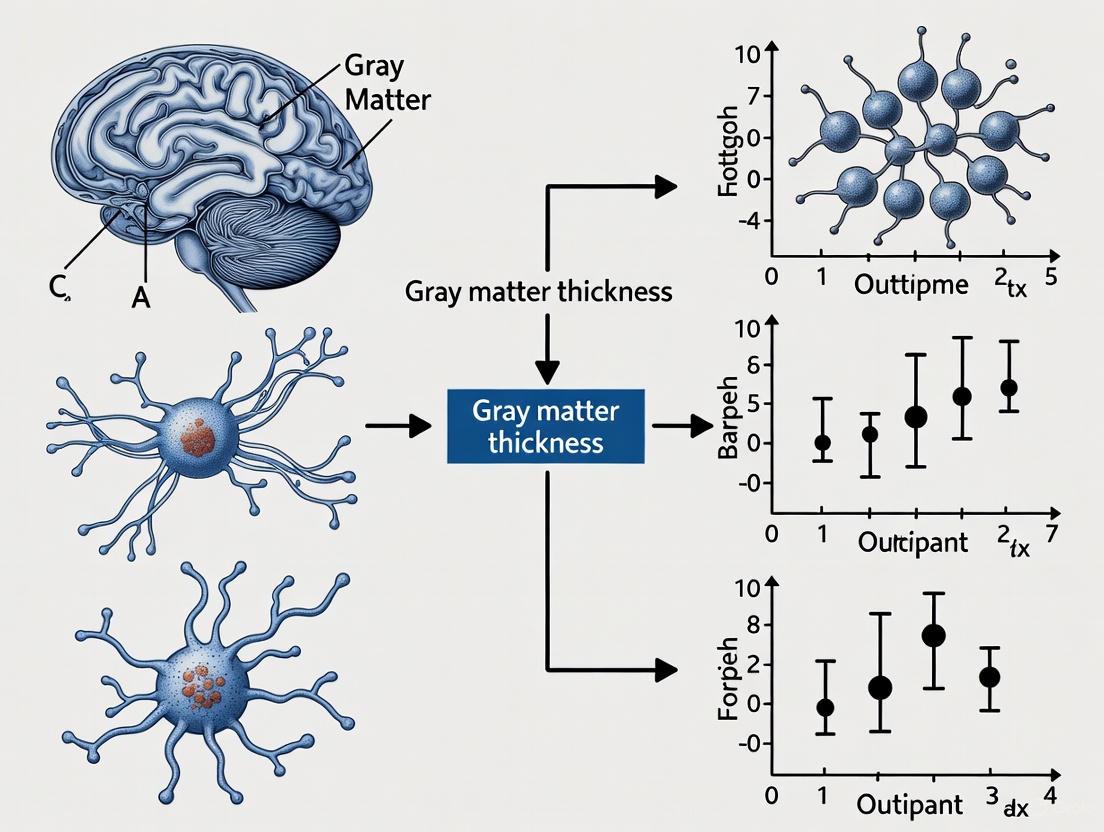
In the study of gray matter thickness and its association with behavioral outcomes, three methodologies have established themselves as gold standards: FreeSurfer, Voxel-Based Morphometry (VBM), and Surface-Based Morphometry (SBM). These tools enable researchers to quantitatively measure structural brain properties, providing critical insights into how variations in brain anatomy correlate with cognitive function, clinical symptoms, and treatment response. Structural magnetic resonance imaging (sMRI) provides high-resolution anatomical information, and postprocessing techniques like VBM and SBM have expanded its utility beyond visual assessment by detecting subtle morphological changes associated with various neurological and psychiatric conditions [31]. Within the context of behavioral research, these tools allow scientists to move beyond simple correlations to understand the neuroanatomical substrates underlying behavior, cognitive decline in neurodegenerative diseases, and treatment effects in clinical trials.
Core Methodological Concepts and Comparative Analysis
Voxel-Based Morphometry (VBM)
Voxel-Based Morphometry is a whole-brain, voxel-wise technique for quantifying regional gray matter volume. It involves spatially normalizing high-resolution MRI scans from all subjects into a common space, segmenting the normalized images into different tissue classes, and then performing statistical tests across groups or conditions at each voxel [31]. The primary outcome of VBM is gray matter volume (GMV), which represents the total volume of gray matter within a specific voxel or region. This measurement is influenced by multiple factors, including cortical thickness, surface area, and cortical folding [32].
Surface-Based Morphometry (SBM) and FreeSurfer
Surface-Based Morphometry, often implemented through the FreeSurfer software package, takes a different approach by modeling the cortical surface. It reconstructs the boundary between white matter and gray matter (the white surface) and the outer boundary of the gray matter (the pial surface) to create a surface model of the cortex [33]. The primary metric derived from SBM is cortical thickness (CT), defined as the distance between these two surfaces at each point on the cortex [32]. Unlike VBM, SBM uses geometry for inter-subject registration, which provides superior matching of homologous cortical regions compared to volumetric techniques [33].
Key Technical Differences and Complementary Strengths
The fundamental difference between these approaches lies in their analytical framework: VBM is a volumetric technique that analyzes the brain in 3D space, while SBM is a surface-based technique that models the cortex in 2.5D. This distinction leads to different strengths and applications in behavioral research.
Table 1: Comparative Analysis of VBM and SBM in Behavioral Research
| Feature | Voxel-Based Morphometry (VBM) | Surface-Based Morphometry (SBM) |
|---|---|---|
| Primary Metrics | Gray Matter Volume (GMV) | Cortical Thickness (CT), Surface Area |
| Analytical Domain | Volumetric (3D space) | Surface-based (2.5D) |
| Registration Approach | Volumetric alignment to template | Geometry-based cortical alignment |
| Sensitivity to Atrophy | Affected by GM changes | Registration invariant to GM atrophy [33] |
| Key Advantage | Comprehensive whole-brain coverage including subcortical structures | Separates thickness from surface area [33] |
| Ideal Behavioral Applications | Subcortical-behavior relationships, medication effects on volume | Cortical-behavior correlations, developmental trajectories |
FreeSurfer implements a comprehensive pipeline for SBM analysis, with recent versions (8.0.0+) incorporating deep learning algorithms like SynthSeg, SynthStrip, and SynthMorph to improve robustness and reduce processing time from approximately 8 hours to about 2 hours per subject on a single CPU [34].
Experimental Protocols and Implementation
Data Acquisition and Quality Control
For reliable VBM and SBM analyses, high-quality 3D T1-weighted magnetization-prepared rapid gradient echo (MPRAGE) sequences are recommended [32]. Multi-echo MPRAGE sequences are particularly advantageous for longitudinal studies due to increased bandwidth, which significantly improves registration accuracy across time points [33]. Resolution should be approximately 1mm isotropic for valid surface reconstruction, though subcortical structures might remain valid at resolutions up to 1.3mm [33].
Essential quality control steps include:
- Verifying proper inclusion of cerebellum in skull-stripped images
- Checking for large defects in white matter surfaces
- Ensuring proper detection of pons and corpus callosum
- Confirming accurate alignment across subjects and time points
FreeSurfer Processing Pipeline
The standard FreeSurfer processing stream (recon-all) involves the following key stages:
- Motion Correction and Normalization: Alignment and intensity normalization
- Skull Stripping: Removal of non-brain tissue (enhanced in v8.0+ with SynthStrip) [34]
- White/Gray Matter Segmentation: Identification of tissue types
- Tessellation and Surface Reconstruction: Creation of white and pial surfaces
- Topological Defect Correction: Automatic correction of surface errors
- Surface Registration: Alignment to common spherical coordinate system
- Parcellation and Statistical Analysis: Labeling of regions and quantitative measurement
For studies requiring manual intervention (e.g., white matter edits), the processing should be restarted at the earliest modified step (-autorecon2-wm for white matter edits, which includes subsequent -autorecon2-pial steps) [33].
Integrated VBM-SBM Analytical Approach
Recent research demonstrates the advantage of combining VBM and SBM for a comprehensive assessment of brain structure. A 2025 study on Alzheimer's disease implemented this integrated approach by:
- Performing both VBM and SBM analyses on 3D T1-MPRAGE sequences
- Identifying regions of interest (ROIs) showing significant group differences
- Extracting CT (from SBM), cortical GMV, and subcortical GMV (from VBM) metrics from these ROIs
- Assessing correlations between these neuroanatomical measures and cognitive performance (MMSE, MoCA scores)
- Building predictive models using individual and combined metrics [32]
This integrated protocol revealed that combining CT and GMV improved prediction of cognitive impairment compared to either measure alone, demonstrating the complementary nature of these methodologies [32].
Diagram 1: Integrated VBM-SBM analytical workflow for behavioral research
Applications in Gray Matter and Behavioral Research
Neurodegenerative Disorders and Cognitive Outcomes
In Alzheimer's disease research, combined VBM-SBM approaches have revealed distinct but complementary atrophy patterns. VBM analyses consistently show GMV reductions in medial temporal lobe structures including the hippocampus, parahippocampal gyrus, and amygdala, while SBM identifies cortical thinning primarily in temporal cortical regions such as the transverse temporal gyrus, superior temporal gyrus, and entorhinal cortex [32]. These structural measures demonstrate significant positive correlations with cognitive performance on MMSE and MoCA assessments, confirming their functional relevance to behavioral outcomes [32].
Multi-Site Studies and Normative Modeling
Large-scale neuroimaging datasets like OpenBHB, which includes >5,000 3D T1 brain MRI scans from healthy controls across >60 centers worldwide, provide resources for creating normative models of brain structure across the lifespan [35]. These models enable researchers to identify individual deviations from typical structural trajectories, which can be correlated with behavioral measures. Such approaches are particularly valuable for distinguishing normal aging from pathological decline in behavioral neurology research.
Methodological Considerations for Behavioral Correlation
When correlating morphological measures with behavioral outcomes, researchers should consider:
- Metric Specificity: Cortical thickness and gray matter volume reflect different neurobiological properties and may correlate with distinct behavioral domains
- Multiple Comparison Correction: Both VBM and SBM require appropriate statistical correction for multiple comparisons across vertices or voxels
- Confounding Factors: Age, sex, and intracranial volume should be included as covariates in behavioral correlation analyses
- Software Consistency: Volumetric and thickness estimates can vary significantly between FreeSurfer versions, operating systems, and hardware configurations [31]
Table 2: Research Reagent Solutions for Gray Matter Morphometry
| Tool/Category | Specific Examples | Primary Function in Behavioral Research |
|---|---|---|
| Segmentation Software | FreeSurfer, AssemblyNet, FastSurfer | Automated volumetric segmentation and surface reconstruction |
| Processing Pipelines | FreeSurfer recon-all, VBM (CAT12/SPM) | Standardized processing of T1-weighted images |
| Normative Modeling | Generalized Additive Models (GAMs) | Establishing reference curves for abnormal atrophy detection |
| Quality Assessment | Visual inspection, Euler number | Identifying processing errors that may confound behavioral correlations |
| Multi-Site Harmonization | Combat, Longitudinal Registration | Minimizing scanner effects in collaborative behavioral studies |
Technical Considerations and Best Practices
Algorithm Selection and Performance
The choice of segmentation algorithm significantly impacts volumetric measurements and subsequent behavioral correlations. Recent evaluations of three segmentation algorithms (AssemblyNet, FastSurfer, and FreeSurfer) demonstrate important performance differences:
- AssemblyNet shows the lowest error rates and highest robustness to magnetic field strength variations (1.5T vs. 3T)
- FastSurfer achieves the highest sensitivity (0.98) in detecting hippocampal atrophy in Alzheimer's patients
- AssemblyNet provides the best specificity (0.95) and highest balanced accuracy (0.91) for atrophy detection [36]
These performance characteristics should guide algorithm selection based on study priorities (sensitivity vs. specificity) in behavioral research contexts.
Longitudinal Analysis and Change Detection
For studies examining how structural changes correlate with behavioral progression:
- Use FreeSurfer's longitudinal stream to reduce intra-subject variability
- Process all time points with the same software version and processing parameters
- Ensure consistent acquisition protocols across longitudinal assessments
- Consider leveraging traveling subject data to quantify scanner-related variability
Hardware and Computational Requirements
Processing requirements for these methodologies include:
- FreeSurfer: Approximately 2 hours per subject (v8.0.0+) on a single CPU with 24GB memory [34]
- Multi-core systems: Enable parallel processing of multiple subjects (approximately N-1 cores for N subjects)
- Storage: Approximately 1GB per processed subject for FreeSurfer output
- Quality control: Essential manual inspection time should be budgeted (5-15 minutes per subject)
Diagram 2: End-to-end workflow for gray matter behavior studies
FreeSurfer, VBM, and SBM provide complementary approaches for investigating gray matter structure in behavioral research. While VBM offers comprehensive whole-brain coverage including subcortical structures, SBM through FreeSurfer provides superior cortical alignment and separates thickness from surface area. The integrated application of these methodologies, as demonstrated in recent neurodegenerative disease research, enhances prediction of cognitive outcomes compared to either approach alone. As these tools continue to evolve with incorporating deep learning algorithms and improved processing pipelines, they offer increasingly robust methods for unraveling the complex relationships between brain structure and behavior in both healthy and clinical populations.
In the study of gray matter morphology, cortical thickness and volume serve as critical in vivo proxies for brain structure, development, and pathology. Research increasingly links these macroscopic properties to behavioral outcomes and clinical conditions, forming a core component of modern neuroscience and drug development research. However, the path from a raw magnetic resonance imaging (MRI) scan to a reliable cortical thickness estimate is complex and relies heavily on the processing pipeline employed. Different software packages utilize distinct algorithms and methodological approaches, leading to variations in thickness estimates that can significantly impact research findings and their interpretation. This technical guide provides an in-depth examination of the predominant processing pipelines for cortical morphology, detailing their methodologies, comparing their outputs, and framing their application within behavioral research to ensure robust and replicable scientific insights.
Core Concepts and Neurobiological Basis
Cortical thickness is fundamentally defined as the distance between the gray-white matter interface (the inner boundary) and the pial surface (the outer boundary) [37]. This macroscopic measure, derived from in vivo MRI, is a proxy for the underlying cytoarchitecture of the cerebral cortex, which is composed of six distinct layers [38]. The relationship between macroscopic thickness and microscopic structure is not merely anatomical; it reflects a functional and structural hierarchical organization [39].
Sensory processing hierarchies, for instance, demonstrate systematic variations in cortical thickness. From primary to higher-order association areas, the cortex exhibits a gradient of increasing thickness, a pattern observed across visual, somatosensory, and auditory modalities in both human and macaque brains [39]. This gradient is mirrored in cytoarchitectural characteristics, with thinner primary sensory areas showing more distinct laminar differentiation and higher neuronal density compared to thicker, less differentiated higher-order areas [39]. Consequently, alterations in cortical thickness, as measured by MRI, are not just structural metrics but are believed to reflect underlying differences in cortical microcircuitry, connectivity, and, ultimately, function. This establishes cortical thickness as a vital biomarker for exploring the association between brain structure and behavioral outcomes.
Several automated software packages are widely used for estimating cortical thickness and volume. The three with large user-based communities are FreeSurfer, CIVET, and CAT [37] [40]. These tools can be broadly categorized into surface-based (FreeSurfer, CIVET) and volume-based (CAT) approaches, which is a primary source of methodological divergence.
Detailed Methodologies and Experimental Protocols
FreeSurfer
FreeSurfer (v6.0) is a surface-based pipeline. Its workflow, executed via the recon-all command, involves several stages [40]:
- Preprocessing: Raw T1-weighted images are affine-registered to the MNI305 template, intensity-normalized, bias-field-corrected, and skull-stripped.
- Tissue Segmentation: White matter voxels are identified based on intensity and neighbor constraints, and the two hemispheres are separated.
- Surface Reconstruction: The boundary of the white matter mass is tiled to create an initial white surface. This surface is refined by following intensity gradients between white matter and gray matter to generate the final gray-white surface. This surface is then expanded outward to fit the pial surface by following the intensity gradient between gray matter and cerebrospinal fluid (CSF).
- Thickness Measurement: Cortical thickness at each vertex is computed as the average of two distances: 1) from a vertex on the gray-white surface to the nearest point on the pial surface, and 2) from the corresponding vertex on the pial surface to the nearest point on the gray-white surface [40]. Specialized versions, like FreeSurfer v5.3-HCP, can integrate T2-weighted images to improve accuracy for specific datasets [40].
CIVET
The CIVET pipeline (v2.1.1) is also a surface-based method but differs in its implementation [40]:
- Preprocessing: T1-weighted images are transformed to MNI152 space at a 0.5 mm voxel resolution, corrected for nonuniformity artifacts using the N3 algorithm, and masked. The volumes are then segmented into tissue classes (CSF, cortical gray matter, subcortical gray matter, white matter).
- Surface Extraction: The hemispheres are separated. For each, an initial white matter surface is obtained using a marching-cubes algorithm. This surface, resampled at 40,962 vertices, is fitted to the position of the maximum local T1-weighted intensity gradient at the gray-white boundary. The adjusted white surface is then expanded to the classified border of gray matter and CSF to create the pial surface.
- Thickness Measurement: CIVET uses the same "double average" distance method as FreeSurfer to compute cortical thickness between the white and pial surfaces in the native space of the original images [40].
CAT
The CAT toolbox (v12.5) uses a volume-based approach that avoids explicit reconstruction of the pial surface [37] [40]:
- Preprocessing: T1-weighted images are denoised, spatially registered, bias-corrected, and skull-stripped. They are then segmented using an adaptive maximum a posteriori approach with a partial volume model.
- Boundary Estimation: The two hemispheres are separated. For every voxel in the cortical gray matter, the closest voxel on the white matter boundary is estimated. The final white matter boundary location is refined using intensity gradients.
- Thickness Measurement: CAT uses a Projection-Based Thickness (PBT) estimation approach. The distance from each gray matter voxel to the white matter boundary is calculated. Voxels with no "successors" (neighboring voxels with a greater distance to the boundary) are considered local maxima and are assumed to lie at the CSF boundary. The distance from these local maxima to the white matter boundary defines the cortical thickness at that location [40].
The Scientist's Toolkit: Essential Research Reagents and Materials
Table 1: Key Software and Computational Resources for Cortical Thickness Analysis.
| Item Name | Function/Description | Key Considerations |
|---|---|---|
| FreeSurfer | Open-source software suite for cortical surface-based analysis. | Consider version differences (v6.0 vs. v7.1.1); recon-all is the primary command [41] [40]. |
| CIVET | Automated pipeline developed by the Montreal Neurological Institute. | Uses a specific sampling (40,962 vertices per hemisphere) and is optimized for MNI152 space [40]. |
| CAT Toolbox | A volume-based toolbox within the SPM software framework. | Uses Projection-Based Thickness (PBT), does not explicitly model the pial surface [40]. |
| ANTs | Advanced Normalization Tools for multivariate spatial normalization and segmentation. | Often used for voxel-based morphometry (VBM); an alternative for volume-based analysis [41]. |
| High-Quality T1w MRI | Primary input data; 3D anatomical scan. | Isotropic resolution of ~1 mm or better is standard; HCP data uses 0.7mm isotropic [37]. |
| T2-weighted MRI | Complementary input data for improved segmentation. | Can be integrated into pipelines like FreeSurfer to improve pial surface placement [41] [40]. |
| High-Performance Computing | Computational cluster or workstation. | Processing (especially FreeSurfer) is computationally intensive and time-consuming. |
Quantitative Comparison of Pipeline Outputs
Understanding the differences between pipelines is crucial for interpreting results and designing studies. Research shows that while pipelines exhibit high within-pipeline reliability, their absolute estimates can differ.
Global and Regional Cortical Thickness Variations
Table 2: Quantitative Comparison of Cortical Thickness Pipelines Based on Large-Scale Cohort Studies [37] [41].
| Comparison Metric | FreeSurfer | CIVET | CAT | Notes and Implications |
|---|---|---|---|---|
| Within-Pipeline Reliability | High | High | High | All pipelines show high test-retest reliability, supporting their use in longitudinal studies [37]. |
| Between-Pipeline Correlation | (Reference) | Strong in most regions | Strong in most regions | Global thickness estimates correlate highly, but absolute values are not interchangeable [37]. |
| Problematic Regions | (Reference) | Lower correlation in paralimbic areas & insula | Lower correlation in paralimbic areas & insula | These regions have high inter-individual variability and low reliability; findings there should be interpreted cautiously [37]. |
| Effect of Input Images | Thickness values differ using T1w only vs. T1w+T2w [41]. | N/A | N/A | Integrating T2w images changes results, confirming estimates are proxies sensitive to processing choices [41]. |
| Effect of Software Version | Significant differences between FS v6.0 and v7.1.1 [41]. | N/A | N/A | Highlights the importance of using consistent software versions across a study or when comparing studies. |
A pivotal investigation using two large-scale cohorts found that while spatial patterns of cortical thickness were comparable across FreeSurfer, CIVET, and CAT, absolute regional thickness values differed significantly between pipelines for the same individual [37]. This confirms that in-vivo thickness measurements are a proxy and should only be compared within the same software package and technique. At a group level, correlations between pipelines are strong in most brain regions, with the notable exception of paralimbic areas and the insula, which show the lowest between-pipeline correlations and the highest inter-individual variability [37].
Furthermore, the choice of software and input images introduces age-specific variations. A 2023 study demonstrated that differences in cortical thickness estimates due to using FreeSurfer versus ANTs, or different input images (T1w vs. T1w+T2w), are not constant but change with the age range of the subjects being studied [41].
Impact on Behavioral and Clinical Research
The choice of processing pipeline is not merely a technical detail; it has a direct bearing on the behavioral and clinical conclusions drawn from neuroimaging data.
Case Study: Gray Matter and Substance Use Research
Meta-analyses of gray matter alterations in substance use disorders reveal convergent GM reductions in the medial frontal/ventromedial prefrontal cortex, anterior cingulate cortex (ACC), and insula across various drug classes [8]. These regions are critical for salience detection, cognitive control, and decision-making. However, the directionality of the association between brain structure and behavior can be complex. A longitudinal study on adolescent drunkenness frequency used causal Bayesian network analysis and found that accelerated gray matter atrophy in frontal and temporal cortices was associated with an increased risk for drunkenness, suggesting that brain development traits may influence behavior, not solely that substance use causes neurotoxicity [42]. This highlights the importance of robust morphological measures for accurate causal inference.
Critically, the pipeline used can influence the detected brain-behavior relationships. An investigation demonstrated "considerable variations in the spatial pattern of associations between cognitive scores and cortical thickness measurements across tools" [37]. This means that a scientist using FreeSurfer might find a significant correlation in a specific brain region, while a colleague using BrainSuite on the same data might not, potentially leading to irreproducible associations [37].
Best Practices and Recommendations
To ensure the reliability and interpretability of research on gray matter thickness and behavioral outcomes, the following best practices are recommended:
- Consistency is Critical: Process all data within a single study using the same software package, version, and processing parameters [41]. Do not mix and match pipelines or versions for subjects being directly compared.
- Contextualize Comparisons: Be cautious when comparing absolute thickness values from studies using different pipelines. Focus on effect sizes and spatial patterns rather than absolute millimeter differences [37].
- Interpret with Caution: Exercise heightened caution when interpreting findings in regions known to have high variability and low between-pipeline agreement, such as the insula and paralimbic areas [37].
- Rigorous Quality Control: Implement and report a rigorous visual quality control (QC) protocol for pipeline outputs (e.g., checking segmentation accuracy and surface placement) to identify and exclude subjects with processing failures [37].
- Embrace Transparency: Fully report the software name, version, and key parameters in all publications to enable replication and facilitate meta-analyses.
The fundamental goal of linking brain structure to behavioral outcomes is to establish robust, biologically grounded biomarkers that can predict cognitive function, track neurodevelopmental trajectories, and quantify the efficacy of therapeutic interventions. Research into gray matter thickness associations with behavioral outcomes is a cornerstone of this endeavor, providing a quantifiable link between brain anatomy and human cognition, emotion, and action. For researchers and drug development professionals, mastering this integration is critical. It enables the objective measurement of how neurological structure underpins function and how it is altered in disease states or in response to treatment. This guide provides a technical framework for designing and executing studies that seamlessly weave together sophisticated MRI-derived metrics with rigorous behavioral phenotyping, focusing on the practicalities of protocol design, data analysis, and interpretation within the context of contemporary neuroscience research.
Quantitative Data Synthesis: Key Structural-Behavioral Associations
The following tables synthesize key quantitative findings from recent studies, highlighting specific gray matter structures, their metrics, and the strength of their association with behavioral outcomes.
Table 1: Gray Matter Thickness Associations with Behavioral and Developmental Outcomes
| Brain Region | Structural Metric | Associated Behavioral Outcome | Study Population | Nature of Association | Citation |
|---|---|---|---|---|---|
| Anterior Cingulate Gyrus | Cortical Thickness | Post-operative Motor Function | Children with Pharmacoresistant Epilepsy | Positive Correlation (Protective Factor, OR=18.19) | [43] |
| Prefrontal Cortex | Gray Matter Structure | Neuropsychological Development | Children with Pharmacoresistant Epilepsy | Positive Correlation (Pre-surgery) | [43] |
| Temporal Pole / Middle Temporal Gyrus | Gray Matter Volume | Post-operative Motor Function | Children with Pharmacoresistant Epilepsy | Negative Correlation (Risk Factor, OR=0.07) | [43] |
| Anterior Cingulate Cortex (ACC) | Cortical Surface Area (CSA) & Cortical Thickness (CT) | Presence of Multisite Pain | Children (Ages 9-11) | Lower CSA and CT in Patients | [44] |
| Middle Frontal Gyrus (MFG) | Cortical Surface Area (CSA) & Cortical Thickness (CT) | Presence of Multisite Pain | Children (Ages 9-11) | Lower CSA and CT in Patients | [44] |
Table 2: Brain Network Metrics and Their Relationship to Cognition and Demographics
| Network Metric | Description | Associated Factor | Study Population | Nature of Association | Citation |
|---|---|---|---|---|---|
| Structural Connectivity (SC) | Physical white matter wiring | Age | Children (Ages 4-7) | Dominant predictor of age compared to FC and SC-FC coupling | [45] |
| SC-FC Coupling | Alignment of structural and functional networks | Age & Cognitive Performance | Children & Adults (Lifespan) | Strengthens with age; predictive of cognitive performance | [45] |
| Nodal Network Measures | Centrality/Influence of a region within the overall network | Attentional Performance | Children (Ages 4-7) | Correlated with performance in regions like Superior Parietal Lobule | [45] |
| Nodal Network Measures | Centrality/Influence of a region within the overall network | Multisite Pain | Children (Ages 9-11) | Alterations in pain matrix regions (ACC, MFG, Anterior Insula) | [44] |
Experimental Protocols for Integrated Brain-Behavior Research
Protocol 1: Longitudinal Pediatric Development Study
This protocol is designed to track the dynamic relationship between brain maturation and cognitive skill acquisition in early childhood [45].
- Participant Recruitment: Recruit typically developing children within the target age range (e.g., 4-7 years). Apply strict exclusion criteria, including history of neurodevelopmental disorders, neurological diagnosis, chronic medical conditions, or preterm birth [45].
- Longitudinal Design: Conduct baseline assessments with follow-up visits at predetermined intervals (e.g., one year). This allows for the measurement of within-subject change over time [45].
- Multimodal MRI Acquisition:
- Structural Imaging: Collect high-resolution T1-weighted images (e.g., MPRAGE sequence) to analyze gray matter architecture, including cortical thickness and surface area.
- Diffusion MRI: Acquire multishell diffusion-weighted images (dMRI) to reconstruct white matter pathways and construct the structural connectome (SC).
- Functional MRI: Perform passive-viewing or task-based fMRI to measure brain activity and derive the functional connectome (FC). A passive-viewing paradigm (e.g., watching a video) is often used with young children to minimize motion [45].
- Behavioral Assessment: Administer standardized, age-appropriate cognitive batteries. For attention, this may include tests for:
- Sustained Attention: Maintaining focus over extended durations.
- Selective Attention: Filtering out distractors to locate a target.
- Executive Attention: Shifting responses and controlling behavior in changing circumstances [45].
- Data Analysis:
- Graph Theory Analysis: Treat brain regions as nodes and structural/functional connections as edges. Calculate metrics of segregation (e.g., modularity, clustering) and integration [45].
- Partial Least Squares (PLS): Use this multivariate statistical technique to identify latent variables that capture the maximal covariance between the brain measures (e.g., graph metrics, SC-FC coupling) and behavioral/age data [45].
Protocol 2: Leveraging Clinical MRIs for Retrospective/Prospective Cohort Study
This cost-efficient protocol leverages existing clinical brain MRIs, repurposing them for research by pairing them with prospectively collected behavioral and genetic data [46].
- Cohort Identification (SLIP Criteria): From a hospital's electronic health record (EHR), identify patients with clinical brain MRIs categorized as having "Limited Imaging Pathology" (SLIP). This involves trained graders systematically reviewing radiology reports to exclude scans with significant neurological abnormalities or gross artifacts [46].
- Participant Recruitment and Consent: Recruit eligible patients (e.g., adolescents) and their parents. Obtain informed consent for the use of their retrospective clinical MRI and for prospective data collection [46].
- Prospective Data Collection:
- Behavioral Phenotyping: Administer a battery of self-report scales virtually via platforms like REDCap. Domains should include mental health, trauma, risk, and resilience. Examples include the Youth Self-Report (YSR) and other well-validated scales for the target population [46].
- Genetic Sampling: Provide at-home saliva collection kits (e.g., Oragene Discover OGR-600) to the adolescent proband and both biological parents for trio analysis. Kits are returned to a central biobank for DNA extraction and storage [46].
- Data Integration and Analysis: Process clinical T1-weighted MRIs to derive gray matter metrics (cortical thickness, surface area). Perform association analyses between these structural measures, genetic data, and the prospectively acquired behavioral phenotypes [46].
Protocol 3: Cross-Sectional Case-Control Morphometry Study
This protocol is ideal for identifying structural gray matter alterations in specific clinical populations, such as children with chronic multisite pain [44].
- Participant Matching: Recruit a well-defined clinical group and a matched control group. Matching should be based on demographics such as sex, age, body mass index, pubertal status, and socioeconomic factors to control for confounding variables [44].
- Multimodal MRI Acquisition: Conduct research-grade MRI scans on all participants. Key sequences include:
- High-Resolution T1-Weighted MRI: For cortical thickness (CT) and cortical surface area (CSA) analysis. These are genetically independent metrics that may reflect distinct neurodevelopmental processes [44].
- T2-Weighted and Other Structural Sequences: For comprehensive morphological assessment.
- Behavioral and Psychosocial Assessment: Administer detailed questionnaires to capture the clinical phenotype. For pain studies, this includes pain location, frequency, and associated biopsychosocial characteristics like sleep quality, conduct disorder symptoms, and general somatic symptoms [44].
- Advanced Morphometric Analysis:
- Surface-Based Morphometry (SBM): Used to precisely measure cortical thickness across the entire cortical mantle.
- Voxel-Based Morphometry (VBM): Used to investigate volume differences in gray matter across the whole brain.
- Structural Covariance Networks (SCNs): Construct SCNs using inter-regional correlations in CT or CSA across subjects. Apply graph theory to analyze the global and nodal properties of these networks [44].
- Statistical Modeling: Use non-parametric permutation tests to examine group differences in SCN matrices. Employ regression models to assess the relationship between abnormal gray matter measures and biopsychosocial characteristics [44].
Workflow Visualization: From Data Acquisition to Insight
The following diagram illustrates the integrated pipeline for a brain-behavior study, from participant recruitment to final analysis and application.
Table 3: Key Resources for Integrated Brain-Behavior Studies
| Resource Category | Specific Tool / Solution | Primary Function in Research |
|---|---|---|
| Multimodal Databases | Welsh Advanced Neuroimaging Database (WAND), Adolescent Brain Cognitive Development (ABCD) Study | Provide large-scale, pre-collected, multimodal datasets (MRI, MEG, TMS, behavior) for validation and discovery research [47]. |
| Data Organization | Brain Imaging Data Structure (BIDS) | Standardizes the organization and description of neuroimaging data, ensuring reproducibility and simplifying data sharing [47]. |
| MRI Sequence (Structural) | T1-Weighted MPRAGE | Acquires high-resolution anatomical images essential for voxel-based morphometry (VBM) and surface-based morphometry (SBM) to quantify gray matter volume, thickness, and surface area [44] [43]. |
| MRI Sequence (Microstructure) | Diffusion MRI (dMRI) with Ultra-Strong Gradients | Enables mapping of white matter microstructure and reconstruction of the brain's structural connectome (SC) through tractography [45] [47]. |
| Analysis Software (Morphometry) | VBM & SBM Pipelines (e.g., in FSL, FreeSurfer) | Automates the processing of T1-weighted images to produce whole-brain maps of gray matter characteristics (volume, thickness) for group comparisons [43]. |
| Analysis Software (Networks) | Brain Connectivity Toolbox | A collection of graph theory functions for analyzing the topological organization of both structural and functional brain networks (e.g., modularity, nodal efficiency) [45] [44]. |
| Statistical Analysis Tool | Partial Least Squares (PLS) | A multivariate technique ideal for identifying latent variables that maximize the covariance between two data blocks (e.g., brain metrics and behavior) [45]. |
| Biospecimen Collection | Oragene Discover OGR-600 Saliva Kit | Enables non-invasive, at-home collection of DNA for genetic analysis, facilitating the integration of polygenic risk scores into brain-behavior models [46]. |
| Data Collection Platform | REDCap (Research Electronic Data Capture) | A secure web platform for building and managing online surveys and databases, ideal for collecting behavioral and self-report data [46]. |
Gray matter metrics, derived from structural magnetic resonance imaging (sMRI), have emerged as powerful potential biomarkers for predicting and monitoring treatment response in clinical trials for neurological and psychiatric disorders. These metrics—including cortical thickness, surface area, and gray matter volume—provide quantifiable measures of brain structure that can reflect underlying neurobiological processes. The application of these biomarkers is grounded in the thesis that alterations in gray matter structure are associated with behavioral and clinical outcomes, offering an objective bridge between biological intervention and therapeutic effect. By capturing subtle, treatment-related neuroplasticity, gray matter morphometry moves beyond traditional clinical scales to provide a more direct and mechanistic assessment of a therapy's impact on the brain.
The growing interest in these biomarkers stems from their potential to address key challenges in clinical trials, including patient stratification, outcome prediction, and understanding treatment mechanisms. For instance, in major depressive disorder, more than one-half of patients do not respond to first-line antidepressant treatment, creating an urgent need for biomarkers that can guide treatment selection [48]. Similarly, in neurodegenerative and neurodevelopmental disorders, gray matter metrics show promise for tracking disease progression and therapeutic efficacy at the individual level, supporting the development of personalized medicine approaches in neurology and psychiatry [49] [50].
Key Gray Matter Metrics and Their Biological Significance
Gray matter metrics provide distinct yet complementary information about brain structure. Cortical thickness measures the distance between the pial and white matter surfaces, reflecting the density and arrangement of neurons, glial cells, and processes within cortical columns. Surface area quantifies the cortical surface expansion, largely influenced by cortical folding and sulcal patterns during neurodevelopment. Gray matter volume represents the product of cortical thickness and surface area, providing an overall measure of regional gray matter quantity [51]. These metrics have distinct genetic determinants and developmental trajectories, suggesting they capture different aspects of brain biology and may show differential sensitivity to various treatment mechanisms.
From a clinical trial perspective, each metric offers unique advantages. Cortical thickness is particularly sensitive to maturational changes and degenerative processes, while surface area shows strong associations with cognitive performance and may reflect different genetic influences [52] [49]. Gray matter volume provides a robust, commonly used measure that integrates both thickness and area information. Advanced analysis techniques like voxel-based morphometry (VBM) enable automated, whole-brain analyses of gray matter volume differences, while surface-based methods allow more precise measurement of cortical thickness and surface area [53] [51].
Table 1: Key Gray Matter Metrics in Clinical Trial Applications
| Metric | Biological Interpretation | Technical Considerations | Clinical Trial Applications |
|---|---|---|---|
| Cortical Thickness | Reflects neuronal density, size, and organization; sensitive to neuroplastic changes | Surface-based analysis required; sensitive to motion artifacts | Monitoring neuroprotective effects; tracking disease progression |
| Surface Area | Influenced by cortical folding during development; distinct genetic determinants | Requires high-resolution MRI; sensitive to segmentation errors | Stratification in neurodevelopmental disorders; cognitive outcome prediction |
| Gray Matter Volume | Integrated measure of thickness and area; commonly used in VBM studies | Voxel-based methods widely available; confounded by multiple factors | Primary outcome in neurodegenerative trials; treatment target engagement |
| Subcortical Volume | Measures deep gray matter structures (e.g., hippocampus, basal ganglia) | Volumetric segmentation; sensitive to atlas selection | Hippocampal volume as biomarker in Alzheimer's trials; striatal changes in Parkinson's |
Evidence Base: Gray Matter Biomarkers Across Disorders
Psychiatric Disorders
In major depressive disorder, recent evidence demonstrates that models combining clinical features with neuroimaging biomarkers show substantial generalizability across different randomized controlled trials. A 2025 prognostic study examining prediction of response to sertraline and escitalopram found that models incorporating functional connectivity of the dorsal anterior cingulate cortex (dACC) alongside clinical features achieved area under the curve (AUC) values of 0.62-0.67 in cross-trial validation, significantly outperforming models using clinical features alone [48]. This suggests that gray matter circuitry, particularly involving the dACC, provides valuable information about antidepressant response potential that transcends specific trial methodologies and populations.
For psychosis risk prediction, a large-scale ENIGMA consortium study utilized multisite sMRI to develop a classifier predicting psychosis onset in individuals at clinical high risk (CHR). The classifier, based on cortical surface area measures from regions including the right superior frontal, right superior temporal, and bilateral insular cortices, achieved 85% accuracy in the training dataset and 73% accuracy in an independent confirmatory dataset [49]. Notably, CHR individuals who did not develop psychosis were more likely to be classified as healthy controls (73% classification rate), suggesting that gray matter patterns have prognostic significance for disease trajectory.
Neurological Disorders
In Parkinson's disease (PD), a systematic review and meta-analysis of T1-weighted MRI gray matter biomarkers demonstrated robust specificity (0.889) and moderate sensitivity (0.71) for distinguishing PD patients from healthy controls [54]. Frequently implicated regions included the substantia nigra, striatum, thalamus, medial temporal cortex, and middle frontal gyrus. Machine learning approaches, particularly support vector machines and neural networks, further enhanced diagnostic performance when applied with appropriate validation rigor, though the authors noted that standalone diagnostic application requires further standardization.
For ischemic stroke, advanced MRI techniques are being integrated into clinical trials of stem cell therapies to provide objective efficacy measures. Gray matter metrics complement other imaging modalities like diffusion tensor imaging (DTI) and functional MRI (fMRI) in assessing treatment-mediated neurorestoration and structural plasticity [55]. These applications highlight how gray matter measures can quantify therapeutic effects on brain structure alongside functional recovery measures.
Table 2: Performance of Gray Matter Biomarkers Across Disorders
| Disorder | Key Predictive Regions | Performance Metrics | Study Details |
|---|---|---|---|
| Major Depressive Disorder | Dorsal anterior cingulate cortex (dACC) | AUC 0.62-0.67 for antidepressant response prediction | Cross-trial generalization; n=363 from EMBARC and CANBIND-1 trials [48] |
| Clinical High Risk for Psychosis | Superior frontal, superior temporal, insular cortices (surface area) | 73% accuracy in independent validation | Multisite ENIGMA study; n=2,194 total [49] |
| Parkinson's Disease | Substantia nigra, striatum, thalamus | Sensitivity 0.71, Specificity 0.889 | Meta-analysis of 26 studies [54] |
| Neurodevelopmental Disorders | Fronto-temporal cortical thickness, subcortical volumes | Varies by disorder; often moderate effect sizes | Combined metrics improve prediction; requires age-specific norms [51] |
Methodological Framework: Experimental Protocols and Workflows
Image Acquisition and Processing Protocol
Standardized image acquisition is fundamental for reliable gray matter metrics in clinical trials. The recommended protocol includes:
High-Resolution T1-Weighted Imaging: Acquisition parameters should prioritize optimal gray/white matter contrast with isotropic voxels ≤1mm³ (e.g., MPRAGE, SPGR sequences) [53] [51]. Consistent positioning, coil usage, and scanning parameters across sites and timepoints are essential for multisite trials.
Quality Control Pipeline: Implement automated and visual quality checks for motion artifacts, intensity inhomogeneity, and registration accuracy. Tools like MRIQC and visual inspection protocols should be standardized across raters [51]. In pediatric or clinical populations with movement challenges, prospective motion correction or repeated acquisitions may be necessary.
Processing and Analysis Workflow: Utilize established software pipelines (FreeSurfer, FSL, SPM) with version control and consistent parameter settings throughout the trial. The processing pipeline typically includes noise reduction, intensity normalization, tissue segmentation, cortical surface reconstruction, and spatial normalization [53] [51].
The following workflow diagram illustrates the standardized processing pipeline for gray matter analysis in clinical trials:
Machine Learning Prediction Protocol
For treatment response prediction, machine learning protocols typically follow these stages:
Feature Selection: Include clinically relevant variables (age, sex, baseline symptom severity) alongside gray matter metrics from regions of interest. Dimensionality reduction techniques (PCA, feature selection algorithms) may be applied to avoid overfitting [48] [53].
Model Training with Cross-Validation: Utilize regularized regression (elastic net), support vector machines, or random forests with nested cross-validation to optimize hyperparameters and prevent overfitting. Data harmonization methods (ComBat) are essential for multisite data to remove scanner and site effects [48] [49].
Validation and Performance Assessment: Validate models in held-out test sets or external datasets using appropriate metrics (AUC, balanced accuracy, correlation coefficients). For clinical trials, time-to-event analyses may complement classification approaches [48] [53].
The following diagram illustrates the treatment response prediction framework:
Technical Considerations and Best Practices
The Scientist's Toolkit: Essential Research Reagents and Solutions
Table 3: Essential Tools for Gray Matter Biomarker Research
| Tool Category | Specific Solutions | Function | Considerations |
|---|---|---|---|
| Image Processing Software | FreeSurfer, FSL, SPM, CIVET | Cortical reconstruction, volumetric segmentation, spatial normalization | FreeSurfer preferred for surface-based metrics; version control critical [51] |
| Quality Control Tools | MRIQC, Qoala-T, manual visual inspection | Identify acquisition artifacts, processing errors | Multimodal QC essential; establish inter-rater reliability [51] |
| Statistical Analysis Platforms | R, Python (scikit-learn, nilearn), MATLAB | Model building, statistical inference, visualization | Machine learning libraries require careful hyperparameter tuning [53] |
| Multisite Harmonization | ComBat, Longitudinal ComBat, RemoveBatchEffect | Remove scanner/site effects in multicenter trials | Preserves biological variability while removing technical artifacts [49] |
| Data Management Systems | XNAT, COINS, LORIS | Storage, organization, and sharing of imaging data | Must ensure HIPAA/GDPR compliance in clinical trials [50] |
Standardization and Reproducibility
Methodological standardization is paramount for reliable gray matter biomarkers in clinical trials. Key considerations include:
Software Version Control: Consistent use of the same software version, operating system, and hardware configuration throughout a trial, as even minor version differences can significantly impact volumetric estimates [50].
Longitudinal Processing: For clinical trials with repeated measures, specialized longitudinal processing streams (e.g., FreeSurfer longitudinal) improve reliability by creating an unbiased within-subject template [51].
Statistical Power and Multiple Comparisons: Appropriate correction for multiple comparisons (FDR, permutation testing) and power analysis based on effect sizes from pilot data or previous literature. Larger samples are typically required for machine learning approaches [53].
Confound Management: Systematic control for potentially confounding variables including age, sex, intracranial volume, and medication status using appropriate statistical methods [56].
Gray matter metrics represent promising biomarkers for treatment response in clinical trials across neurological and psychiatric disorders. Current evidence demonstrates their utility in predicting treatment outcomes, stratifying patient populations, and potentially monitoring therapeutic effects. The integration of these biomarkers within a thesis connecting gray matter structure to behavioral outcomes provides a mechanistic framework for understanding treatment effects.
Future developments will likely focus on several key areas: (1) standardization of acquisition and analysis protocols to facilitate multisite trial applications; (2) integration of gray matter metrics with other modalities (functional MRI, diffusion imaging, genetics) in multimodal biomarker panels; (3) application of advanced machine learning and deep learning approaches to improve predictive accuracy; and (4) development of normative growth charts for gray matter development across the lifespan to better contextualize treatment-related changes [51] [50].
As these methodologies continue to mature and standardization improves, gray matter biomarkers hold significant potential to enhance the precision and efficiency of clinical trials, ultimately contributing to more personalized and effective interventions for brain disorders.
Navigating Pitfalls: Challenges and Best Practices in GM Analysis
In the investigation of associations between gray matter structure and behavioral outcomes, the accurate attribution of causality is paramount. Research in this domain is inherently complex, as observed relationships can be distorted, or confounded, by extraneous variables that are associated with both the exposure (e.g., gray matter thickness) and the outcome (e.g., cognitive performance). Failing to adequately manage these confounds can lead to spurious conclusions, wasted resources, and misguided therapeutic development. This guide provides an in-depth technical framework for researchers and drug development professionals to identify and manage three primary categories of confounds: comorbidity (distinct additional clinical entities), physiological (inherent biological or developmental processes), and technical (methodological variations in data acquisition and processing). Within a broader thesis on gray matter associations, proper handling of these variables is not merely a statistical exercise but a fundamental prerequisite for scientific validity and translational impact. The following sections delineate specific confounds, provide structured data on their effects, and detail protocols for their mitigation, with a particular focus on advancing research in neurodevelopmental and neurological disorders.
Comorbidity Confounds: Accounting for Co-existing Clinical Conditions
Comorbidity, defined as "any distinct additional clinical entity that has existed or that may occur during the clinical course of a disease that is under study," is a potent confounder in longitudinal clinical research [57]. It can significantly impact a patient's prognosis and alter therapeutic outcomes.
Quantifying Comorbidity: Indices and Their Applications
The Charlson Comorbidity Index (CCI) is a widely validated, weighted measure designed specifically to predict long-term mortality by accounting for the prognostic impact of chronic conditions [57]. Its development and validation across different populations and time frames are key to its durability and generalizability.
Table: Major Comorbidity Indices and Their Characteristics
| Index Name | Primary Outcome | Population Validated | Key Strengths | Key Limitations |
|---|---|---|---|---|
| Charlson Comorbidity Index (CCI) | 1-year and 10-year mortality | Hospitalized medical patients; Breast cancer patients [57] | Empirical weighting; High generalizability due to validation in disparate populations [57] | Designed for mortality, not necessarily other outcomes like function or quality of life [57] |
| Disease-specific Indices | Varies by index disease | Specific patient populations (e.g., AML, RA) [57] | High relevance for the specific condition | Lack of comparability across studies and populations [57] |
| Simple Disease Count | Varies | Varies | Simple to calculate | No prognostic weighting; Poor reproducibility and biologic basis [57] |
Methodological Considerations for Comorbidity Assessment
- Validation Populations: Measures developed and validated in split samples from the same population often perform poorly when applied to different populations, a phenomenon known as "data drift." Superior generalizability is achieved when validation is performed in a completely different population, clinical setting, or geographic location [57].
- Number of Conditions: Including a large number of candidate conditions in a comorbidity model may improve initial prediction but radically reduces its predictive ability and generalizability when applied to a new population due to overfitting [57].
- Gap in Clinical Trials: A critical review found that patients with comorbidity were excluded from 65% of randomized clinical trials (RCTs), and only 3.1% of RCTs that included them evaluated comorbidity as an effect modifier or source of heterogeneous treatment response [57]. This gap directly impacts the development of evidence-based guidelines applicable to real-world patients with multiple conditions.
Physiological confounds are inherent biological or developmental variables that can systematically influence both brain structure and behavioral outcomes. Their oversight can lead to misinterpretation of neurobehavioral correlations.
Key Physiological Confounds in Gray Matter Research
Table: Common Physiological Confounds and Management Strategies
| Confound Variable | Impact on Gray Matter & Behavior | Evidence from Literature | Recommended Control Methods |
|---|---|---|---|
| Age | Global and regional gray matter volume and cortical thickness follow non-linear trajectories across the lifespan, influencing cognitive performance [58]. | Covariate adjustment; Age-matching in case-control studies; Longitudinal modeling of within-subject change. | |
| Sex/Biological Sex | Dimorphic patterns in brain volume and structure are common, independent of behavioral outcomes. | Statistically include sex as a covariate in group analyses; Conduct sex-stratified analyses. | |
| Overall Health Status (e.g., BMI) | Light physical activity is linked to greater gray matter volume and lower BMI, with GM volume potentially mediating the relationship [59]. | Measure and statistically control for variables like BMI, cardiovascular health metrics. | |
| Gestational Age at Birth | Extremely preterm birth is associated with altered brain volumes and cortical thickness, impacting cognitive outcomes at age 12 [58]. | Carefully match study groups or use regression techniques to adjust for gestational age. | |
| Iatrogenic Effects | Medical treatments for comorbidities can independently alter brain structure and function [57]. | Document and account for medication usage and treatment histories in analyses. |
Insights from Developmental and Cross-Sectional Studies
Research in children born extremely preterm (EPT) highlights the complex nature of physiological associations. One study found that while total brain tissue volumes at 10 years were positively associated with Full-Scale IQ (FSIQ) at 12 years, greater mean cortical thickness was negatively associated with FSIQ [58]. This inverse relationship underscores that the functional significance of a morphological measure is not always intuitive and may reflect altered neurodevelopmental trajectories, such as delayed synaptic pruning [58]. Furthermore, in a cross-sectional sample of middle-aged adults, whole brain gray matter volume was found to be a potential mediator in the relationship between light physical activity and lower BMI, suggesting a pathway through which physiology, brain structure, and behavior are linked [59]. These findings necessitate careful interpretation of gray matter-behavior correlations without considering the broader physiological context.
Technical Confounds: Ensuring Measurement Fidelity in Neuroimaging
Technical confounds arise from variations in data acquisition protocols, instrumentation, and processing pipelines, introducing non-biological variance that can obscure or mimic true effects.
Magnetic Resonance Imaging (MRI) Acquisition and Processing
- Scanner Variations: Data acquired from different scanner manufacturers (e.g., Philips Intera 1.5T vs. General Electric SIGMA HDx 3.0T) and field strengths can introduce significant variance in measured brain volumes and cortical thickness [58]. Protocol: Use the same scanner and acquisition protocol for all participants in a longitudinal study. For multi-site studies, implement a rigorous harmonization protocol, including the use of phantom scans and cross-site calibration.
- Image Preprocessing Pipelines: Variations in software (e.g., SPM, FSL, FreeSurfer) and algorithms (e.g., for segmentation, normalization, and cortical surface reconstruction) can yield systematically different results [58]. Protocol: Preprocess all study data through an identical, pre-registered pipeline. For cortical thickness measurement, use established tools like FreeSurfer, which automates the reconstruction of cortical surface models from T1-weighted images [58].
- Motion Artifacts: Participant movement during scanning degrades image quality and can bias morphological estimates. Protocol: Exclude images with excessive motion artifacts or blurring at the gray-white matter interface, as determined by visual inspection and quantitative metrics [58]. Implement real-time motion correction during acquisition.
Cognitive and Behavioral Assessment
- Assessment Tools: Different cognitive batteries (e.g., WISC-V vs. WAIS-IV) and behavioral scales (e.g., Fugl-Meyer, Ashworth spasticity scale) measure overlapping but distinct constructs [2]. Protocol: Select the assessment tool most valid for your specific research question and population. Apply it consistently, administered by trained, certified personnel to minimize inter-rater bias [58].
- Longitudinal Testing Effects: Practice effects from repeated testing can confound true cognitive change. Protocol: Utilize alternate test forms where available, or account for practice effects statistically in longitudinal models.
Integrated Experimental Protocols for Confound Management
This section provides detailed methodologies for key experiments that effectively manage confounds.
Protocol: A Longitudinal Study of Gray Matter Change and Cognitive Outcome in a Clinical Population
This protocol is designed to investigate the association between gray matter change and cognition in children born extremely preterm, accounting for multiple confound types [58].
- Participant Recruitment & Characterization: Recruit a well-defined cohort (e.g., children born <27 weeks gestation) and term-born controls matched for key demographic variables (e.g., location, sex, maternal education). Comorbidity Management: Exclude participants with conditions that independently affect brain structure (e.g., chromosomal abnormalities, congenital malformations, severe brain lesions diagnosed via neonatal ultrasound). Physiological Confound Assessment: Collect comprehensive perinatal and ongoing medical data (e.g., sepsis, necrotizing enterocolitis, bronchopulmonary dysplasia).
- Data Acquisition:
- MRI Scanning: Conduct scans at pre-specified ages (e.g., term-age and 10 years). Use identical 3D T1-weighted sequences across all participants at a given time point. For multi-site studies, use scanner harmonization.
- Cognitive Assessment: Administer standardized cognitive batteries (e.g., Wechsler Intelligence Scale for Children, WISC-V) at a consistent age (e.g., 12 years) by a certified psychologist blinded to the group status and MRI findings.
- Image Processing:
- Volumetrics: Process T1-weighted images using a standardized pipeline involving reorientation, brain extraction, tissue segmentation (gray matter, white matter), and spatial normalization. Use age-specific tissue priors for segmentation. Calculate modulated, normalized volumes for total gray matter, white matter, and regions of interest (e.g., insular cortex) [58].
- Cortical Thickness: Process images with FreeSurfer to perform cortical reconstruction and calculate mean cortical thickness for each hemisphere.
- Statistical Analysis:
- Use multiple hierarchical linear regression to assess associations between brain measures (GM volume, cortical thickness) and cognitive outcomes (FSIQ).
- Critical Confound Adjustment: Include age at scan, sex, and maternal education as core covariates in all models. For clinical groups, additionally adjust for relevant medical confounds (e.g., sepsis, PDA ligation).
- For longitudinal growth modeling, calculate volumetric change by subtracting term-age volumes from 10-year volumes and relate this change to cognitive outcomes.
Protocol: A Randomized Controlled Trial (RCT) with Neuroimaging Outcomes
This protocol outlines a two-arm RCT comparing surgical intervention to botulinum toxin A (BoNT-A) for post-stroke upper limb spasticity, with gray matter volume as a key outcome [2].
- Randomization and Blinding: After baseline assessments, randomly assign participants (1:1 allocation) to the experimental (surgery) or control (BoNT-A) group using a computer-generated sequence by an independent team member to minimize selection bias.
- Baseline and Follow-up Assessments:
- Clinical: At baseline and 6-month follow-up, assess upper limb functionality using standardized scales (Fugl-Meyer, Ashworth, House scale) and quality of life (SF-36). Evaluate caregiver burden.
- Neuroimaging: Perform structural MRI at both time points. Technical Confound Control: Use the same scanner and protocol for all scans. Exclude participants with metallic intracranial implants that cause artifacts.
- Data Analysis:
- Calculate change scores for clinical and imaging measures.
- Use correlation analyses (e.g., across evaluations and groups) to examine relationships between changes in gray matter volume/thickness and clinical outcomes (e.g., pain, spasticity, quality of life).
- Use group-based statistics (e.g., t-tests, ANOVA) to compare the magnitude of change between the surgery and BoNT-A groups, thereby testing the effect of the intervention on brain structure.
The Scientist's Toolkit: Research Reagent Solutions
Table: Essential Materials and Tools for Managing Confounds in Gray Matter Research
| Item/Tool Name | Function/Brief Explanation | Application Context |
|---|---|---|
| FreeSurfer Software | Automated pipeline for cortical reconstruction and volumetric segmentation from MRI; calculates cortical thickness and subcortical volumes [58]. | Standardized processing of T1-weighted MRI data for morphometry. |
| Statistical Parametric Mapping (SPM) / FSL | Software packages for image preprocessing, normalization, segmentation, and voxel-based morphometry (VBM) for regional brain volume analysis [58]. | Voxel-wise analysis of structural differences across the entire brain. |
| Wechsler Intelligence Scale (WISC-V/WAIS-IV) | Gold-standard, standardized assessment of cognitive ability and intelligence quotient (IQ) [58]. | Quantifying behavioral outcomes in relation to brain structure. |
| International Physical Activity Questionnaire (IPAQ) | Self-report measure to assess physical activity duration and frequency across different intensities [59]. | Quantifying lifestyle factors that may confound or mediate brain-behavior relationships. |
| Standardized MRI Phantoms | Physical objects with known properties scanned to quantify and correct for scanner-specific drift and variation over time. | Technical quality control, especially in longitudinal and multi-site studies. |
| Charlson Comorbidity Index (CCI) | Weighted index to quantify the burden of comorbid disease and control for its confounding prognostic impact [57]. | Adjusting for medical complexity in observational studies or clinical trials. |
Visualizing Workflows and Relationships
The following diagrams, generated using Graphviz DOT language, illustrate core concepts and experimental workflows for managing confounds.
A Conceptual Framework for Confounds
This diagram visualizes how different types of confounds can create spurious associations in gray matter research.
Experimental Protocol for a Neuroimaging Study
This flowchart outlines a robust experimental protocol for a longitudinal neuroimaging study, integrating steps for confound management.
Accurate segmentation of brain lesions from magnetic resonance imaging (MRI) is a cornerstone of clinical neuroscience research, particularly for investigations into gray matter thickness and its associations with behavioral outcomes. Lesion segmentation enables the quantitative analysis of how focal brain damage impacts neural structure and, consequently, cognitive function and behavior. Manual segmentation by clinical experts, while considered a gold standard, is time-consuming, labor-intensive, and subject to inter-rater variability [60] [61]. This has driven the development of automated and semi-automated segmentation methods to enhance consistency, reproducibility, and efficiency in both clinical trials and research settings [62] [61].
The challenge is particularly pronounced for small lesions, such as those found in early multiple sclerosis, small vessel stroke, or focal cortical dysplasia. These lesions are difficult to detect due to their limited spatial extent, low contrast against healthy tissue, and the severe class imbalance between lesional and non-lesional voxels in MRI data [63]. The accurate delineation of these lesions is critical; for instance, the total volume and number of brain lesions at diagnosis and over time are correlated with long-term disability and disease progression [63]. This technical guide examines the core challenges in brain lesion segmentation and outlines the advanced strategies and methodologies that are advancing the field.
Core Challenges in Brain Lesion Segmentation
The path to accurate lesion segmentation is fraught with technical and biological hurdles. Key challenges include:
- Low Contrast and Subtle Textural Differences: Many pathological tissues, especially in early stages, exhibit intensity profiles and textural characteristics that are very similar to those of healthy gray and white matter. This is a fundamental issue in MRI-based analyses where contrast-to-noise ratios may be low [60] [61].
- Class Imbalance and Small Lesion Size: The voxels representing a lesion are vastly outnumbered by those representing normal brain tissue. This class imbalance biases standard segmentation models toward the background, causing them to overlook small lesions, which consequently suffer from poor detection rates [63]. This is critical in behavioral studies, where the omission of even small, strategically located lesions can invalidate structure-function correlations.
- Anatomical and Pathological Heterogeneity: The human brain exhibits significant normal anatomical variation. Furthermore, lesions associated with a single disease (e.g., multiple sclerosis) can vary immensely in location, size, shape, and appearance, both across patients and within a single patient's brain [63] [62].
- Boundary Ambiguity: The precise boundaries of a lesion are often fuzzy or indistinct in MRI, making it difficult even for expert raters to achieve perfect consensus on delineation [61]. This ambiguity directly impacts the reliability of derived imaging biomarkers, such as lesion volume.
Table 1: Key Challenges and Their Impact on Research
| Challenge | Impact on Segmentation Accuracy | Downstream Effect on Gray Matter/Behavior Research |
|---|---|---|
| Low Contrast | Poor distinction between lesion and healthy tissue, leading to under-segmentation. | Misclassification of gray matter can corrupt thickness measurements and weaken observed clinical-behavioral associations. |
| Small Lesion Size & Imbalance | High false-negative rate; small lesions are missed entirely. | Critical lesions potentially driving behavioral deficits are omitted, leading to incomplete or inaccurate models. |
| Anatomical Heterogeneity | Models trained on one cohort may not generalize to others with different demographics or disease manifestations. | Reduces the generalizability of research findings across populations and limits pooling of data from multi-center studies. |
| Boundary Ambiguity | High inter-rater variability, resulting in unreliable quantitation. | Introduces measurement noise into lesion volume estimates, obscuring true correlations with behavioral outcomes. |
Advanced Segmentation Strategies
Deep Learning Architectures
Deep learning, particularly convolutional neural networks (CNNs), has become the dominant paradigm in medical image segmentation. The U-Net architecture, with its symmetric encoder-decoder structure and skip connections, has proven exceptionally successful, allowing it to train effectively even with limited data [64]. Recent systematic reviews have indicated that for acute ischemic stroke lesion segmentation, a U-Net configuration with residual connections (UResNet) often demonstrates superior performance compared to more complex attention-based models [65] [64].
Beyond standard CNNs, Vision Transformers (ViTs) and hybrid models that combine CNNs with attention mechanisms are being actively explored. These models aim to capture long-range dependencies in image data, which can be beneficial for understanding context in a full brain volume [62]. However, a 2025 systematic review found no clear evidence favoring the incorporation of attention mechanisms for acute stroke lesion segmentation on MRI, suggesting that the optimal architecture is highly task-dependent [65].
"Plug-and-Play" Labeling Strategies
Innovative approaches that operate directly on training labels, rather than modifying network architecture, have shown remarkable success. These strategies are particularly effective for the challenging problem of small lesion segmentation:
- Multi-Size Labeling (MSL): This strategy reformulates binary segmentation as a multi-class problem by grouping lesions into categories (e.g., small, medium, large) based on their volume. This enables size-aware learning, forcing the model to explicitly learn features relevant to different lesion scales and mitigating the class imbalance for small lesions [63].
- Distance-Based Labeling (DBL): DBL replaces binary masks with continuous representations derived from signed distance transforms. This technique emphasizes the structural boundaries of lesions, sharpening the model's sensitivity to the often-ambiguous edges of a lesion, which is crucial for accurate volume estimation [63].
These "plug-and-play" strategies have demonstrated substantial improvements. On the ATLAS v2.0 stroke lesion dataset, an ensemble model using MSL and DBL outperformed the top baseline method, achieving gains of +1.3% in Dice score and +2.4% in F1 score. Notably, on a subset containing only small lesions (<1000 mm³), the MSL model alone surpassed the performance of a baseline ensemble, highlighting its efficacy for the most challenging cases [63].
Foundation Models and Generalizable Approaches
A significant limitation of many deep learning models is their task-specific nature, where performance can degrade when applied to new datasets or slightly different pathologies. To bridge this gap, foundation models like MedSAM have been proposed. MedSAM is a promptable model trained on a massive and diverse dataset of over 1.57 million medical image-mask pairs across 10 imaging modalities and over 30 cancer types [60].
This extensive training allows MedSAM to function as a universal segmentation tool. In comprehensive evaluations on 86 internal and 60 external validation tasks, MedSAM consistently outperformed the original Segment Anything Model (SAM) and achieved performance on par with, or even superior to, specialist models like U-Net and DeepLabV3+ that were trained on images from a specific modality [60]. This generalizability is a major step toward robust, widely applicable tools for clinical research.
Experimental Protocols for Validation
To ensure that segmentation results are reliable and meaningful for quantitative research, a rigorous experimental protocol is essential. The following methodology outlines a robust framework for training and evaluating a lesion segmentation model, incorporating the advanced strategies discussed.
1. Data Curation and Preprocessing:
- Dataset: Utilize a publicly available benchmark dataset with manual annotations, such as the Anatomical Tracings of Lesions After Stroke (ATLAS) v2.0 dataset for stroke or the Multiple Sclerosis Lesion Segmentation (MSLesSeg) dataset [63].
- Preprocessing: Apply a standardized pipeline including intensity non-uniformity correction (e.g., N4 bias field correction), intensity standardization (e.g., z-score normalization), and linear registration to a standard template space (e.g., MNI-152) [63]. This minimizes scanner-specific and subject-specific variations.
2. Strategy Implementation:
- Multi-Size Labeling (MSL): Calculate the volume of each connected lesion component in the ground-truth masks. Define percentile-based thresholds (e.g., 33rd and 66th) to categorize lesions into small, medium, and large classes. Convert the binary segmentation task into a multi-class problem where the model predicts background, small lesion, medium lesion, or large lesion [63].
- Distance-Based Labeling (DBL): For each lesion in the ground-truth mask, compute the signed distance transform. This assigns each voxel a value representing its distance to the nearest lesion boundary, with positive values inside and negative values outside. This continuous map serves as the training target instead of a binary mask [63].
3. Model Training:
- Architecture: A standard 3D U-Net with residual connections (UResNet) is a strong baseline choice [65] [64].
- Loss Function: For MSL, use a combination of Dice loss and Cross-Entropy loss. For DBL, use Mean Squared Error (MSE) or L1 loss to regress the distance map.
- Training Regimen: Train using a variant of the stochastic gradient descent optimizer (e.g., AdamW) with a learning rate scheduler. Employ heavy data augmentation including random rotations, scaling, elastic deformations, and intensity variations to improve model robustness.
4. Evaluation and Validation:
- Primary Metrics: Use the Dice Similarity Coefficient (Dice) to measure voxel-wise overlap and the Hausdorff Distance (HD) to assess the accuracy of boundary delineation [63] [64].
- Subgroup Analysis: Evaluate performance specifically on a subset of scans containing only small lesions (e.g., < 1000 mm³) to ensure the model is effective for the most challenging cases [63].
- Statistical Testing: Perform statistical tests (e.g., paired t-tests or Wilcoxon signed-rank tests) to confirm that performance improvements from new strategies are significant compared to strong baselines.
Segmentation Workflow: From data preparation to model evaluation.
Table 2: Essential Tools for Brain Lesion Segmentation Research
| Resource / Tool | Type / Category | Function and Research Application |
|---|---|---|
| ATLAS v2.0 Dataset [63] | Data | A public dataset of T1-weighted MRIs with manually segmented stroke lesions; essential for training and benchmarking stroke lesion segmentation models. |
| MSLesSeg Dataset [63] | Data | The official benchmark for multiple sclerosis lesion segmentation; used for evaluating model performance on small, scattered lesions. |
| U-Net with Residual Connections (UResNet) [65] [64] | Model Architecture | A robust deep learning architecture identified as highly effective for acute ischemic stroke lesion segmentation. |
| Multi-Size Labeling (MSL) [63] | Algorithmic Strategy | A labeling technique that improves small lesion detection by creating size-aware categories, addressing class imbalance. |
| Distance-Based Labeling (DBL) [63] | Algorithmic Strategy | A labeling technique that converts binary masks to continuous distance maps to enhance boundary delineation accuracy. |
| MedSAM [60] | Foundation Model | A promptable foundation model trained on a massive dataset; useful for generalizable segmentation across diverse tasks and modalities without task-specific training. |
| Dice Similarity Coefficient (Dice) [63] | Validation Metric | The primary metric for evaluating voxel-wise overlap between automated and manual segmentations. |
| Hausdorff Distance (HD) [62] | Validation Metric | A metric that quantifies the largest segmentation boundary error, crucial for assessing contour accuracy. |
Integration with Gray Matter and Behavioral Outcomes Research
The precise segmentation of brain lesions is not an end in itself but a critical step in uncovering the relationship between brain structure and function. In studies investigating gray matter thickness and behavioral outcomes, inaccurate lesion maps pose a direct threat to validity.
- Lesion Loading and Covariate Control: When studying the correlation between native gray matter thickness in a specific region (e.g., the anterior cingulate cortex) and a behavioral score (e.g., impulsivity), it is imperative to account for the presence of lesions. A segmented lesion mask allows the researcher to compute a "lesion load" – the volume of lesion tissue within the region of interest – which must be included as a covariate in statistical models. Failure to do so can lead to spurious findings, as the behavioral deficit may be a direct consequence of the lesion rather than the integrity of the surrounding gray matter [66].
- Enabling Longitudinal Analysis: Accurate serial segmentation allows for the quantification of lesion evolution over time (e.g., new lesions, lesion shrinkage or growth). This dynamic information can be a more powerful predictor of behavioral progression or treatment response than a single time-point measurement. For instance, the appearance of new lesions in multiple sclerosis is a key indicator of disease activity [63].
- Network-Level Insights: Meta-analyses of structural MRI studies have shown that gray matter alterations across various disorders (including addiction and behavioral disorders) converge in specific regions like the anterior cingulate and medial frontal cortex [66] [8]. Precise lesion segmentation in these hub regions can help test hypotheses about how damage to specific large-scale networks (e.g., the Salience Network or Default Mode Network) manifests in behavioral deficits, thereby bridging focal lesion analysis and network-based neuroscience [8].
Segmentation's Role in Behavioral Analysis
The "Lesion Problem" remains a central challenge in medical image analysis, but the advent of sophisticated deep learning models, innovative labeling strategies like MSL and DBL, and the emergence of general-purpose foundation models are providing powerful solutions. For researchers focused on gray matter thickness and behavioral outcomes, the choice and implementation of segmentation methodology is not merely a technical pre-processing step but a foundational element that directly impacts the integrity of their scientific conclusions. By adopting the robust, validated strategies outlined in this guide—such as employing size-aware learning for small lesions, using well-architected models like UResNet, and rigorously validating with appropriate metrics—scientists can ensure that their lesion data is accurate and reliable, thereby paving the way for more meaningful and reproducible discoveries in brain-behavior relationships.
In the investigation of gray matter thickness associations with behavioral outcomes, the validity of research findings is fundamentally dependent on the reliability of the underlying data. This is particularly critical in longitudinal studies and multi-site consortia, which are essential for achieving the large sample sizes necessary for robust and generalizable findings in human neuroscience. Longitudinal stability—the test-retest reliability of measurements across extended timespans—is a key psychometric property that must be characterized and optimized to ensure that observed brain-behavior relationships reflect true effects rather than measurement artifact [67]. When reliability is not adequately assessed, researchers risk drawing incorrect conclusions due to statistical challenges including reduced power, sign errors (incorrect direction of effects), and magnitude errors (overestimation of effect sizes) [67]. For research relating cortical morphology to behavioral phenotypes, these concerns are paramount, as subtle but meaningful associations may be obscured by unreliable measurement approaches. This technical guide provides comprehensive protocols for ensuring data reliability in longitudinal neuroimaging studies, with specific considerations for the complex context of multi-site consortia investigating gray matter thickness and its behavioral correlates.
Quantifying Reliability and Stability in Longitudinal Designs
Statistical Frameworks for Reliability Assessment
The Intraclass Correlation Coefficient (ICC) serves as the primary statistical metric for quantifying reliability in longitudinal neuroimaging studies. The ICC quantifies the proportion of total variance in measurements attributed to stable between-subjects differences relative to all sources of variance, including within-subject fluctuations and measurement error [67]. Different forms of ICC exist depending on whether the goal is to assess the reliability of single measurements or averages of multiple measurements, and whether absolute agreement or consistency across repeated measures is required [67].
For longitudinal studies with extended intervals between assessments, the traditional assumption of no systematic change in the underlying construct is often untenable. In these contexts, differences between scans reflect both measurement reliability and true longitudinal change, necessitating the term "longitudinal stability" to describe what is captured by reliability estimates [67]. The Intra-Class Effect Decomposition (ICED) model provides an advanced analytical approach that separately estimates between-subjects variance and error variance, allowing researchers to assess their relative contributions across brain regions and testing sites [67].
Regional Heterogeneity in Structural MRI Reliability
Recent evidence from the Adolescent Brain Cognitive Development (ABCD) study reveals substantial heterogeneity in the longitudinal stability of gray matter measures across brain regions, cortical measures, and parcellation schemes [67]. The table below summarizes key patterns in regional reliability that must be considered when designing studies of gray matter thickness and behavioral outcomes.
Table 1: Regional Heterogeneity in Longitudinal Stability of Gray Matter Measures
| Factor | Impact on Longitudinal Stability | Practical Implications |
|---|---|---|
| Brain Region | ICC estimates range from 0 to .98 depending on region [67] | Power calculations must be region-specific; avoid low-stability regions for behavioral correlations |
| Cortical Measure | Cortical thickness shows distinct stability patterns compared to surface area and volume [67] | Select measurement modality based on reliability in target regions |
| Parcellation Scheme | Stability differs between Desikan-Killiany-Tourville and Destrieux atlases [67] | Parcellation choice should be justified based on reliability considerations |
| Testing Site | Differences across sites driven mainly by error variance [67] | Site effects must be modeled explicitly in analyses |
This regional heterogeneity has profound implications for studies linking gray matter thickness to behavioral outcomes. Regions with lower longitudinal stability require larger sample sizes to detect true effects, and comparisons of effect sizes across regions must account for differential reliability [67].
Multi-Site Consortium Management Protocols
Structural Framework and Governance
Successful multi-site consortia require formalized collaboration structures with clearly defined governance models. Unlike informal collaborations, consortia operate under binding contractual frameworks that include mandatory progress reports and deliverables [68]. This formalization ensures consistency across sites and maintains commitment to common research objectives. The structural framework should include:
- Management and Data-Access Committees: Oversee operational implementation and data sharing protocols [68]
- Advisory Boards: Provide external expertise and guidance on scientific direction
- Designated Working Groups: Address specific methodological challenges such as harmonization of behavioral assessment
A key consideration in consortium formation is the composition of the team. While there is a tendency to collaborate with established networks, grant evaluators particularly in European Union funding contexts closely examine whether proposed team members meet the diverse needs of the project rather than representing similar fields and backgrounds [68].
Data Sharing and Harmonization Protocols
Effective data sharing is the cornerstone of successful multi-site collaborations. The following protocols ensure efficient and ethical data management:
- Open-Source Software Implementation: All analytical code should be maintained in shared repositories (e.g., GitHub) with stable versions made publicly available upon study completion [69]
- Middle-Ground Data Sharing Approaches: For sensitive neurobehavioral data, platforms such as the database of Genotypes and Phenotypes (dbGaP) provide appropriate access controls [69]
- Data Use Agreements (DUAs): Established a priori using standardized templates from organizations such as the Department of Health and Human Services or NASA [69]
- Common Data Elements: Behavioral measures must be standardized across sites with detailed protocols for administration and scoring
Relationship management presents particular challenges in consortia that may include business competitors or researchers with divergent theoretical orientations. Consortium managers may need to engage potential members separately to understand their priorities and contributions, then synthesize this information to create a joint framework that manages expectations and builds trust [68].
Experimental Protocols for Longitudinal Gray Matter Assessment
Image Acquisition and Quality Control
The Adolescent Brain Cognitive Development (ABCD) study provides a robust protocol template for large-scale longitudinal neuroimaging. While specific sequence parameters must be optimized for each study, the following quality control procedures are essential:
- Phantom Scanning: Regular scanning of standardized phantoms across all sites to monitor scanner drift
- Traveling Human Subjects: Subset of participants scanned across multiple sites to quantify cross-site variance
- Centralized Quality Control: Automated and manual inspection of image quality including contrast-to-noise ratios, motion artifact, and protocol adherence
For cortical thickness assessment, the Baltimore Longitudinal Study of Aging (BLSA) utilized T1-weighted spoiled gradient recall echo (SPGR) sequences with the following parameters: TR = 35ms, TE = 5ms, flip angle = 45°, image matrix = 256 × 256, field of view = 24cm, and voxel dimensions = 0.9375 × 0.9375 × 1.5mm [70]. Consistency in acquisition parameters must be maintained across all timepoints and sites.
Cortical Reconstruction and Thickness Measurement
The Cortical Reconstruction Using Implicit Surface Evolution (CRUISE) suite of algorithms provides a validated pipeline for automated cortical reconstruction [70]. The processing workflow includes:
- Fuzzy Tissue Classification: Robust to noise and intensity inhomogeneity artifacts, generating membership functions for white matter, gray matter, and cerebrospinal fluid [70]
- Ventricle and Subcortical Masking: Isolation of deep gray matter structures within white matter membership functions [70]
- Topology Correction: Graph-based algorithm removal of "holes" and "handles" from the white matter isosurface [70]
- Sulcal Cerebrospinal Fluid (CSF) Separation: Automatic editing of gray matter membership functions to create gaps between opposing sulcal banks [70]
- Surface Deformation: Topology-preserving geometric deformable surface model driven from the white matter surface to the pial surface [70]
Following cortical reconstruction, automated parcellation using reliability map approaches provides gyral-based regional definitions [70]. Validation studies should include manual tracing of a subset of regions to quantify accuracy and reliability.
Cortical Thickness Analysis Workflow: This diagram illustrates the standardized protocol for deriving reliable gray matter thickness measures from raw MRI data, highlighting critical quality control checkpoints.
Research Reagent Solutions for Cortical Thickness Analysis
Table 2: Essential Research Reagents and Computational Tools for Cortical Thickness Analysis
| Tool/Resource | Function | Application in Protocol |
|---|---|---|
| CRUISE Algorithm Suite | Automated cortical reconstruction from structural MRI | Generates surfaces at gray matter/white matter and gray matter/CSF boundaries [70] |
| Desikan-Killiany-Tourville Atlas | Standardized parcellation scheme for regional analysis | Provides gyral-based regions of interest with established test-retest reliability [67] |
| Destrieux Atlas | Alternative parcellation scheme with different regional definitions | Enables assessment of robustness across parcellation approaches [67] |
| Adaptive Bases Algorithm (ABA) | Deformable registration for cross-sectional alignment | Enables reliable mapping of atlas labels to individual subjects [70] |
| ICC Calculation Scripts | Computation of intraclass correlation coefficients | Quantifies longitudinal stability of thickness measures [67] |
| Quality Control Phantoms | Standardized objects for scanner calibration | Monitors scanner performance and drift across longitudinal assessments [70] |
Integrated Analysis Framework for Gray Matter-Behavior Associations
Modeling Longitudinal Change
Longitudinal investigations of 66 older adults in the BLSA revealed that age-related decline in cortical thickness is widespread but exhibits an anterior-posterior gradient, with frontal and parietal regions generally showing greater rates of decline than temporal and occipital regions [70]. Furthermore, sex differences in rates of change have been observed, with males showing greater decline in specific regions including the middle frontal, inferior parietal, and parahippocampal gyri [70].
Mixed effects regression models provide the most appropriate analytical framework for longitudinal cortical thickness data, as they can accommodate unbalanced designs and missing data [70]. These models should include both fixed effects (e.g., time, age, sex, behavioral measures) and random effects (e.g., subject-specific intercepts and slopes) to account for individual differences in trajectories of change.
Analytical Model for GM-Behavior Associations: This diagram illustrates the integration of multiple data sources in a mixed effects model to quantify the relationship between gray matter thickness and behavioral outcomes while accounting for confounding variables.
Accounting for Methodological Variability
Robust findings in gray matter-behavior research require explicit modeling of methodological sources of variance:
- Cross-Site Differences: Statistical models must include site as a covariate or employ batch correction methods, as differences in longitudinal stability across testing sites are largely driven by differences in error variance [67]
- Parcellation Effects: Analyses should demonstrate consistency across different parcellation schemes (e.g., Desikan-Killiany-Tourville vs. Destrieux) given documented differences in reliability [67]
- Scanner Effects: Longitudinal models should account for scanner upgrades or changes, which can introduce discontinuities in measurement
The integration of these methodological considerations with robust experimental protocols provides a comprehensive framework for ensuring reliability in longitudinal studies of gray matter thickness and behavioral outcomes, particularly within the context of multi-site consortia that offer the sample sizes necessary for adequately powered investigations of brain-behavior relationships.
For decades, research in behavioral neurobiology has established numerous correlations between brain structure and function. Observational studies have consistently shown that variations in gray matter thickness, cortical surface area, and limbic volume correlate with specific behavioral phenotypes and psychiatric conditions. However, correlation does not imply causation, and this fundamental limitation has obstructed both a mechanistic understanding of brain function and the development of targeted therapeutics. The establishment of causal links between brain structure and behavior represents a paradigm shift, moving beyond descriptive associations to predictive, mechanistic models. This transition is critically enabled by methodological advances in causal inference frameworks, particularly Mendelian randomization, and sophisticated neuroimaging protocols that can capture structural plasticity in response to intervention. This technical guide provides researchers and drug development professionals with the experimental frameworks and analytical tools necessary to demonstrate causality in brain-behavior relationships, with particular emphasis on gray matter morphology.
Foundational Evidence: Correlative and Causal Landscapes
The pursuit of causality must be grounded in a comprehensive understanding of established correlations. Structural magnetic resonance imaging (sMRI) studies have repeatedly identified key brain-behavior relationships, particularly involving gray matter, that serve as the foundational evidence requiring causal validation.
Key Structural Correlates of Behavior
Table 1: Established Correlations Between Brain Structure and Behavioral Phenotypes
| Brain Structure | Structural Metric | Behavioral Correlation | Clinical Context | Key References |
|---|---|---|---|---|
| Prefrontal Cortex | Cortical Thickness | Executive Function, Regulation | ADHD, Age-Related Cognitive Decline | [71] [72] |
| Limbic System (Amygdala, Hippocampus) | Gray Matter Volume (GMV) | Emotional Processing, Memory Formation | Major Depressive Disorder (MDD), Anxiety | [73] |
| Total Cortical Surface | Surface Area | Overall Cognitive Capacity, Suicide Risk | Adult Suicide Attempt | [71] [72] |
| Anterior Cingulate | Gray Matter Density | Error Detection, Conflict Monitoring | Chronic Pain, Depression | [73] |
Evidence of Structural Plasticity from Interventions
Critically, evidence that brain structure can be modified by experience or intervention provides a preliminary bridge from correlation toward causation. For instance, a naturalistic longitudinal study demonstrated that 20 sessions of Cognitive Behavioral Therapy (CBT) in patients with Major Depressive Disorder (MDD) induced significant gray matter volume (GMV) increases in the right anterior hippocampus and bilateral amygdala, while simultaneously decreasing volume in the right posterior hippocampus [73]. These structural changes were slightly associated with improvements in the affective component of alexithymia (Difficulty Identifying Feelings), providing a direct link between therapy-induced plasticity and improved emotional awareness [73]. This demonstrates that the adult brain retains a significant degree of structural plasticity that can be harnessed for therapeutic benefit.
Methodological Framework: Establishing Causality
Proving that a specific brain structural feature causes a behavioral outcome, rather than merely correlating with it, requires specialized methodologies that can account for confounding variables and reverse causation.
Mendelian Randomization (MR) for Causal Inference
Mendelian Randomization (MR) has emerged as a powerful statistical genetic technique for assessing causality in epidemiology and neurobiology. It uses genetic variants as instrumental variables to test the causal effect of an exposure (e.g., brain structure) on an outcome (e.g., behavior or disease risk).
- Core Principle: Genetic alleles are randomly assigned during meiosis, making them largely independent of confounding environmental factors. If a genetic variant influences an exposure, and the variant is also associated with an outcome, then a causal relationship between the exposure and outcome can be inferred.
- Application in Neurobiology: A 2025 study applied two-sample MR to summary data from genome-wide association studies (GWAS) for brain structure and suicide attempt. The analysis revealed a significant negative causal effect of total cortical surface area on suicide attempt risk in adults [71] [72]. This means that a smaller cortical surface area directly causes an increase in suicide risk, independent of other factors.
- Protocol Details:
- Instrument Selection: Identify genetic instruments (single nucleotide polymorphisms - SNPs) strongly associated (p < 5 × 10⁻⁸) with the brain structural exposure of interest (e.g., cortical surface area, average cortical thickness).
- Data Harmonization: Obtain and harmonize summary-level statistics (effect sizes, standard errors) for the selected instruments from both the exposure (brain structure) and outcome (behavior) GWAS.
- Causal Estimation: Apply an MR analysis model, such as the inverse-variance weighted (IVW) method, to estimate the causal effect.
- Sensitivity Analyses: Perform complementary analyses (MR-Egger, MR-PRESSO) to test for and adjust for pleiotropy (where a genetic variant influences the outcome through multiple pathways).
The following diagram illustrates the logical flow and core assumptions of the MR analysis used to establish these causal links.
Longitudinal Intervention Studies
While MR establishes genetic causality, longitudinal intervention studies demonstrate that modifying the brain leads to behavioral change. The previously mentioned CBT study provides a protocol for capturing this dynamic plasticity [73].
- Experimental Workflow: The protocol involves assessing GMV and clinical measures in patients before and after a controlled intervention, compared to healthy controls over a similar interval.
- Key Parameters:
- Participants: 30 MDD outpatients and 30 matched healthy controls (HC).
- Intervention: 20 sessions of manualized CBT.
- Time Interval: ~39 weeks for patients, ~34 weeks for HC.
- Imaging: Structural MRI at both time points (t1, t2).
- Clinical Measures: HDRS, BDI, and Toronto Alexithymia Scale (TAS20).
The workflow for such a longitudinal intervention study is detailed below.
Success in causal neurostructural research depends on a suite of specialized tools, from analytical software to validated experimental protocols.
Table 2: Research Reagent Solutions for Causal Brain-Behavior Studies
| Tool Category | Specific Tool / Resource | Function & Application | Key Features |
|---|---|---|---|
| Genetic Analysis | Two-Sample MR Pipeline | Tests for causal effects using summary-level GWAS data. | Controls for confounding; addresses reverse causation. [71] [72] |
| Neuroimaging Software | BrainNet Viewer | Visualizes topological patterns of brain networks as ball-and-stick models. | Flexible display of nodes/edges; supports multiple imaging modalities. [74] [75] |
| Image Processing | Statistical Parametric Mapping (SPM) | Preprocesses and analyzes brain imaging data; used for VBM. | Standardized workflow for GMV and cortical thickness estimation. |
| Longitudinal Protocol | CBT Intervention for MDD | A standardized 20-session protocol to induce structural plasticity. | Naturalistic design; linked to specific GMV changes in limbic regions. [73] |
| Clinical Assessment | Toronto Alexithymia Scale (TAS20) | Quantifies difficulty in identifying and describing feelings. | Captures specific emotional deficits linked to limbic GMV changes. [73] |
Data Interpretation and Translational Application
The ultimate value of establishing causal links lies in translating these findings into clinical applications and drug development strategies.
Interpreting Causal Findings Across the Lifespan
Causal relationships are not necessarily static throughout life. The same structural feature may have different causal roles at different developmental stages. For example, while total cortical surface area demonstrates a causal effect on suicide attempt risk in adults, this relationship is not found in older children (ages 9-10) [71] [72]. Instead, in this youth cohort, a thinner average cortical thickness (ACT) is causally associated with depression and internalizing psychopathology [72]. This highlights that brain markers for behavioral risk are instantiated differently across the lifespan, implying that screening, diagnostic, and therapeutic strategies must be age-specific.
Implications for Drug Development
For pharmaceutical researchers, these causal insights are transformative.
- Target Identification & Validation: Causal evidence elevates a brain structural feature from a biomarker to a direct drug target. For instance, establishing that increased amygdala GMV causes improved emotional identification validates pathways that promote amygdalar plasticity as high-priority targets for novel antidepressants [73].
- Clinical Trial Enrichment: Genetic instruments for brain structure can be used to stratify patient populations in clinical trials, enriching for those most likely to respond to a therapy that modulates that specific target.
- Endpoint Development: Structural measures like GMV, validated as causally central to a behavioral outcome, can serve as objective, quantifiable intermediate endpoints in early-phase trials, potentially reducing trial duration and cost compared to relying solely on long-term behavioral measures.
The journey beyond correlation to causation in brain-behavior research is complex but essential. By leveraging powerful causal inference methods like Mendelian randomization and rigorous longitudinal intervention designs, researchers can now assert with greater confidence that specific variations in brain structure, particularly gray matter morphology, directly cause changes in behavior and psychopathology. This causal framework provides a more solid foundation for understanding the biological basis of behavior and opens new, precisely targeted avenues for therapeutic intervention in neuropsychiatric disorders. The tools and protocols outlined in this guide provide a roadmap for researchers and drug developers to contribute to this evolving paradigm.
Confirming and Contextualizing Findings: Validation Across Methods and Models
In the field of neuroscience, and particularly in research investigating the link between brain structure and behavioral outcomes, individual studies often present conflicting or limited findings. Mega- and meta-analyses provide a powerful framework for synthesizing these results, offering more robust, generalizable insights into the neurobiological underpinnings of behavior and psychopathology. These methodologies are indispensable for translating scattered research findings into coherent knowledge that can inform clinical practice and drug development. By quantitatively aggregating data across multiple studies and thousands of participants, these approaches overcome the limitations of individual studies—including small sample sizes, methodological variations, and sampling biases—to reveal consistent patterns of gray matter alterations associated with psychiatric conditions and behavioral traits. This whitepaper examines the methodological rigor, key findings, and practical applications of these synthetic approaches in gray matter research.
Key Meta-Analytic Findings in Gray Matter Research
Recent large-scale meta-analyses have substantially advanced our understanding of brain structure-behavior relationships by applying sophisticated synthetic approaches across major psychiatric disorders and specific behavioral dimensions.
Comprehensive Atlas of Psychiatric Disorders
A landmark 2025 systematic review and meta-analysis created the most comprehensive atlas of gray matter volume (GMV) differences across major psychiatric conditions to date. This research incorporated 433 studies (499 datasets) involving 19,718 patients and 16,441 healthy controls, examining ten major disorder categories including schizophrenia spectrum, bipolar disorder, major depressive disorder, anxiety disorders, OCD, PTSD, ADHD, autism spectrum disorder, anorexia nervosa, and borderline personality disorder [76].
The study implemented a novel methodological approach that explicitly modeled co-occurring disorders, contrasting these results with standard meta-analyses that ignore comorbidities. This innovative methodology revealed that accounting for co-occurring disorders produced GMV correlates that were more focal and disorder-specific, with less correlation across disorders and fewer transdiagnostic abnormalities compared to standard approaches [76]. This finding has profound implications for developing more targeted therapeutic interventions.
Disorder-Specific Insights
Obsessive-Compulsive Disorder
A coordinate-based meta-analysis of 26 whole-brain MRI studies comprising 3,010 subjects (1,508 OCD patients, 1,502 controls) demonstrated significant GMV alterations that both support and extend the traditional cortico-striato-thalamo-cortical (CSTC) model of OCD [77]. The analysis revealed:
- GMV increases: Bilateral putamen, lateral globus pallidus, left parietal cortex, right pulvinar, and left cerebellum [77].
- GMV decreases: Right hippocampus/caudate, bilateral medial frontal gyri, and other cortical regions [77].
This pattern of volume increases predominantly in subcortical areas (with the exception of the left parietal cortex and cerebellar dentate) and decreases primarily in cortical regions (aside from the right hippocampus/caudate) provides a more nuanced understanding of OCD's neurostructural basis [77].
Problematic Usage of the Internet
The first quantitative synthesis of GMV studies in Problematic Usage of the Internet (PUI), encompassing 15 voxel-based morphometry studies with 355 individuals with PUI and 363 controls, identified significant spatial convergence in specific neural regions [78]. The meta-analysis found consistent GMV reductions in the medial/superior frontal gyri, left anterior cingulate cortex/cingulate gyrus, and left middle frontal/precentral gyri [78]. These regions are critically implicated in reward processing and top-down inhibitory control, suggesting potential mechanistic overlaps with other behavioral addiction disorders.
Autism Spectrum Disorder
A meta-analytic investigation of 25 years of voxel-based morphometry research in autism spectrum disorder (ASD) took the important step of disentangling gray matter volume (GMV) from gray matter concentration (GMC), which may reflect different underlying pathological mechanisms [79]. The findings revealed:
- Distinct and non-overlapping patterns for GMV and GMC measures [79].
- GMV decreases in the cerebellum [79].
- GMC decreases primarily in temporal and frontal regions [79].
- GMV increases in parietal, temporal, and frontal regions [79].
- GMC increases in the anterior cingulate cortex and middle frontal gyrus [79].
These findings emphasize the importance of considering GMV and GMC as distinct yet synergistic indices in neuropsychiatric research.
Behavioral Correlates: Optimism Bias
Beyond psychopathology, meta-analytic approaches have illuminated brain-behavior relationships in normal human psychology. A predictive modeling study using machine learning and gray matter cortical thickness successfully forecasted personal optimism bias (POB) from structural neuroimaging data [80]. The model explained 17% of the variance in individual POB variability, with key predictors including the rostral-caudal anterior cingulate cortex, pars orbitalis, and entorhinal cortex [80]. This demonstrates how synthetic approaches can reveal the neurostructural basis of fundamental psychological traits.
Table 1: Key Meta-Analytic Findings in Gray Matter Research
| Condition/Disorder | Number of Studies/Subjects | Key Gray Matter Alterations | Clinical/Behavioral Correlates |
|---|---|---|---|
| Multiple Psychiatric Disorders [76] | 433 studies (19,718 patients, 16,441 controls) | More focal, disorder-specific correlates when co-occurring disorders modeled | Disorder-specific biomarkers for diagnostic precision |
| Obsessive-Compulsive Disorder [77] | 26 studies (1,508 patients, 1,502 controls) | Increases: bilateral putamen, pallidus; Decreases: right hippocampus, medial frontal gyri | Supports and extends CSTC model of OCD |
| Problematic Internet Use [78] | 15 studies (355 patients, 363 controls) | Reductions: medial/superior frontal gyri, ACC, middle frontal/precentral gyri | Reward processing and inhibitory control deficits |
| Autism Spectrum Disorder [79] | 25 years of VBM research | Distinct patterns for GMV (cerebellar decreases) and GMC (temporal/frontal decreases) | Differential relationship to memory/social vs. sensory/executive functions |
| Optimism Bias [80] | 45 participants | Cortical thickness in rACC, cACC, pars orbitalis, entorhinal cortex predicts optimism | Positive psychology and well-being |
Methodological Protocols
The validity and reliability of meta-analytic findings depend critically on rigorous methodological protocols. This section details the standard approaches and quality control measures employed in comprehensive neuroimaging meta-analyses.
Literature Search and Study Selection
Systematic reviews begin with comprehensive literature searches across multiple electronic databases (typically PubMed, Scopus, PsycINFO) using syntaxes tailored to capture all relevant neuroimaging studies [76] [78]. The selection process follows a two-stage approach:
- Initial screening of titles and abstracts to exclude clearly irrelevant studies, non-peer-reviewed publications, and non-English manuscripts [78].
- Eligibility assessment of full texts based on predetermined inclusion criteria:
To minimize selection bias, reference lists of included studies and relevant reviews are typically hand-searched [78]. When concerns about overlapping samples arise, authors are contacted for clarification, and the study with the largest sample is included [78].
Data Extraction and Quality Assessment
Standardized procedures are employed for data extraction and quality assessment:
- Independent extraction by multiple researchers to ensure accuracy [76].
- Quality assessment using standardized tools such as the Newcastle-Ottawa Scale [76].
- Coordinate extraction of peak coordinates with visualization using tools like BrainNet Viewer [78].
- Handling of multiple experiments from the same subject group by combining results to ensure a maximum of two experiments per subject group (increases and decreases in gray matter) [78].
Statistical Analysis and Meta-Analytic Techniques
Different meta-analytic techniques are employed based on the available data and research questions:
- Anatomical Likelihood Estimation (ALE): A coordinate-based meta-analysis technique that tests for significant spatial convergence of foci between experiments, modeling foci as peaks of three-dimensional Gaussian distributions to represent spatial uncertainty [78].
- Multidisorder meta-analysis: A novel approach that models all co-occurring mental disorders simultaneously to derive disorder-specific GMV correlates [76].
- Cluster-level family-wise error correction: Typically applied with a cluster-forming threshold of p < .001 at the voxel level and p < .05 at the cluster level [78].
- Jackknife sensitivity analysis: Repeated meta-analyses leaving out one experiment each time to assess the robustness of results [78].
Table 2: Essential Methodological Components of Neuroimaging Meta-Analyses
| Methodological Component | Key Features | Purpose |
|---|---|---|
| Systematic Literature Search [76] [78] | Multi-database search, predefined search syntax, hand-searching of references | Comprehensive identification of relevant studies |
| Quality Assessment [76] | Standardized tools (Newcastle-Ottawa Scale), independent assessment by multiple researchers | Evaluation of study methodology and potential biases |
| Coordinate-Based Meta-Analysis [78] | Anatomical Likelihood Estimation (ALE), Gaussian modeling of spatial uncertainty | Identification of consistent spatial patterns across studies |
| Sensitivity Analysis [78] | Leave-one-out jackknife approach, subgroup analyses | Testing robustness and reliability of findings |
| Novel Modeling Approaches [76] | Simultaneous modeling of co-occurring disorders, multidisorder meta-analysis | Disentangling disorder-specific from transdiagnostic effects |
Experimental Visualization
The following diagrams illustrate key methodological workflows and conceptual frameworks in neuroimaging meta-analyses, created using Graphviz with the specified color palette.
Neuroimaging Meta-Analysis Workflow
CSTC Circuit in OCD
Transdiagnostic vs. Disorder-Specific GMV
The Scientist's Toolkit
Table 3: Essential Research Reagents and Tools for Gray Matter Meta-Analyses
| Tool/Resource | Function/Purpose | Example Applications |
|---|---|---|
| Voxel-Based Morphometry (VBM) [76] [78] [77] | Computational approach to detect regional differences in gray matter volume | Primary method for quantifying structural differences in individual studies |
| Anatomical Likelihood Estimation (ALE) [78] | Coordinate-based meta-analysis technique for identifying spatial convergence | Synthesizing peak coordinates across multiple neuroimaging studies |
| GingerALE Software [78] | Implementation of ALE algorithm for neuroimaging meta-analysis | Statistical testing of spatial convergence across experiments |
| Newcastle-Ottawa Scale [76] | Quality assessment tool for evaluating methodological quality of included studies | Quality control in systematic reviews and meta-analyses |
| BrainNet Viewer [78] | Brain network visualization tool for displaying coordinate data | Visualization of extracted peak coordinates and results |
| NIfTI Maps [76] | Standard neuroimaging format for sharing results | Distribution of GMV correlate maps for future research |
Mega- and meta-analyses represent a paradigm shift in neuroscience research, transforming fragmented findings into coherent knowledge about brain-behavior relationships. The synthesized evidence demonstrates that these approaches consistently identify robust, replicable patterns of gray matter alterations across psychiatric conditions and behavioral dimensions. The methodological innovations in this field—particularly the ability to model co-occurring disorders and distinguish between different gray matter metrics—have significantly advanced our understanding of disorder-specific versus transdiagnostic neural correlates. For researchers and drug development professionals, these synthetic approaches provide a more solid foundation for identifying biomarkers, understanding disease mechanisms, and developing targeted interventions. As these methodologies continue to evolve with more sophisticated statistical techniques and larger collaborative datasets, they will undoubtedly yield further insights into the intricate relationships between brain structure and behavioral outcomes.
The pursuit of biomarkers for behavioral outcomes in neurological and psychiatric research has progressively shifted from a focus on isolated brain regions to a comprehensive, multi-level systems approach. Investigations relying solely on gray matter (GM) structure, such as those measuring cortical thickness or volume, often yield inconsistent results across studies, limiting their clinical applicability [81]. The paradigm of multimodal convergence addresses this by integrating structural data with complementary neuroimaging modalities to elucidate the complex relationships between brain anatomy, large-scale network function, and underlying neurochemistry. This whitepaper provides a technical guide for researchers and drug development professionals on the core methodologies, analytical frameworks, and key findings in this field, with an emphasis on correlating GM structure with functional and neurochemical data to inform behavioral outcomes.
Core Analytical Frameworks and Methodologies
Functional Connectivity Network Mapping (FCNM)
FCNM is a meta-analytic technique designed to reconcile heterogeneous findings from voxel-based morphometry (VBM) studies. It projects reported coordinates of GM alterations onto normative whole-brain connectome data, revealing convergence onto common functional networks [81].
- Workflow: The process begins with a systematic literature search to identify relevant VBM studies. Peak coordinates of GM correlates are extracted and used as seeds in a large-scale normative resting-state functional MRI (rs-fMRI) dataset, such as the Human Connectome Project (HCP). The functional connectivity profiles of these seeds are computed and compared to templates of canonical brain networks (e.g., Yeo's 7-network atlas) to identify the networks with the strongest spatial overlap [81].
- Application: A study on the personality trait extraversion found that despite initial heterogeneity, GM correlates consistently mapped onto the frontoparietal network (FPN), involved in cognitive control, and the default mode network (DMN), involved in self-referential thought [81].
Coordinate-Based Meta-Analysis and Lesion Network Mapping
This approach identifies convergent GM alterations across multiple studies or disorders and characterizes their impact on brain networks.
- Anatomical Likelihood Estimation (ALE): A coordinate-based meta-analysis method that identifies regions showing consistent GM differences across independent experiments. It models the reported foci as probability distributions and tests for convergence beyond spatial chance [8].
- Extended Network Characterization: Once convergent GM regions are identified via ALE, their functional connectivity profiles are delineated using both resting-state data and meta-analytic co-activation maps. This defines an "extended network" of regions that are functionally coupled to the structurally altered areas, providing a more complete picture of the impacted circuitry [8].
- Application: A meta-analysis of substance use disorders found convergent GM reductions in medial frontal, anterior cingulate, and insular regions. The extended network of these areas included nodes of the DMN, salience network, and executive control network, offering a network-level explanation for cognitive and affective symptoms [8].
Neurotransmitter Receptor Architecture Mapping
This technique bridges the gap between macroscale brain networks and molecular signaling by examining the spatial correspondence between functional networks and neurotransmitter systems.
- Tools: The JuSpace toolbox is a prominent platform for this analysis. It allows for the cross-correlation of a given brain map (e.g., an FCNM-derived network) with a library of positron emission tomography (PET) templates of various neurotransmitter receptors and transporters [81].
- Protocol: The spatial map of the target network is correlated with the density maps of multiple neurotransmitters. Significance is typically assessed through permutation testing. This reveals whether a specific network has a spatial architecture that is enriched for particular neurochemical systems [81].
- Application: The extraversion-linked DMN and FPN showed significant positive spatial correlations with serotonin 5-HT2A, cannabinoid CB1, and metabotropic glutamate mGluR5 receptors, and negative correlations with the norepinephrine transporter (NAT) and serotonin transporter (SERT) [81].
Functional Contrast at the Gray-White Matter Boundary
Emerging methods seek to quantify the functional relationship between GM and adjacent white matter (WM), which is crucial for understanding signal transmission.
- Gray-White Matter Functional Connectivity (GWFC): Measures the temporal synchrony (Pearson correlation) of the BOLD signal between a GM point and its adjacent WM point perpendicular to the boundary. It is proposed to reflect the fidelity of signal transmission across this interface and is positively correlated with cortical myelination [82].
- Gray-White BOLD Power Ratio (GWBPR): Calculates the ratio of the fractional amplitude of low-frequency fluctuations (fALFF) between GM and WM points. It reflects differences in signal amplitude and metabolic demand, showing an inverse relationship with myelination and increasing with age in higher-order association cortices [82].
Table 1: Key Analytical Frameworks in Multimodal Convergence Research
| Framework | Primary Data Input | Output | Primary Application |
|---|---|---|---|
| Functional Connectivity Network Mapping (FCNM) | VBM coordinates; Normative rs-fMRI data | Mapping of GM correlates onto common functional networks (e.g., DMN, FPN) | Reconciling heterogeneous structural findings; identifying plausible functional substrates [81] |
| Coordinate-Based Meta-Analysis (ALE) | Reported coordinates from multiple studies | Map of convergent GM alterations across studies/disorders | Identifying robust, trans-diagnostic structural biomarkers [8] |
| Neurotransmitter Mapping (JuSpace) | Spatial brain network maps (e.g., from FCNM) | Spatial correlations with neurotransmitter receptor/transporter density | Linking macroscale networks to molecular systems for drug target identification [81] |
| Gray-White Matter Functional Contrast | High-resolution rs-fMRI data | Metrics of functional coupling (GWFC) and metabolic contrast (GWBPR) at GM-WM boundary | Investigating integrity of local signal transmission and neurovascular/metabolic health [82] |
Signaling Pathways and Workflow Visualization
Experimental Workflow for Multimodal Correlation Analysis
The following diagram outlines a standardized pipeline for conducting a study that correlates GM structure with functional and neurochemical data.
Diagram 1: Workflow for multimodal correlation analysis, showing the sequence from data collection to integrated results.
Neurochemical Signaling Pathways in Identified Networks
This diagram illustrates the key neurotransmitter systems implicated in personality-related networks and their potential interactions, based on spatial correlation findings.
Diagram 2: Neurochemical systems associated with GM networks, showing positive and negative spatial correlations.
Key Findings and Quantitative Data Synthesis
Empirical studies applying these multimodal frameworks have yielded robust, systems-level insights into brain-behavior relationships.
Table 2: Convergent GM Alterations and Network Associations in Substance Use Disorders (Meta-Analysis) [8]
| Drug Class | Consistently Altered GM Regions | Extended Functional Network Nodes | Implicated Large-Scale Networks |
|---|---|---|---|
| Alcohol, Nicotine, Cocaine,\nMethamphetamine, Cannabis | Medial Frontal / vmPFC, Anterior Cingulate Cortex (ACC), Insula | ACC, Inferior Frontal Gyrus, Posterior Cingulate Cortex (PCC), Insula, Superior Temporal Gyrus, Putamen | Salience Network (dACC, Caudate),\nExecutive Control Network (dlPFC, Parietal),\nDefault Mode Network (PCC, Angular) |
| Alcohol-Specific | Dorsal ACC, Inferior Frontal Gyrus, Postcentral Gyrus | - | - |
Table 3: Neurotransmitter Correlations with Extraversion-Linked Networks [81]
| Neurotransmitter Receptor/Transporter | Spatial Correlation with DMN/FPN | p-value | Correlation Coefficient (r) |
|---|---|---|---|
| Serotonin Receptor 2A (5HT2a) | Positive | 0.021 | 0.215 |
| Cannabinoid Receptor 1 (CB1) | Positive | 0.005 | 0.392 |
| Metabotropic Glutamate Receptor 5 (mGluR5) | Positive | 0.01 | 0.330 |
| Norepinephrine Transporter (NAT) | Negative | 0.018 | -0.221 |
| Serotonin Transporter (SERT) | Negative | 0.023 | -0.201 |
Table 4: Functional Contrast Metrics at the Gray-White Matter Boundary [82]
| Metric | Definition | Association with Myelin Content | Association with Sensorimotor-Association Axis |
|---|---|---|---|
| Gray-White Matter Functional Connectivity (GWFC) | Temporal synchrony of BOLD signals across GM-WM boundary | Positive correlation (r=0.40) | Higher in sensorimotor regions |
| Gray-White BOLD Power Ratio (GWBPR) | Ratio of signal amplitude (fALFF) between GM and WM | Negative correlation | Higher in transmodal (association) regions |
The Scientist's Toolkit: Essential Research Reagents
Successful execution of multimodal convergence research requires a suite of analytical tools and data resources.
Table 5: Essential Reagents and Resources for Multimodal Research
| Tool/Resource | Type | Primary Function | Key Application in Workflow |
|---|---|---|---|
| Human Connectome Project (HCP) | Data Repository | Provides high-quality normative neuroimaging data (rs-fMRI, dMRI, structural) | Source of connectome data for FCNM and functional connectivity analysis [81] |
| JuSpace Toolbox | Software Tool | Computes spatial correlations between brain maps and neurotransmitter systems | Neurotransmitter architecture mapping of identified networks [81] |
| SDM/AES-SDM | Software Tool | Performs coordinate-based meta-analysis (e.g., ALE) | Identification of convergent GM alterations across studies [66] [8] |
| FreeSurfer | Software Suite | Processes structural MRI data for cortical thickness and subcortical volume | Generation of subject-level GM metrics for mega-analysis [6] |
| DPABI/SPM | Software Toolboxes | Preprocess and analyze functional and structural MRI data | Data preparation, normalization, and statistical modeling [81] |
| Graph Neural Networks (GNNs) | Analytical Framework | Models non-Euclidean relationships in complex data (e.g., brain connectomes) | Advanced fusion of multimodal data for predictive modeling [83] |
| Transformers | Analytical Framework | Parallelized computation for sequential or multi-input data using self-attention | Integrating clinical notes, imaging, and genomic data [83] |
The multimodal convergence of GM structure with functional connectivity and neurochemical data represents a powerful paradigm shift in neuroscience. By moving beyond isolated regional associations, this approach provides a more coherent and biologically plausible framework for linking brain structure to behavior. The methodologies outlined—FCNM, neurotransmitter mapping, and functional contrast analysis—provide researchers and drug developers with a robust toolkit for identifying system-level biomarkers. The consistent findings of convergence onto canonical networks like the DMN, FPN, and salience network, which are enriched for specific neurotransmitter systems, offer compelling targets for therapeutic intervention. Future progress will be fueled by the adoption of even more sophisticated computational models, such as graph neural networks and transformers, enabling a truly integrative understanding of the brain's structure-function-chemistry relationships.
The integration of large language models (LLMs) into neuroscience represents a paradigm shift in how researchers analyze complex brain-behavior relationships. This whitepaper examines the emerging capacity of LLMs to predict neuroscientific outcomes, with specific focus on gray matter thickness associations with behavioral outcomes. While LLMs demonstrate remarkable capabilities in pattern recognition and abstract reasoning tasks relevant to neuroscience, current evidence reveals both significant alignment with human neurocognition and notable divergences in social decision-making contexts. For research and drug development professionals, these technologies offer promising tools for accelerating discovery but require careful validation against human expertise and established neurobiological principles. The following analysis provides a comprehensive technical assessment of LLM capabilities, experimental methodologies, and practical implementation frameworks for evaluating these artificial intelligence systems against human expert benchmarks in neuroscience research.
Neuroscience faces unprecedented challenges in interpreting complex, high-dimensional data from various imaging modalities, behavioral assessments, and molecular analyses. Traditional statistical approaches often struggle to capture the nonlinear relationships inherent in brain-behavior mappings, creating opportunities for advanced artificial intelligence systems. LLMs, particularly transformer-based architectures, have recently demonstrated capabilities extending beyond natural language processing to include abstract reasoning and pattern recognition tasks fundamental to neuroscientific inquiry [84]. Simultaneously, the field continues to make robust findings linking brain structure to behavior, such as correlations between left temporal fusiform cortex gray matter volume and attention performance in traumatic brain injury patients, demonstrating the continued importance of established neuroscientific relationships [85]. This creates a critical juncture for benchmarking LLM capabilities against human expertise in predicting neuroscientific outcomes, particularly within the well-established research domain of gray matter thickness and its behavioral correlates.
Current Capabilities of LLMs in Neuroscientific Prediction
Performance Benchmarks Across Cognitive Domains
Table 1: LLM Performance on Neuroscientifically-Relevant Tasks
| Task Domain | Human Benchmark | LLM Performance | Notable Discrepancies | Citation |
|---|---|---|---|---|
| Abstract Reasoning (Pattern Completion) | Human-comparable accuracy on abstract patterns | Qwen-2.5-72B & DeepSeek-R1-70B achieve human-level accuracy | Smaller models (≤13B parameters) show significantly lower performance | [84] |
| Social Decision-Making (Kinship Contexts) | Heightened risk-seeking in small/kin groups | GPT-4o shows opposite pattern (less risk-seeking in kin groups) | LLMs show reversed sensitivity to evolutionarily relevant social cues | [86] |
| Financial Risk Preference | Risk-averse in gains, risk-seeking in losses (Prospect Theory) | GPT-3.5 shows reversed framing effects; GPT-4 indiscriminately risk-averse | Fundamental differences in risk perception architecture | [86] |
| Moral Decision-Making | Context-sensitive fairness perceptions | GPT-3.5 aligns with human choices but is more rule-based | Reduced sensitivity to in-group fairness violations | [86] |
Neural Alignment with Human Brain Representations
Beyond behavioral outputs, recent investigations have examined whether LLMs develop internal representations that align with human neural processing. Studies comparing layer-wise activations in LLMs to neuroimaging data have found that intermediate layers of instruction-tuned models show the highest correlation with brain activity patterns recorded via fMRI during naturalistic story listening tasks [84]. This suggests that the internal representations that emerge in certain LLM architectures may partially mirror the organizational principles of biological neural systems, particularly for abstract reasoning tasks [84].
However, this alignment appears task-dependent. While LLMs show promising neural alignment during linguistic and abstract reasoning tasks, they demonstrate significant divergences in social and moral decision-making contexts where human responses are shaped by evolutionary pressures, kinship considerations, and visceral emotional processes [86]. This indicates that current LLMs may capture certain aspects of human cognitive architecture while lacking foundational components of human social intelligence.
Experimental Protocols for Benchmarking LLMs
Experimental Workflow: Abstract Pattern Completion Task
Methodological Details: This protocol evaluates abstract reasoning capabilities using pattern completion tasks. Human participants complete abstract pattern problems while fixational-related potentials (FRPs) are recorded via electroencephalography (EEG) to capture neural representations during reasoning [84]. Concurrently, multiple LLMs (varying in parameter size from 7B to 70B) complete identical tasks while layer-wise activations are extracted. Critical analysis steps include:
- Accuracy profiling comparing human and model performance across pattern types
- Difficulty alignment assessing whether models find the same patterns challenging as humans
- Representational similarity analysis (RSA) comparing neural representations (from FRPs) with model internal representations across layers [84]
The largest LLMs (70B parameters) in these paradigms achieve human-comparable accuracy and show similarity with human pattern-specific difficulty profiles, with representational geometries of task-optimal LLM layers showing moderate positive correlations with human frontal FRPs [84].
Social Decision-Making Benchmarking Protocol
Experimental Workflow: Social Context Risk Preference Assessment
Methodological Details: This protocol evaluates social decision-making using 51 scenarios assessing risk preference across varied social contexts [86]. The experimental framework is grounded in evolutionary psychology, testing sensitivity to kinship, group size, and verbal framing. Key methodological components include:
Scenario development creating matched pairs of gain/loss framed dilemmas across:
- Kinship contexts (close genetic relatives vs. strangers)
- Group size variations (small groups vs. large populations)
- Property domains (public goods vs. personal investments)
Data collection from human participants (N=2,104) providing baseline behavior [86]
LLM testing with standardized prompting across multiple model versions (GPT-3.5, GPT-4, GPT-4o)
Analysis focusing on fundamental differences in decision architecture:
- Humans show Prospect-consistent risk preferences (aversion in gains, seeking in losses)
- LLMs frequently show reversed or inconsistent framing effects
- Humans demonstrate heightened risk-seeking in small/kin groups where LLMs show opposite patterns [86]
The Scientist's Toolkit: Research Reagent Solutions
Table 2: Essential Resources for LLM-Neuroscience Research
| Research Reagent | Function/Purpose | Example Implementation | Technical Considerations |
|---|---|---|---|
| Open-Source LLMs (Various Sizes) | Benchmarking scale-performance relationships | Qwen-2.5-72B, DeepSeek-R1-70B for high-performance; 7B-13B models for efficiency tradeoffs | Parameter count correlates with reasoning capability; 70B parameters needed for human-level abstract reasoning [84] |
| Representational Similarity Analysis (RSA) | Quantifying alignment between neural and model representations | Comparing human fMRI/EEG data with layer-wise LLM activations | Intermediate layers typically show highest brain alignment; task-optimized layers provide clearest signals [84] |
| EEG with Fixation-Related Potentials (FRPs) | Capturing neural processing during cognitive tasks | Recording neural representations during abstract reasoning tasks | Provides temporal precision for tracking reasoning processes; correlates with LLM layer activations [84] |
| Standardized Social Decision-Making Battery | Assessing evolutionarily-relevant social cognition | 51-scenario framework testing kinship, group size, and framing effects | Essential for identifying fundamental architecture differences between human and artificial intelligence [86] |
| Pairwise Interaction Statistics Library | Benchmarking functional connectivity methods | 239 pairwise statistics for comparing time-series relationships | Different statistics capture distinct aspects of neural interaction; precision-based metrics often outperform correlation [87] |
Analytical Framework for Gray Matter-Behavior Predictions
When considering the specific context of gray matter thickness associations with behavioral outcomes, LLMs must be evaluated against established neurological findings. For instance, human expertise has established that left temporal fusiform cortex gray matter volume correlates with changes in attention index scores in TBI patients (rₛ = 0.756, p = 0.011), and fractional anisotropy in the genu of the corpus callosum strongly correlates with attention improvements (rₛ = 0.811, p = 0.004) [85]. These established brain-behavior relationships provide critical benchmarks for evaluating LLM predictive capabilities.
The predictive utility of LLMs in this domain likely depends on their capacity to integrate multimodal data streams. Rather than simply predicting behavioral outcomes from structural neuroimaging data alone, effective models would need to incorporate the complex interactions between gray matter integrity, white matter connectivity, and cognitive performance metrics. Current evidence suggests that while LLMs can identify robust statistical relationships in high-dimensional datasets, they may lack the theoretical constraints necessary to respect neurobiological boundaries that human experts naturally incorporate in their predictions.
Implications for Drug Development and Clinical Translation
In pharmaceutical development, particularly for central nervous system disorders, neuroimaging plays an increasingly crucial role in de-risking drug development by providing objective measures of target engagement, dose selection, and patient stratification [88] [89]. LLMs with demonstrated capabilities in predicting neuroscientific outcomes could significantly accelerate this process through:
- Enhanced Patient Stratification: Identifying biomarker-defined patient subgroups most likely to respond to specific interventions [88]
- Target Engagement Optimization: Predicting optimal dosing based on modeled relationships between drug exposure, target engagement, and functional outcomes [90]
- Clinical Trial Enrichment: Selecting patient populations with specific gray matter characteristics predictive of treatment response [89]
However, the current limitations in social decision-making prediction suggest caution in applying these models to disorders where social cognition is central (e.g., autism spectrum disorders, schizophrenia). The demonstrated divergences in risk perception and social context integration indicate that LLMs may not yet adequately capture the nuanced social-behavioral relationships necessary for predicting outcomes in these domains.
LLMs represent powerful new tools for predicting neuroscientific outcomes, with demonstrated capabilities in abstract reasoning and pattern completion tasks that approach or exceed human performance in specific domains. However, significant divergences remain, particularly in social decision-making contexts where human intelligence has been shaped by evolutionary pressures. For researchers and drug development professionals, these technologies offer substantial opportunities for accelerating discovery and improving clinical translation, but require careful validation against human expertise and established neurobiological principles. The comprehensive benchmarking frameworks and experimental protocols outlined in this whitepaper provide a foundation for rigorously evaluating these rapidly advancing technologies against the gold standard of human expertise in neuroscience.
Gray matter (GM) alterations serve as key neurobiological markers in both neurological and psychiatric disorders, yet the patterns of these changes exhibit significant pathophysiological distinctions. This whitepaper synthesizes current neuroimaging research to contrast GM alterations across diagnostic categories, framing these structural changes within the context of behavioral outcomes research. Understanding these divergent patterns is crucial for advancing diagnostic precision, developing targeted therapeutics, and elucidating the biological mechanisms underlying behavioral manifestations. The comparative analysis presented herein reveals disorder-specific GM signatures that correspond to distinct clinical profiles, cognitive deficits, and behavioral outcomes, providing a neuroanatomical foundation for precision medicine approaches in neurology and psychiatry.
Comparative Analysis of GM Alterations Across Disorders
Psychiatric Disorders
Table 1: Gray Matter Alterations in Psychiatric Disorders
| Disorder | Key Brain Regions with GM Alterations | Direction of Change | Clinical/Behavioral Correlates |
|---|---|---|---|
| Psychosis in Forensic Populations [91] | Bilateral insular cortex, Left superior temporal gyrus (STG), Right fusiform gyrus | Volume reduction | Correlated with psychiatric symptom severity (BPRS); violent behavior |
| Schizophrenia (Formal Thought Disorder) [92] | Superior/Middle temporal gyri, Inferior frontal gyrus (Broca's area), Anterior cingulate cortex | Volume reduction & increased gyrification | Positive FTD: disorganized speech; Negative FTD: poverty of speech |
| Major Depressive Disorder (MDD) [93] [94] | Prefrontal cortex, Anterior cingulate cortex, Middle frontal cortex | Volume reduction | Emotional dysregulation, anhedonia, cognitive impairments |
| Primary Insomnia (PI) [94] | Right superior temporal gyrus, Left striatum, Median cingulate/paracingulate gyri | Volume increase & decrease | Hyperarousal, sleep maintenance difficulties |
In psychiatric populations, GM alterations consistently involve regions governing emotional regulation, salience detection, and higher-order cognition. Patients with psychotic disorders who committed violent crimes exhibit GM volume reductions in bilateral insular cortex and left superior temporal gyrus, with these reductions significantly correlating with psychiatric symptom severity on the Brief Psychiatric Rating Scale (BPRS) but not with psychopathy traits [91]. This pattern suggests that psychotic symptomatology, rather than personality factors, primarily drives the neuroanatomical changes in this population.
Schizophrenia patients with formal thought disorder (FTD) demonstrate differential structural correlates for positive versus negative symptom dimensions. Positive FTD (disorganized speech) correlates with increased local gyrification in core language regions including temporal, Heschl's, and inferior frontal gyri, suggesting altered early neurodevelopment. In contrast, negative FTD (poverty of speech) inversely correlates with gyrification in occipital and parietal regions [92]. This dissociation highlights how qualitatively different behavioral manifestations within the same disorder arise from distinct neuroanatomical substrates.
The comparison between MDD and primary insomnia reveals both overlapping and distinct GM patterns. While both disorders share functional alterations in limbic and temporal circuits, they exhibit structural divergence in GM volume. Specifically, PI shows smaller GM volume in the left striatum and median cingulate/paracingulate gyri but greater GM volume in the right STG compared to MDD [94]. These structural differences may represent potential biomarkers for differential diagnosis between these commonly comorbid conditions.
Neurological and Other Disorders
Table 2: Gray Matter Alterations in Neurological and Other Disorders
| Disorder | Key Brain Regions with GM Alterations | Direction of Change | Clinical/Behavioral Correlates |
|---|---|---|---|
| Alzheimer's Disease (with NPS) [95] | Prefrontal cortex, Medial temporal lobe, Orbitofrontal cortex, Parahippocampal regions | Volume reduction | Apathy, affective symptoms, psychosis, hyperactivity |
| Idiopathic Dystonia [96] | Right insula (modulated by disease duration) | No consistent alterations | Movement abnormalities, lack of consistent GM correlates |
| Developmental Stuttering [97] | Right BA45 (Broca's area homologue), Cerebellum, Striatum | Sex-specific increases/decreases | Speech dysfluency, sex-dependent neural patterns |
| Youth Pain Experiences [98] | Bilateral precentral gyri, Right postcentral gyrus, Right inferior parietal gyrus | Volume reduction | Higher pain scores in community youth sample |
In neurological populations, GM alterations demonstrate more variable patterns that often correspond to specific functional systems. Alzheimer's disease with neuropsychiatric symptoms (NPS) shows GM loss in prefrontal and medial temporal regions, with the specific distribution of atrophy correlating with symptom profiles such as apathy, affective symptoms, psychosis, and hyperactivity [95]. This aligns with the known cognitive and behavioral deficits in AD and underscores the relationship between regional GM loss and specific behavioral manifestations.
Notably, some neurological conditions show inconsistent GM alterations despite significant functional impairment. Idiopathic dystonia, despite being the third most prevalent movement disorder worldwide, demonstrates no reliable GM alterations across multiple voxel-based morphometry studies [96]. This suggests the pathophysiology may primarily involve functional rather than structural abnormalities, or that GM changes are too subtle or variable to detect consistently with current methodologies.
Developmental stuttering exhibits sex-specific GM patterns in speech and language networks. Men who stutter show larger GM volume in right BA45 compared to fluent men, while women who stutter show smaller GM volume in this region compared to fluent women [97]. This finding highlights the importance of considering demographic factors like sex when investigating brain-behavior relationships, as the same behavioral condition may manifest through distinct neuroanatomical substrates across subgroups.
Youth experiencing pain show GM alterations primarily in sensorimotor and parietal regions, with the right inferior parietal gyrus emerging as the most robust correlate independent of global brain effects [98]. This suggests that even subjective experiences like pain have detectable GM correlates, though these relationships may be more subtle in developing brains compared to adults with chronic pain conditions.
Experimental Protocols and Methodologies
Voxel-Based Morphometry (VBM) Protocol
The most consistently applied methodology across the surveyed literature is voxel-based morphometry, a comprehensive technique for quantifying GM volume differences across the entire brain [91] [96]. The standard protocol involves:
Image Acquisition: High-resolution T1-weighted structural images are acquired using 3T MRI scanners with magnetization-prepared rapid gradient echo (MPRAGE) sequences. Typical parameters include: 176 slices, slice thickness of 1mm, in-plane resolution of 0.5×0.5mm, repetition time of 1900ms, and echo time of 2.93ms [91].
Image Preprocessing: Using statistical parametric mapping (SPM) software with Computational Anatomy Toolbox (CAT12), images undergo spatial normalization using high-dimensional Diffeomorphic Anatomical Registration Through Exponentiated Lie Algebra (DARTEL), which improves alignment across individuals. Images are then segmented into GM, white matter, and cerebrospinal fluid [91].
Modulation and Smoothing: The segmented GM images are modulated to preserve tissue volume after spatial normalization. Smoothing is then applied with an 8mm full-width half-maximum Gaussian kernel to improve normality and compensate for residual anatomical differences [91].
Statistical Analysis: Whole-brain voxel-wise comparisons between groups are conducted using general linear models, covarying for age and total intracranial volume. Results are typically thresholded at p<0.05, corrected for multiple comparisons using false discovery rate (FDR) at the cluster level, with a cluster-forming threshold of p<0.001 [91].
Correlation with Clinical Measures: Regional GM values from significant clusters are extracted to conduct correlation analyses with clinical measures such as symptom severity scales, using Pearson or Spearman correlations depending on data distribution [91].
Multi-Parameter Cortical Analysis
Advanced protocols for investigating cortical architecture employ multiple morphological measures to capture different neurobiological processes:
Image Acquisition and Processing: Similar to VBM, high-resolution T1-weighted images are acquired but processed using surface-based methods in software such as FreeSurfer to extract multiple cortical measures [92].
Cortical Measure Extraction: The protocol simultaneously extracts four distinct cortical parameters:
- Cortical thickness: Distance between pial and white matter surfaces, reflecting microstructural organization
- Surface area: Total area of the pial surface, largely determined during prenatal development
- Cortical volume: Product of thickness and surface area
- Local gyrification index: Measure of cortical folding complexity established during early brain development [92]
Statistical Analysis: Multiple regression models assess relationships between cortical measures and clinical dimensions, controlling for age, sex, and intracranial volume. False discovery rate correction addresses multiple comparisons across vertices and hemispheres [92].
This multi-parameter approach is particularly valuable for distinguishing between neurodevelopmental alterations (reflected in gyrification and surface area) and experience-dependent plasticity (reflected in cortical thickness) [92].
Pathophysiological Mechanisms and Signaling Pathways
The patterns of GM alterations across disorders reflect distinct underlying pathophysiological processes. Psychiatric disorders typically involve neurodevelopmental and stress-related pathways affecting emotion regulation circuits, while neurological disorders often involve neurodegenerative pathways affecting specific functional systems.
In psychiatric disorders, GM alterations predominantly reflect neurodevelopmental aberrations evidenced by altered gyrification patterns in schizophrenia [92]. The strong association between local gyrification index and formal thought disorder dimensions suggests that early developmental processes establishing cortical folding patterns contribute significantly to symptom manifestation. Additionally, stress pathway activation through hypothalamic-pituitary-adrenal axis dysregulation leads to neurotoxic effects particularly affecting limbic regions like the hippocampus and prefrontal cortex in MDD [94].
In contrast, Alzheimer's disease involves progressive neurodegenerative pathways characterized by protein misfolding, oxidative stress, and synaptic dysfunction that lead to widespread GM loss [95]. The distribution of GM atrophy follows known vulnerability patterns, beginning in medial temporal lobes and spreading to association cortices, corresponding to the progression of cognitive and neuropsychiatric symptoms.
Notably, conditions like idiopathic dystonia demonstrate functional network dysfunction without consistent GM correlates, suggesting abnormalities in neural signaling rather than structural architecture [96]. This dissociation between function and structure highlights the diversity of pathophysiological mechanisms across neurological and psychiatric conditions.
The Scientist's Toolkit: Essential Research Materials
Table 3: Essential Research Reagents and Solutions
| Item | Function/Application | Example Use Cases |
|---|---|---|
| 3T MRI Scanner | High-resolution structural image acquisition | T1-weighted MPRAGE sequences for VBM [91] |
| Statistical Parametric Mapping (SPM) | Image processing and statistical analysis | Spatial normalization, tissue segmentation [91] |
| Computational Anatomy Toolbox (CAT12) | Advanced VBM processing | Improved segmentation and normalization [91] |
| FreeSurfer Software Suite | Surface-based cortical analysis | Extraction of thickness, area, volume, gyrification [92] |
| Seed-based d Mapping (SDM) | Coordinate-based meta-analysis | Integration of multiple neuroimaging studies [96] [94] |
| Brief Psychiatric Rating Scale (BPRS) | Assessment of psychiatric symptom severity | Correlation with GM volume in forensic populations [91] |
| Psychopathy Checklist-Revised (PCL-R) | Assessment of psychopathic traits | Dissociating psychotic symptoms from personality factors [91] |
| Thought, Language, and Communication Scale | Multidimensional FTD assessment | Differentiating positive and negative thought disorder [92] |
Implications for Drug Development and Future Research
The distinct patterns of GM alterations across disorders have significant implications for therapeutic development. In neurodegenerative conditions like Alzheimer's disease, neuroprotective agents targeting protein aggregation or oxidative stress may help slow GM loss [95]. In psychiatric disorders, interventions targeting neurodevelopmental pathways or stress resilience systems may prove more effective [92] [99].
Future research directions should include:
- Longitudinal studies tracking GM changes alongside symptom progression
- Multi-modal approaches integrating structural, functional, and molecular imaging
- Machine learning applications for classifying disorders based on GM patterns [93]
- Genomic studies identifying genetic variants associated with GM alteration susceptibility
- Intervention studies examining how pharmacological and behavioral treatments modulate GM structure
Understanding the comparative pathophysiology of GM alterations across neurological and psychiatric disorders provides a foundation for developing more targeted, biologically-informed interventions and moving toward precision medicine approaches in clinical practice.
Conclusion
The consistent relationship between gray matter architecture and behavioral outcomes underscores its immense potential as a biomarker for diagnosis, prognosis, and treatment monitoring in brain disorders. Key takeaways include the identification of both shared (e.g., insula, medial orbitofrontal cortex) and disorder-specific neural substrates, the critical importance of robust methodology to overcome measurement challenges, and the validating power of large-scale, multimodal approaches. Future directions must focus on elucidating the underlying cellular mechanisms of observed GM changes, developing standardized analytical pipelines for clinical application, and leveraging artificial intelligence to discover novel brain-behavior relationships, ultimately paving the way for personalized neurotherapeutics.
References
- 1. Neuroplasticity changes in cortical activity, grey matter, and ... [https://pubmed.ncbi.nlm.nih.gov/40064104/]
- 2. Changes in the Relationship Between Gray Matter, Functional ... [https://pmc.ncbi.nlm.nih.gov/articles/PMC12025367/]
- 3. Brain changes in stroke patients during rehabilitation [https://www.frontiersin.org/journals/neuroscience/articles/10.3389/fnins.2025.1636135/full]
- 4. Is more better? Using meta-data to explore dose-response ... [https://pmc.ncbi.nlm.nih.gov/articles/PMC4071164/]
- 5. Targeting neuroplasticity to improve motor recovery after stroke [https://pmc.ncbi.nlm.nih.gov/articles/PMC9700163/]
- 6. Mega-Analysis of Gray Matter Volume in Substance ... [https://pmc.ncbi.nlm.nih.gov/articles/PMC6427822/]
- 7. Gray and white matter morphology in substance use ... [https://www.nature.com/articles/s41398-020-01128-2]
- 8. Convergent gray matter alterations across drugs of abuse ... [https://www.sciencedirect.com/science/article/abs/pii/S0376871622003623]
- 9. Gray-Matter Volume, Midbrain Dopamine D2/D3 Receptors ... [https://pmc.ncbi.nlm.nih.gov/articles/PMC4440838/]
- 10. Gray-matter relationships to diagnostic and transdiagnostic ... [https://pmc.ncbi.nlm.nih.gov/articles/PMC5538947/]
- 11. Structural Neuroimaging in Polysubstance Users - PMC [https://pmc.ncbi.nlm.nih.gov/articles/PMC5233405/]
- 12. Investigating grey matter volumetric trajectories through the ... [https://www.nature.com/articles/s41467-024-50305-0]
- 13. Common and distinct patterns of grey-matter volume ... [https://www.nature.com/articles/mp201672]
- 14. Common neuroanatomical differential factors underlying ... [https://www.nature.com/articles/s42003-025-07703-x]
- 15. Hippocampal gray matter volume alterations in patients with ... [https://bmcpsychiatry.biomedcentral.com/articles/10.1186/s12888-025-06562-4]
- 16. Gray Matter Abnormalities Associated with the Risk for ... [https://link.springer.com/rwe/10.1007/978-3-031-73368-0_81]
- 17. Characteristics of gray matter alterations in never-treated and ... [https://pmc.ncbi.nlm.nih.gov/articles/PMC7217843/]
- 18. Mapping the Mind: Gray Matter Signatures of Personality ... [https://pmc.ncbi.nlm.nih.gov/articles/PMC12347840/]
- 19. Association of regional gray matter volumes in the brain ... [https://pmc.ncbi.nlm.nih.gov/articles/PMC4300012/]
- 20. Empirical facts from search for replicable associations ... [https://www.nature.com/articles/s41598-022-17556-7]
- 21. Unraveling the Neural Landscape of Mental Disorders ... [https://www.sciencedirect.com/science/article/pii/S2451902225001296]
- 22. Cortical Thickness or Grey Matter Volume? The Importance ... [https://pmc.ncbi.nlm.nih.gov/articles/PMC2891595/]
- 23. Longitudinal changes in grey matter and cognitive ... [https://www.sciencedirect.com/science/article/pii/S2666956022000642]
- 24. Gray Matter Imaging Biomarker Associated with Cognitive ... [https://practicalneurology.com/news/gray-matter-imaging-biomarker-associated-with-cognitive-function-and-dementia-risk/2470395/]
- 25. Gray Matter Volume and Cognitive Performance During ... [https://pmc.ncbi.nlm.nih.gov/articles/PMC6085481/]
- 26. Diffusion tensor imaging of deep gray matter brain structures [https://pmc.ncbi.nlm.nih.gov/articles/PMC2815127/]
- 27. Diffusion tensor imaging of deep gray matter brain structures [https://pubmed.ncbi.nlm.nih.gov/18513834/]
- 28. Behavioral performance predicts grey matter reductions in ... [https://pmc.ncbi.nlm.nih.gov/articles/PMC2914826/]
- 29. Investigating Associations Between Inflammatory Biomarkers ... [https://pmc.ncbi.nlm.nih.gov/articles/PMC8446648/]
- 30. Gray to white matter signal ratio as a novel biomarker ... [https://www.sciencedirect.com/science/article/pii/S2213158222003680]
- 31. Current Clinical Applications of Structural MRI in ... [https://thejcn.com/DOIx.php?id=10.3988/jcn.2025.0185]
- 32. Voxel- and surface-based morphometry in the cortical ... [https://www.frontiersin.org/journals/aging-neuroscience/articles/10.3389/fnagi.2025.1546977/full]
- 33. UserContributions/FAQ - Free Surfer Wiki [https://surfer.nmr.mgh.harvard.edu/fswiki/UserContributions/FAQ]
- 34. ReleaseNotes - Free Surfer Wiki [https://surfer.nmr.mgh.harvard.edu/fswiki/ReleaseNotes]
- 35. OpenBHB: a Large-Scale Multi-Site Brain MRI Data-set for ... [https://www.sciencedirect.com/science/article/pii/S1053811922007522]
- 36. Estimation of reference curves for brain atrophy and ... [https://www.nature.com/articles/s41598-025-18073-z]
- 37. Influence of Processing Pipeline on Cortical Thickness ... [https://pmc.ncbi.nlm.nih.gov/articles/PMC7391418/]
- 38. BigBrain 3D atlas of cortical layers - Research journals - PLOS [https://journals.plos.org/plosbiology/article?id=10.1371/journal.pbio.3000678]
- 39. Cortical thickness gradients in structural hierarchies - PMC [https://pmc.ncbi.nlm.nih.gov/articles/PMC4401442/]
- 40. Processing Pipelines for Cortical Thickness Estimation [https://bio-protocol.org/exchange/minidetail?id=7074813&type=30]
- 41. The effect of processing pipelines, input images and age ... [https://www.sciencedirect.com/science/article/pii/S0169260723004911]
- 42. Association of Gray Matter and Personality Development With ... [https://pmc.ncbi.nlm.nih.gov/articles/PMC6990803/]
- 43. Structural changes in the gray matter of the contralateral ... [https://www.sciencedirect.com/science/article/pii/S105381192500432X]
- 44. Abnormal structural gray matter and structural covariance ... [https://pmc.ncbi.nlm.nih.gov/articles/PMC12574090/]
- 45. Examining Relationships between Functional and ... [https://www.eneuro.org/content/12/7/ENEURO.0430-24.2025]
- 46. A prospective protocol for remotely investigating brain ... [https://pmc.ncbi.nlm.nih.gov/articles/PMC12542568/]
- 47. WAND: A multi-modal dataset integrating advanced MRI ... [https://www.nature.com/articles/s41597-024-04154-7]
- 48. Generalizability of Treatment Outcome Prediction Across ... [https://pmc.ncbi.nlm.nih.gov/articles/PMC11926635/]
- 49. Using brain structural neuroimaging measures to predict ... [https://www.nature.com/articles/s41380-024-02426-7]
- 50. Current Clinical Applications of Structural MRI in Neurological ... [https://pmc.ncbi.nlm.nih.gov/articles/PMC12303675/]
- 51. Best Practices in Structural Neuroimaging of ... [https://link.springer.com/article/10.1007/s11065-021-09496-2]
- 52. Gray and White Matter Metrics Demonstrate Distinct ... - PubMed [https://pubmed.ncbi.nlm.nih.gov/38388427/]
- 53. Structural neuroimaging as clinical predictor: A review of ... [https://pmc.ncbi.nlm.nih.gov/articles/PMC6108077/]
- 54. Diagnostic performance of T1-Weighted MRI gray matter ... [https://www.sciencedirect.com/science/article/pii/S1353802025007503]
- 55. Clinical trials and advanced MRI techniques with stem cell ... [https://translational-medicine.biomedcentral.com/articles/10.1186/s12967-025-07054-5]
- 56. Atlas of Gray Matter Volume Differences Across Psychiatric ... [https://www.sciencedirect.com/science/article/pii/S0006322324017293]
- 57. Comorbidity: From a confounder in longitudinal clinical ... [https://pmc.ncbi.nlm.nih.gov/articles/PMC9064932/]
- 58. Brain volumes and cortical thickness and associations with ... [https://www.nature.com/articles/s41390-024-03480-1]
- 59. Whole brain gray matter volume may mediate the ... [https://www.sciencedirect.com/science/article/pii/S0361923025002837]
- 60. Segment anything in medical images [https://www.nature.com/articles/s41467-024-44824-z]
- 61. Standardised lesion segmentation for imaging biomarker ... [https://insightsimaging.springeropen.com/articles/10.1186/s13244-022-01287-4]
- 62. Artificial Intelligence–Based Approaches for Brain Tumor ... [https://pmc.ncbi.nlm.nih.gov/articles/PMC12443661/]
- 63. Plug and play labeling strategies for boosting small brain ... [https://www.sciencedirect.com/science/article/abs/pii/S016786552500340X]
- 64. Deep learning for MRI-based acute and subacute ... [https://www.frontiersin.org/journals/medical-technology/articles/10.3389/fmedt.2025.1491197/full]
- 65. Deep learning for MRI-based acute and subacute ... [https://pubmed.ncbi.nlm.nih.gov/40556872/]
- 66. Shared gray matter alterations in individuals with diverse ... [https://pmc.ncbi.nlm.nih.gov/articles/PMC8935193/]
- 67. Longitudinal stability of cortical grey matter measures varies ... [https://pmc.ncbi.nlm.nih.gov/articles/PMC12224482/]
- 68. How to be part of a research consortium | News [https://www.nature.com/nature-index/news/how-to-be-part-of-a-research-consortium]
- 69. Ten Simple Rules to Enable Multi-site Collaborations ... [https://pmc.ncbi.nlm.nih.gov/articles/PMC5245793/]
- 70. Longitudinal Changes in Cortical Thickness Associated with ... [https://pmc.ncbi.nlm.nih.gov/articles/PMC2910226/]
- 71. Causal Analyses of Associations Between Brain Structure ... [https://www.sciencedirect.com/science/article/pii/S294973292500033X]
- 72. Causal Analyses of Associations Between Brain Structure ... [https://pubmed.ncbi.nlm.nih.gov/40922780/]
- 73. Limbic gray matter increases in response to cognitive- ... [https://www.nature.com/articles/s41398-025-03545-7]
- 74. BrainNet Viewer - Helab@BNU [https://helab.bnu.edu.cn/DOWNLOADS/BrainNetViewer/index.htm]
- 75. BrainNet Viewer: A Network Visualization Tool for Human ... [https://pmc.ncbi.nlm.nih.gov/articles/PMC3701683/]
- 76. Atlas of Gray Matter Volume Differences Across Psychiatric ... [https://pubmed.ncbi.nlm.nih.gov/39491638/]
- 77. A coordinate-based meta-analysis of grey matter volume ... [https://www.sciencedirect.com/science/article/pii/S0925492724001318]
- 78. Structural gray matter differences in Problematic Usage of ... [https://pmc.ncbi.nlm.nih.gov/articles/PMC9054652/]
- 79. A meta-analytic investigation of 25 years of voxel-based ... [https://www.sciencedirect.com/science/article/pii/S0149763424002604]
- 80. Predictive modeling of optimism bias using gray matter ... [https://www.nature.com/articles/s41598-022-26550-y]
- 81. Network-based mapping and neurotransmitter architecture ... [https://www.frontiersin.org/journals/systems-neuroscience/articles/10.3389/fnsys.2025.1640639/full]
- 82. Functional contrast across the gray-white matter boundary [https://pmc.ncbi.nlm.nih.gov/articles/PMC12222722/]
- 83. The future of multimodal artificial intelligence models for ... [https://pmc.ncbi.nlm.nih.gov/articles/PMC12239537/]
- 84. Large Language Models Show Signs of Alignment with ... [https://arxiv.org/html/2508.10057v1]
- 85. Grey matter volume and fractional anisotropy as ... [https://pmc.ncbi.nlm.nih.gov/articles/PMC12549239/]
- 86. Evaluating the ability of large Language models to predict ... [https://www.nature.com/articles/s41598-025-17188-7]
- 87. Benchmarking methods for mapping functional connectivity ... [https://www.nature.com/articles/s41592-025-02704-4]
- 88. Opportunities for use of neuroimaging in de-risking drug ... [https://www.nature.com/articles/s41386-024-01970-8]
- 89. Accelerating neuroscience research with neuroimaging [https://www.bms.com/life-and-science/science/advancing-neuroscience-with-neuroimaging.html]
- 90. Neuroimaging Is The Future of CNS Drug Development [https://neurotechnology.substack.com/p/neuroimaging-is-the-future-of-cns]
- 91. Gray Matter Alterations and Symptom Severity in Forensic ... [https://pmc.ncbi.nlm.nih.gov/articles/PMC12631019/]
- 92. Differential structural cortical correlates of positive ... [https://www.nature.com/articles/s41537-025-00644-8]
- 93. Integrating structural and functional brain features to ... [https://www.sciencedirect.com/science/article/abs/pii/S0165032725019706]
- 94. Structural rather than functional brain alterations that ... [https://bmcmedicine.biomedcentral.com/articles/10.1186/s12916-025-04442-y]
- 95. Structural Neuroimaging Correlates of Neuropsychiatric ... [https://pubmed.ncbi.nlm.nih.gov/39938492/]
- 96. No reliable gray matter alterations in idiopathic dystonia [https://www.frontiersin.org/journals/neurology/articles/10.3389/fneur.2025.1510115/full]
- 97. Evidence of different grey matter volume patterns in men ... [https://www.sciencedirect.com/science/article/abs/pii/S0094730X2500066X]
- 98. Associations Between Pain Experiences and Gray Matter ... [https://pubmed.ncbi.nlm.nih.gov/40812542/]
- 99. Neuroimaging correlates of psychological resilience [https://www.frontiersin.org/journals/neuroimaging/articles/10.3389/fnimg.2025.1487888/full]