Motion Tolerance in Neuroimaging: A Comprehensive Comparison of fNIRS, EEG, and fMRI for Research and Clinical Applications
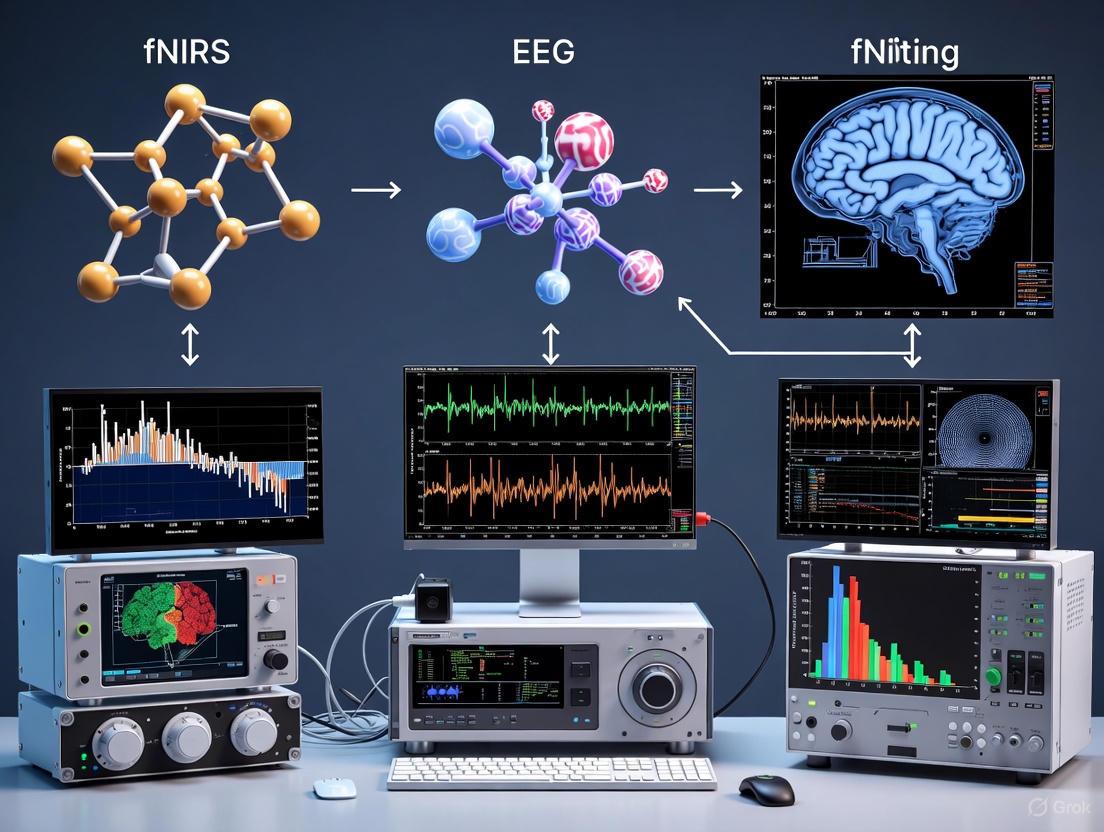
This article provides a systematic comparison of motion tolerance in functional near-infrared spectroscopy (fNIRS), electroencephalography (EEG), and functional magnetic resonance imaging (fMRI) for researchers and drug development professionals.
Motion Tolerance in Neuroimaging: A Comprehensive Comparison of fNIRS, EEG, and fMRI for Research and Clinical Applications
Abstract
This article provides a systematic comparison of motion tolerance in functional near-infrared spectroscopy (fNIRS), electroencephalography (EEG), and functional magnetic resonance imaging (fMRI) for researchers and drug development professionals. It explores the fundamental principles governing each technology's susceptibility to motion artifacts, analyzes their methodological applications across different research environments, presents advanced troubleshooting and optimization techniques for motion artifact correction, and validates findings through multimodal integration approaches. The synthesis offers evidence-based guidance for selecting appropriate neuroimaging modalities based on motion requirements, from highly controlled laboratory settings to naturalistic, ecologically valid environments, with significant implications for study design in clinical trials and therapeutic development.
Understanding Motion Artifacts: Fundamental Principles of fNIRS, EEG, and fMRI Signal Integrity
Motion artifacts are unwanted signals or noise in neuroimaging data caused by the physical movement of the participant, the imaging equipment, or both. These artifacts represent a critical challenge in neuroimaging research, as they can significantly compromise data quality, lead to false interpretations of brain activity, and reduce the statistical power of studies. The susceptibility to motion artifacts and the nature of these artifacts vary considerably across different neuroimaging modalities, namely functional near-infrared spectroscopy (fNIRS), electroencephalography (EEG), and functional magnetic resonance imaging (fMRI). Understanding these differences is essential for selecting the appropriate tool for a given research context, particularly in studies involving naturalistic settings, clinical populations, or tasks that require movement. This technical support article defines motion artifacts, details their sources and impacts across fNIRS, EEG, and fMRI, and provides practical troubleshooting guides for researchers.
Fundamental Differences in Neuroimaging Modalities
The table below summarizes the core characteristics of fNIRS, EEG, and fMRI, which underpin their differing susceptibilities to motion artifacts.
Table 1: Fundamental Characteristics of fNIRS, EEG, and fMRI
| Feature | fNIRS | EEG | fMRI |
|---|---|---|---|
| What It Measures | Hemodynamic response (changes in HbO and HbR) [1] | Electrical activity from cortical neurons [1] | Blood Oxygen Level Dependent (BOLD) signal [2] |
| Temporal Resolution | Low (seconds) [1] | High (milliseconds) [1] | Low (seconds) [2] |
| Spatial Resolution | Moderate (better than EEG) [1] | Low (centimeter-level) [1] | High (millimeter-level) [2] |
| Portability | High (wearable, portable systems) [1] [3] | High (lightweight, wireless systems) [1] | Low (requires immobile scanner) [2] |
| General Motion Tolerance | Moderate to High [1] | Low [1] | Very Low [2] |
The specific causes and manifestations of motion artifacts differ by modality, as outlined in the table below.
Table 2: Sources and Characteristics of Motion Artifacts by Modality
| Modality | Primary Sources of Motion Artifacts | Characteristic Artifact Manifestations |
|---|---|---|
| fNIRS | Head movements (nodding, shaking) [4], jaw movements (talking, chewing, swallowing) [4] [5], body movements (via inertia on the device) [4], facial muscle movements [4]. | Baseline shifts, high-frequency spikes, slow drifts [6]. Can mimic task-evoked hemodynamic responses [5]. |
| EEG | Head movements, muscle twitches (EMG), cable sway, changes in electrode-scalp contact (e.g., from walking) [7]. | Gait-related amplitude bursts, sharp transients mimicking epileptic spikes, baseline shifts and oscillations [7]. |
| fMRI | Any head movement within the scanner, even at the millimeter scale [2]. | Signal loss, spin history effects, image misalignment, and complex distortions of the magnetic field [2]. |
Impact on Data Quality and Research Outcomes
Motion artifacts have severe consequences across all modalities:
- fNIRS: Motion artifacts significantly reduce the signal-to-noise ratio (SNR) [4]. They can create spurious, task-evoked-like responses that are indistinguishable from true cerebral activity, leading to false positives [5]. Studies have shown that MAs can reduce the accuracy of vigilance level detection during walking tasks [6].
- EEG: Motion artifacts can distort the morphology of the underlying brain signal, obscuring genuine neural activity and leading to potential misinterpretations, such as misclassifying a motion artifact as an epileptic spike [7]. This is particularly problematic for mobile EEG (mo-EEG) where movement is the primary objective [7].
- fMRI: Head motion compromises the accuracy of spatial localization and the interpretation of the BOLD signal [2]. It reduces the reliability and reproducibility of results, which is a significant concern for clinical and longitudinal studies [2] [8].
Troubleshooting Guide: Mitigation Strategies and Solutions
This section provides a question-and-answer format to address common experimental challenges.
FAQ 1: What are the primary strategies for removing motion artifacts from fNIRS data?
Motion artifact correction in fNIRS can be broadly divided into hardware-based and algorithmic solutions [4].
- Hardware-Based Solutions: Using auxiliary devices like accelerometers is common. The accelerometer signal provides a reference for the motion, which can be used in adaptive filtering techniques (e.g., Active Noise Cancelation - ANC) to remove the artifact from the fNIRS signal [4]. Another innovative hardware approach is using an individually customized bite bar to physically suppress jaw-related movements, which has been shown to effectively improve auditory response data and resting-state functional connectivity [5].
- Algorithmic (Signal Processing) Solutions: A wide range of algorithms exists, from traditional methods (e.g., moving average, channel rejection) to advanced learning-based techniques [6] [4]. Deep learning models are increasingly prominent, including:
- Convolutional Neural Networks (CNNs) like U-Net, which are trained to reconstruct the clean hemodynamic response while reducing MA [6].
- Denoising Auto-Encoder (DAE) models, which learn to map noisy input signals to clean outputs [6].
- Structured sparse multiset Canonical Correlation Analysis (ssmCCA), a data fusion method that can help isolate consistent neural activity across modalities like fNIRS and EEG, improving robustness against artifacts [9].
FAQ 2: How can I tackle motion artifacts in mobile EEG experiments?
EEG motion artifact removal is an active field of research. While traditional signal processing methods (e.g., high/low-pass filters, ICA) are used, they have limitations when artifact frequencies overlap with neural signals [7]. A cutting-edge solution is subject-specific deep learning.
- Motion-Net: This is a CNN-based 1D signal reconstruction network designed specifically for motion artifact removal in EEG. Its key innovation is that it is trained and tested on a per-subject basis, which allows it to handle the high variability of motion artifacts across individuals. This approach has demonstrated an average motion artifact reduction of 86% and a significant improvement in SNR [7].
FAQ 3: Our fMRI study involves patients who struggle to remain still. What are our options?
For fMRI, prevention is the most effective strategy, but post-processing is crucial.
- Prevention: Use comfortable but firm head restraints within the scanner coil to minimize movement [2].
- Post-Processing: A standard approach is to include the estimated head motion parameters (obtained during realignment) as nuisance regressors in the general linear model (GLM) to statistically control for motion-related variance [2]. For more integrated solutions, multimodal approaches are promising.
- Multimodal Integration: Combining fMRI with a more motion-tolerant modality like fNIRS is a powerful strategy. fMRI provides high-resolution spatial maps, while fNIRS offers superior temporal resolution and portability. This synergy allows for robust spatiotemporal mapping, where the fNIRS data can help validate or complement findings that may be corrupted by motion in the fMRI data alone [2].
FAQ 4: We are setting up a multimodal EEG-fNIRS study. How can we minimize motion artifacts from the start?
Successful multimodal integration requires careful planning.
- Sensor Placement: Use high-density EEG caps with pre-defined fNIRS-compatible openings or optode holders that avoid electrode contact points. Both systems often use the international 10–20 system for placement [1] [10].
- Synchronization: Synchronize the EEG and fNIRS systems using external hardware triggers (e.g., TTL pulses) or shared acquisition software to align the data streams temporally [1] [10].
- Cap Fitting: Ensure a tight but comfortable cap fitting to minimize relative movement between the optodes/electrodes and the scalp [1].
- Data Fusion: Recognize that EEG and fNIRS capture fundamentally different signals. They require separate preprocessing pipelines before integration. Data fusion techniques like joint Independent Component Analysis (jICA) or Canonical Correlation Analysis (CCA) can then be applied [1] [9].
The Scientist's Toolkit: Essential Research Reagents and Materials
Table 3: Key Materials and Tools for Motion Artifact Mitigation
| Item / Solution | Function / Application | Relevant Modality |
|---|---|---|
| Accelerometer / Inertial Measurement Unit (IMU) | Provides a reference signal of head motion for adaptive filtering [4]. | fNIRS, EEG |
| Customized Bite Bar | Physically suppresses jaw-related motion artifacts during tasks involving the temporal cortex [5]. | fNIRS |
| sEMG Electrodes | Records muscle activity to identify and remove electromyographic (EMG) artifacts. | EEG |
| EasyCap with fNIRS Openings | Integrated cap system for simultaneous EEG-fNIRS recording, ensuring proper sensor co-registration [10] [9]. | Multimodal (EEG-fNIRS) |
| Homer2 / NIRS Toolbox | A common software toolbox for fNIRS data processing, including motion artifact correction modules [6]. | fNIRS |
| PCA-GLM Denoising | A denoising algorithm that uses Principal Component Analysis within a General Linear Model framework to remove artifacts [5]. | fNIRS |
| Structured Sparse Multiset CCA (ssmCCA) | A data fusion technique to identify brain activity consistently detected by both fNIRS and EEG, enhancing signal reliability [9]. | Multimodal (EEG-fNIRS) |
Experimental Protocols and Workflows
- Apparatus Creation: Create an individually customized bite bar for each participant.
- Task Design:
- Clenching Task: Record data while the participant performs jaw clenching. This helps characterize the artifact profile.
- Auditory Task: Present auditory stimuli to the participant.
- Resting-State Task: Record data while the participant is at rest.
- Data Acquisition: Perform the auditory and resting-state tasks under two conditions: with and without the bite bar.
- Data Processing: Apply a denoising algorithm (e.g., PCA-GLM) to the data.
- Analysis: Compare the within-subject standard deviation, task-related contrast-to-noise ratio, and strength of activations between the bite bar and no-bite-bar conditions.
The following diagram illustrates the workflow for a combined fNIRS-EEG experiment, highlighting steps critical for managing data quality.
Motion artifacts are an inherent challenge in neuroimaging, but their impact can be managed through a careful understanding of their sources and the application of robust mitigation strategies. fNIRS offers a balanced solution with its tolerance for movement and portability, making it suitable for naturalistic studies. EEG provides unparalleled temporal resolution but requires advanced signal processing to overcome its motion sensitivity. fMRI, while providing exceptional spatial detail, is the most constrained by motion. The future of neuroimaging lies in multimodal approaches and intelligent, learning-based artifact removal techniques, which together promise to unlock new possibilities for studying the brain in action.
Frequently Asked Questions (FAQs)
What are the fundamental physical principles behind fNIRS's motion tolerance?
Functional Near-Infrared Spectroscopy (fNIRS) exhibits a higher tolerance to motion artifacts compared to techniques like EEG due to its physical operating principles. fNIRS is an optical neuroimaging technique that uses near-infrared light (~700-900 nm) to measure hemodynamic responses by detecting changes in oxygenated (HbO) and deoxygenated hemoglobin (HbR) concentrations in the brain's cortical layer [11] [12]. The optical signals are less susceptible to the electrical and magnetic interference that affects other modalities. Furthermore, its hardware design, which involves securing optodes (light sources and detectors) to the scalp, is relatively robust to movement-induced decoupling [13] [4]. Unlike EEG, which measures minute electrical potentials on the microvolt scale that are easily distorted by changes in electrode-skin contact impedance from movement, the intensity of back-scattered light measured by fNIRS is more stable during minor subject movements [11] [14].
What are the most common types of motion artifacts in fNIRS data?
Despite its relative robustness, fNIRS is not immune to motion artifacts. The most common types and their causes are summarized in the table below.
Table: Common fNIRS Motion Artifacts and Causes
| Artifact Type | Common Causes | Typical Signal Manifestation |
|---|---|---|
| High-Amplitude Spikes [13] [4] | Head jerks, abrupt nodding/shaking | Sudden, large signal shift followed by a rapid return to baseline |
| Baseline Shifts [13] [4] | Head tilting, sustained change in optode pressure | A sustained displacement of the signal to a new level |
| Low-Frequency Variations [13] | Jaw movement (talking, eating), slow postural sway | Slow, oscillatory signal changes that can mimic the hemodynamic response |
These artifacts occur primarily due to a transient decoupling between the optodes and the scalp, causing changes in how light is delivered and captured [13] [4]. Movements of the eyebrows, jaw, and other facial muscles are particularly common sources of artifacts [4].
What are the best practices for preventing motion artifacts during fNIRS experiments?
Prevention is the first line of defense. Key strategies include:
- Secure Optode Mounting: Use tight but comfortable caps, and for challenging populations (e.g., children) or high-movement paradigms, consider using headbands or custom helmets to improve stability [11] [4].
- Subject Preparation and Instruction: Clearly instruct participants to minimize head movements, jaw clenching, and eyebrow raising. In paradigms involving speech (e.g., cognitive tasks), account for the specific artifacts jaw movement will cause [13].
- Experimental Design: For highly mobile subjects, design tasks with controlled movement periods or incorporate rest breaks to minimize cumulative motion [11].
- Auxiliary Hardware: Use accelerometers or inertial measurement units (IMUs) attached to the head to record motion objectively. This data can be used to inform subsequent artifact rejection or correction [4].
Which motion artifact correction algorithms are most effective?
Multiple algorithmic solutions exist, with their performance depending on the artifact type. The following table summarizes prominent methods.
Table: Comparison of fNIRS Motion Artifact Correction Algorithms
| Method | Principle | Best For | Key Considerations |
|---|---|---|---|
| Wavelet Filtering [13] | Identifies and removes artifact components in the wavelet domain | General use; effective on task-correlated, low-frequency artifacts [13] | One study found it the most effective, correcting 93% of cases [13] |
| Spline Interpolation [13] [4] | Identifies artifact segments, interpolates over them with splines, then subtracts | Isolated, high-amplitude spikes | Performance depends on accurate artifact detection |
| Correlation-Based Signal Improvement (CBSI) [13] | Uses the temporal correlation and anti-correlation between HbO and HbR | Correcting baseline shifts | A simple, model-based approach |
| Accelerometer-Based Methods (e.g., ABAMAR) [4] | Uses accelerometer data as a noise reference for adaptive filtering | Scenarios where auxiliary motion tracking is available | Enables real-time artifact correction |
The general consensus is that correcting for motion artifacts is almost always better than rejecting entire trials, as the latter can lead to a significant loss of data, especially in populations that are hard to test [13].
Troubleshooting Guide: Motion Artifacts
Problem: Frequent high-amplitude spikes in the signal.
- Possible Cause: Loose optode-scalp coupling; sudden, jerky head movements.
- Solutions:
Problem: Slow, low-frequency drifts that resemble a hemodynamic response.
- Possible Cause: Jaw movements (e.g., speaking, swallowing), slow postural sway, or task-correlated head movements [13].
- Solutions:
- Analyze Timing: Check if the "response" is locked to non-stimulus events like speech.
- Reprocess Data: Wavelet filtering has been shown to be particularly effective for this challenging artifact type [13].
- Future Prevention: If speech is not required, instruct participants to remain silent. For necessary movements, consider using movement-prone periods as a regressor in the general linear model.
Problem: Sustained baseline shift after a movement.
- Possible Cause: The optode array was displaced and settled into a new position, changing the baseline light coupling [4].
- Solutions:
- Reprocess Data: Apply CBSI [13] or accelerometer-based correction if available [4].
- Inspect Data: Visually identify the shift point and consider segmenting the data or using detrending algorithms that can handle level shifts.
- Future Prevention: Improve initial optode mounting stability to prevent slippage.
The Scientist's Toolkit: Key Reagents & Materials
Table: Essential Materials for Motion-Robust fNIRS Research
| Item | Function / Explanation |
|---|---|
| Secure Head Cap | A tight-fitting, comfortable cap is the first line of defense. Ergonomic designs that minimize slippage are crucial for motion-tolerant measurements [4]. |
| Accelerometer / IMU | Auxiliary hardware attached to the cap to provide an objective measure of head motion. Serves as a noise reference for advanced correction algorithms [4]. |
| Wavelet Filtering Software | Software implementing wavelet-based algorithms (e.g., in MATLAB, Python) is a key analytical tool for effectively removing a wide range of motion artifacts [13]. |
| Solid Gel or Adhesive | For securing individual optodes, especially in high-movement studies, using a solid gel or medical adhesive can improve stability and reduce motion-induced decoupling. |
Experimental Protocol: Validating Motion Correction Methods
A standard approach to validate the efficacy of a motion correction technique involves adding a simulated, known hemodynamic response to real resting-state data that contains genuine motion artifacts [13].
Objective: To quantitatively evaluate the performance of motion artifact correction techniques (e.g., Wavelet, CBSI, Spline) by comparing a known ground truth signal to the processed output.
Workflow:
- Acquire Resting-State Data: Record fNIRS data from a participant at rest, instructing them to perform occasional, specific movements (e.g., head nods, jaw clenches) to induce motion artifacts [13].
- Simulate Hemodynamic Response: Generate a canonical hemodynamic response function (HRF) and add it to the artifact-contaminated resting-state data. This creates a dataset where the "true" brain signal is known.
- Apply Correction Algorithms: Process the synthetic dataset with various motion correction algorithms (Wavelet, Spline, CBSI, etc.).
- Quantitative Comparison: Calculate performance metrics by comparing the algorithm's output to the known simulated HRF.
- Primary Metrics: Mean-Squared Error (MSE) and Pearson's Correlation Coefficient (R²) [13].
- Physiological Plausibility: Check that the corrected signal maintains the expected negative correlation between HbO and HbR.
This protocol allows researchers to objectively determine the best correction method for their specific type of data and artifacts.
The following diagram illustrates the logical workflow for dealing with motion artifacts in an fNIRS experiment, from prevention to correction.
Electroencephalography (EEG) is highly vulnerable to disruption from head and muscle movements because it measures electrical potentials in the microvolt range (millionths of a volt) at the scalp surface [15] [16]. These neural signals are exceptionally weak compared to the electrical noise generated by physiological processes and movement, making them easily obscured by artifacts [15]. Unlike other neuroimaging methods, EEG's fundamental reliance on detecting these minute electrical signals makes it particularly susceptible to contamination from both physiological sources (like muscle activity and eye movements) and non-physiological sources (such as cable movement and loose electrodes) [15] [16]. This inherent vulnerability forms a critical limitation in motion tolerance comparisons with fNIRS and fMRI, particularly for studies requiring naturalistic movement or involving populations with limited movement control.
FAQ: Troubleshooting Common EEG Movement Issues
Q1: Why does jaw clenching severely disrupt my EEG recordings?
Jaw clenching generates electromyographic (EMG) artifacts because facial muscle contractions produce electrical signals that are dramatically stronger than cortical EEG signals [15] [16]. These EMG artifacts manifest as high-frequency noise that overlaps with and obscures crucial EEG rhythms in the beta (13-30 Hz) and gamma (>30 Hz) ranges [15]. The amplitude of this artifact is directly proportional to muscle contraction strength, and because head muscles are close to EEG electrodes, the interference is particularly severe [16].
Q2: How do subtle head movements affect EEG signal quality?
Even slight head movements can displace the EEG cap, altering electrode-skin contact impedance and creating signal artifacts [16]. This manifests as slow baseline drifts or sudden, large voltage shifts that can saturate amplifiers [16] [17]. Movement also causes cable swinging, which introduces oscillations at the frequency of the swing that may overlap with EEG frequencies of interest [15] [16]. In mobile EEG studies, complex movements produce equally complex cap movements involving pulling, sliding, and shaking, affecting all recording channels [16].
Q3: What makes EEG more vulnerable to movement than fNIRS?
EEG and fNIRS differ fundamentally in what they measure and consequently in their motion tolerance. EEG measures electrical potentials directly affected by movement-induced changes in the electrode-skin interface [18] [15]. fNIRS measures hemodynamic responses using light, which is less susceptible to these electrical disruptions [18] [19]. While movement can affect fNIRS optode contact, the optical signals themselves are not electrical and thus immune to many movement-related artifacts that plague EEG [18] [9].
Q4: Which brainwave frequencies are most affected by movement artifacts?
Different movement artifacts affect distinct frequency bands [15] [16]:
- Ocular artifacts (blinks, eye movements): Primarily dominate delta (0.5-4 Hz) and theta (4-8 Hz) bands [16]
- Muscle artifacts: Most prominent in beta (13-30 Hz) and gamma (>30 Hz) ranges [15] [16]
- Cable movement: Can introduce artificial peaks at low or mid frequencies, potentially mimicking genuine neural oscillations [15]
Table: Comparative Motion Tolerance in Neuroimaging Modalities
| Modality | Primary Signal | Motion Tolerance | Key Motion-Related Vulnerabilities |
|---|---|---|---|
| EEG | Electrical potentials from cortical neurons | Low | Electrode impedance changes, muscle electrical activity, cable movement, ocular electrical fields [18] [15] |
| fNIRS | Hemodynamic (blood oxygenation) | Moderate | Optode displacement, scalp blood flow changes, hair interference [18] [19] |
| fMRI | Hemodynamic (BOLD signal) | Very Low | Magnetic field inhomogeneity, image distortion, signal dropout [2] |
Artifact Identification and Removal Protocols
Physiological Artifact Identification
Ocular Artifacts: Eye blinks and movements generate electrical fields measured as electrooculogram (EOG) artifacts, typically reaching 100-200 µV - an order of magnitude larger than EEG signals [15]. Blinks produce sharp, high-amplitude deflections maximal over frontal electrodes (Fp1, Fp2), while lateral eye movements create box-shaped deflections with opposite polarity at temples [16].
Muscle Artifacts (EMG): Muscle contractions from jaw clenching, talking, or forehead tension produce high-frequency noise that contaminates the entire EEG spectrum up to 300 Hz [15] [16]. Neck and shoulder tension particularly affect mastoid regions, potentially spreading to all channels if mastoid references are used [16].
Cardiac Artifacts: Pulse artifacts from head arteries create rhythmic waveforms synchronized with heart rate, often visible in electrodes near neck arteries or mastoids [16]. These can be confused with genuine EEG rhythms in epilepsy monitoring [16].
Technical Artifact Identification
Electrode Pops: Sudden impedance changes from drying gel or poor contact cause abrupt, high-amplitude transients, often isolated to a single channel [15] [16]. These appear as sharp spikes with variable morphology in the time domain [15].
Cable Movement: Cable displacement produces transient signal alterations with varying shapes [15] [16]. Rhythmic cable swinging introduces oscillations at the swing frequency that may mimic neural rhythms [15].
Loose Electrodes: Poor electrode contact creates slow drifts or sudden signal instability affecting individual channels or the entire recording if reference electrodes are involved [16].
Artifact Removal Methodologies
Independent Component Analysis (ICA): This sophisticated statistical technique separates EEG signals into independent components, allowing identification and removal of artifact-contributed components before signal reconstruction [18] [16]. ICA is particularly effective for ocular, cardiac, and persistent muscular artifacts [16]. For optimal component separation, a minimum of 64 channels is recommended [17].
Regression-Based Subtraction: This method uses simultaneously recorded EOG channels to estimate and subtract ocular artifact contributions from EEG signals [16]. While effective, it requires additional EOG electrodes and careful calibration [16].
Filtering Approaches:
- High-pass filtering: Reduces slow drifts from sweat or body sway (typically <1 Hz) [16]
- Notch filtering: Removes line noise at 50/60 Hz from electrical interference [16]
- Band-stop filtering: Can attenuate muscle artifacts in specific frequency bands [15]
Artifact Rejection: For large, transient artifacts (major movements, electrode pops), the most reliable approach is often complete rejection of contaminated epochs [16] [17]. Automatic detection criteria include:
- Gradient-based: Detects steep voltage changes characteristic of electrode pops [17]
- Amplitude-based: Identifies voltages exceeding physiological ranges [17]
- Max-Min: Finds relative amplitude changes beyond defined ranges [17]
Table: Artifact Removal Techniques and Applications
| Technique | Best For | Limitations | Implementation Considerations |
|---|---|---|---|
| Independent Component Analysis (ICA) | Ocular, cardiac, persistent muscular artifacts | Requires sufficient channels (≥64 optimal), careful component selection [16] [17] | Component inspection required to avoid removing neural signals [16] |
| Automatic Artifact Rejection | Large, transient artifacts (movement, pops) | Reduces trial count, may introduce selection bias [17] | Gradient, amplitude, and max-min criteria can be combined [17] |
| Selective Filtering | Line noise, slow drifts, specific frequency bands | Can distort genuine EEG, phase shifts [16] | High-pass for drifts (<1 Hz), notch for line noise (50/60 Hz) [16] |
| Channel Interpolation | Single bad channels throughout recording | Estimated signal only, limited interpretation value [17] | Use when few channels affected, based on surrounding electrodes [17] |
Motion Tolerance Comparison: EEG vs. fNIRS vs. fMRI
The motion tolerance of neuroimaging modalities stems from their fundamental measurement principles. EEG's vulnerability arises from measuring microvolt-level electrical potentials easily disrupted by movement-induced changes in the electrode-skin interface and muscle electrical activity [18] [15]. fNIRS demonstrates superior motion tolerance because it measures hemodynamic responses using near-infrared light, which is less affected by movement [18] [19]. fMRI has the lowest motion tolerance due to extreme sensitivity to head movement within the magnetic field, causing image distortion and signal dropout [2].
Table: Comprehensive Motion Tolerance Comparison Across Modalities
| Feature | EEG | fNIRS | fMRI |
|---|---|---|---|
| Primary Signal Measured | Electrical potentials from cortical neurons [18] | Hemodynamic changes (HbO/HbR) via NIR light [18] | Blood oxygenation (BOLD) via magnetic properties [2] |
| Temporal Resolution | High (milliseconds) [18] | Moderate (seconds) [18] | Slow (seconds) [2] |
| Spatial Resolution | Low (centimeter-level) [18] | Moderate (better than EEG) [18] | High (millimeter-level) [2] |
| Depth of Measurement | Cortical surface [18] | Outer cortex (1-2.5 cm) [18] | Whole brain (cortical and subcortical) [2] |
| Major Motion Artifacts | Electrode impedance changes, muscle electrical noise, cable movement [15] [16] | Optode displacement, scalp blood flow changes [18] [19] | Image distortion, signal dropout, magnetic field inhomogeneity [2] |
| Typical Motion Artifact Amplitude | 100-200 µV (ocular), can saturate amplifiers [15] [16] | Signal baseline shifts [18] | Complete signal loss in affected regions [2] |
| Ideal Movement Context | Highly controlled lab environments, minimal movement [18] | Naturalistic settings, child development, sports science [18] [19] | Complete immobilization required [2] |
| Best Suited Populations | Cooperative adults, sleep studies [18] | Infants, children, elderly, rehabilitation patients [18] [19] | Highly compliant adults [2] |
Experimental Protocols for Motion-Robust EEG
Protocol for Mobile EEG in Naturalistic Environments
Equipment Preparation:
- Use active electrode systems with amplification at electrodes to reduce cable movement artifacts [16]
- Select high-density caps (≥64 channels) to facilitate ICA processing and channel interpolation [17]
- Implement impedance monitoring throughout setup, maintaining <10 kΩ with balanced impedances across electrodes [20]
Experimental Design:
- Incorporate baseline periods without movement for signal quality assessment
- Use behavioral synchronization triggers to mark movement onset/offset
- Implement structured movement tasks with varying intensity levels
Data Acquisition:
- Sample at ≥512 Hz to adequately capture high-frequency components and artifact morphology [20]
- Record additional physiological channels (EOG, ECG) for artifact regression [16]
- Monitor impedance values throughout recording session
Processing Pipeline:
- Preprocessing: Apply bandpass filter (0.5-70 Hz) and notch filter (50/60 Hz) [20]
- Artifact Detection: Use automated algorithms with manual verification [17]
- Component Analysis: Run ICA, identify and remove artifact components [16]
- Channel Repair: Interpolate bad channels using spherical splines [17]
- Epoch Rejection: Remove irreparably contaminated segments [17]
Protocol for Combined EEG-fNIRS Motion Studies
Hardware Integration:
- Use integrated caps with EEG electrodes and fNIRS optodes co-registered using the international 10-20 system [19] [10]
- Ensure proper spacing to prevent interference between modalities [19]
- Implement synchronized acquisition systems with shared trigger timing [19] [9]
Experimental Paradigm:
- Design tasks with graded movement intensity (rest, subtle, gross movement)
- Include conditions that elicit both electrical and hemodynamic responses
- Incorporate validation tasks with known neural correlates
Multimodal Data Fusion:
- Apply temporal synchronization of EEG and fNIRS data streams [19] [9]
- Use joint analysis techniques like structured sparse multiset Canonical Correlation Analysis (ssmCCA) [9]
- Correlate electrical artifacts with hemodynamic changes to identify motion-related confounds [9]
The Scientist's Toolkit: Essential Research Reagents and Materials
Table: Essential Equipment and Software for Motion-Robust EEG Research
| Item | Function | Technical Specifications | Application Notes |
|---|---|---|---|
| Active Electrode Systems | Amplification at electrode source to reduce cable movement artifacts [16] | Integrated preamplifiers, typical gain: 100-1000x | Significantly reduces cable motion artifacts; requires power source [16] |
| High-Density EEG Caps | Dense electrode arrays for spatial sampling and ICA processing [17] | 64+ channels, international 10-10/10-20 placement | Enables better artifact component separation and channel interpolation [17] |
| Impedance Monitoring System | Real-time electrode-skin contact quality assessment [20] | <10 kΩ optimal, balanced across electrodes | Critical for identifying loose electrodes and poor contacts [20] |
| ICA Software Packages | Statistical separation of neural and artifact components [16] [17] | EEGLAB, BrainVision Analyzer, MNE-Python | Requires careful component inspection to avoid removing neural signals [16] |
| Auxiliary Physiological Sensors | Reference signals for artifact regression [16] | EOG, ECG, EMG channels | Enables regression-based removal of ocular and cardiac artifacts [16] |
| Integrated EEG-fNIRS Systems | Simultaneous electrical and hemodynamic recording [19] [9] | Co-registered electrodes and optodes, synchronized acquisition | Allows cross-validation and motion artifact correlation across modalities [19] [9] |
| Motion Tracking Systems | Quantification of head movement during recording [9] | Accelerometers, optical tracking, gyroscopes | Provides objective movement metrics for artifact correlation [9] |
Head motion is a fundamental and persistent challenge in functional Magnetic Resonance Imaging (fMRI) research. Even sub-millimeter movements can introduce significant, spatially variable artifacts that corrupt the Blood Oxygen Level Dependent (BOLD) signal, complicating data interpretation and analysis [21]. These motion artifacts often mimic genuine neural patterns; for instance, they can create a spurious impression of stronger short-range and weaker long-range functional connectivity, a pattern that has complicated the interpretation of studies in conditions like autism spectrum disorder (ASD) [21] [22]. The problem is particularly acute in pediatric and clinical populations, where remaining perfectly still is more challenging [21]. This article details the specific issues caused by motion, provides troubleshooting guidance, and situates these challenges within a broader comparison of motion tolerance across major neuroimaging modalities.
Technical Support Center: FAQs and Troubleshooting Guides
Frequently Asked Questions (FAQs)
Q1: Why is complete immobility so critical in fMRI experiments? The fMRI signal is remarkably sensitive to minute head movements. Motion disrupts the magnetic field, changes the tissue composition within a voxel, and disrupts the steady-state magnetization recovery of spins. This leads to signal dropouts and artifactual amplitude changes that can be difficult to distinguish from true neural activity [23]. These artifacts produce distance-dependent biases in functional connectivity metrics, making them particularly pernicious [23].
Q2: How does the scanning environment itself affect participant performance? The fMRI environment is inherently distracting and stressful. It involves loud scanner noises, physical confinement, and restricted movement. Research shows this environment can act as a form of divided attention, particularly impairing performance on more demanding cognitive tasks. One study found that both young and older adults showed performance decrements in the scanner on a long-term memory task, with older adults being disproportionately impaired [24]. This suggests the environment itself may bias samples by selectively affecting those more vulnerable to distraction.
Q3: What is the downside of simply excluding high-motion participants? While excluding participants with excessive motion is a common practice, it introduces selection bias. For example, in a study of autism, children with ASD were significantly more likely to be excluded for motion than typically developing children (28.5% vs. 16.1% under a lenient criterion) [21] [22]. The resulting sample of autistic children with usable data was older, had milder social deficits, better motor control, and higher intellectual ability than the original sample [22]. This means that analyses based only on "usable" data may lack generalizability and underestimate true effect sizes by selectively including participants with less severe clinical profiles [21].
Q4: Are there statistical methods to correct for motion-induced bias? Yes, emerging methods treat excluded scans as a missing data problem. One advanced approach uses doubly robust targeted minimum loss-based estimation (DRTMLE) with an ensemble of machine learning algorithms. This method models the relationship between phenotypic data and both scan usability (propensity model) and functional connectivity (outcome model) to estimate deconfounded group differences. This approach has been shown to identify more extensive and potentially more accurate functional connectivity differences than standard analyses [21] [22].
Q5: What technical solutions exist beyond simple motion correction? A promising technical solution involves structured low-rank matrix completion. After "censoring" high-motion volumes, this method recovers the missing data by exploiting the inherent structure in the fMRI time series, enforcing a linear recurrence relation across time points. This approach not only compensates for motion but also performs slice-timing correction, leading to functional connectivity matrices with lower errors in pair-wise correlation compared to standard processing pipelines [23].
Comparative Motion Tolerance in Neuroimaging
The challenge of motion is not uniform across all neuroimaging modalities. The table below provides a clear comparison of how fMRI, fNIRS, and EEG handle participant movement, a critical factor in experimental design.
Table: Motion Tolerance and Key Characteristics Across Neuroimaging Modalities
| Feature | fMRI | fNIRS | EEG |
|---|---|---|---|
| What It Measures | Blood Oxygenation (BOLD) | Hemodynamic Response (HbO/HbR) | Electrical Activity |
| Temporal Resolution | Low (seconds) | Low (seconds) | High (milliseconds) |
| Spatial Resolution | High | Moderate (cortical surface) | Low |
| Sensitivity to Motion | Very High | Low | High |
| Key Motion Artifacts | Spin history effects, signal dropouts [23] | Minimal decoupling of optodes from scalp [25] | Muscle artifacts, electrode displacement [25] |
| Best Use Cases | Deep brain structures, high spatial resolution needs | Naturalistic studies, child development, clinical populations [25] | Fast cognitive tasks, ERPs, sleep research [25] |
Quantitative Impact of Motion Exclusion
The following table summarizes data from a large-scale study on autism, illustrating the severe sample composition biases that can arise from standard motion exclusion practices.
Table: Impact of Motion Exclusion on Sample Composition in an Autism Study (n=545) [21] [22]
| Variable | Autistic Children | Typically Developing Children |
|---|---|---|
| Exclusion (Lenient Criterion) | 28.5% | 16.1% |
| Exclusion (Strict Criterion) | 81.0% | 60.1% |
| Profile of Retained ASD Sample | Older, milder social deficits, better motor control, higher intellectual ability | -- |
| Relationship in Usable Data | Symptom severity and age were related to functional connectivity strength | -- |
Experimental Protocols for Motion Mitigation
This protocol outlines a sophisticated method for recovering fMRI data corrupted by motion.
1. Problem Modeling:
- Input: Unprocessed fMRI volumes (
Yi), motion parameters, slice-timing information. - Forward Model: The relationship between the desired high-resolution time series
Xand the acquired data is modeled asYi = Mi(Si(X)) + ηi, whereMiis the motion operator,Siis the sampling operator, andηiis the error term.
2. Motion Censoring:
- Identify and censor (remove) volumes with elevated frame-by-frame motion, as well as the frames directly adjoining them.
3. Matrix Completion via Linear Recurrence Relation (LRR):
- Assume the temporal signal at each voxel follows an LRR, where the current time point is a linear combination of its past
Lvalues. - This LRR allows the construction of a structured Hankel matrix for each voxel's time series, which is inherently low-rank.
- Stack Hankel matrices from different voxels to form a large, structured matrix that captures spatiotemporal correlations.
4. Optimization and Recovery:
- Solve the ill-posed problem of recovering the complete data matrix
Xby enforcing this low-rank prior on the structured matrix. - Use a variable splitting strategy to efficiently solve the large-scale optimization problem, making it computationally feasible.
5. Output:
- The output is a motion-compensated, slice-time-corrected fMRI time series (
X) at a finer temporal resolution, which can be down-sampled for subsequent functional connectivity analysis.
The workflow for this protocol is logically structured as follows:
This protocol addresses the statistical bias introduced when excluding participants, treating it as a missing data problem.
1. Data Aggregation:
- Aggregate the full dataset, including participants excluded for motion, along with all available phenotypic and clinical data.
2. Model Building:
- Propensity Model: Use an ensemble of machine learning algorithms (a "Super Learner") to model the probability that a participant's scan is usable (i.e., not excluded), based on their phenotypic characteristics (e.g., age, symptom severity).
- Outcome Model: Similarly, use an ensemble to model the relationship between phenotypic characteristics and the functional connectivity outcome of interest.
3. Doubly Robust Estimation (DRTMLE):
- Implement the Doubly Robust Targeted Minimum Loss-Based Estimation method.
- This estimator combines the propensity and outcome models. It is "doubly robust" because it will yield an unbiased estimate of the group difference (e.g., ASD vs. typically developing) if either the propensity model or the outcome model is correctly specified.
4. Result Interpretation:
- The output is a "deconfounded" estimate of the group difference in functional connectivity, which accounts for the systematic loss of data from certain participant subgroups.
The logical pathway for this statistical correction method is shown below:
The Scientist's Toolkit: Essential Research Reagents & Materials
Table: Key Solutions for fMRI Motion Challenges
| Item/Solution | Function/Benefit | Context of Use |
|---|---|---|
| Structured Low-Rank Matrix Completion [23] | Recovers censored fMRI data by exploiting temporal structure and spatial correlations, reducing motion artifacts in connectivity matrices. | Advanced data preprocessing for resting-state and task-based fMRI. |
| Doubly Robust Targeted Minimum Loss-Based Estimation (DRTMLE) [21] [22] | Provides statistically robust group difference estimates that correct for selection bias introduced by motion-based participant exclusion. | Final data analysis stage, particularly for clinical group comparisons. |
| Prospective Motion Correction (PMC) | Uses external tracking (e.g., cameras) to update the scanner's field of view in real-time, mitigating motion as it occurs. | Data acquisition, especially with populations prone to movement (e.g., children, patients). |
| Censoring (Scrubbing) | Removes motion-corrupted volumes from the time series to prevent them from unduly influencing correlation estimates. | Standard preprocessing step before functional connectivity analysis. |
| Integrated EEG-fNIRS Systems [10] | Offers a motion-tolerant, multimodal alternative for studying brain function in naturalistic settings, combining EEG's temporal resolution with fNIRS's spatial and hemodynamic information. | Experimental designs where ecological validity and movement are priorities over imaging deep brain structures. |
This technical support guide addresses a fundamental challenge in non-invasive neuroimaging: managing motion artifacts. The susceptibility of a signal to movement is intrinsically linked to its physiological origin. This resource provides troubleshooting guides and FAQs to help researchers in neuroscience and drug development design more robust experiments and effectively correct for motion-related noise in electroencephalography (EEG), functional near-infrared spectroscopy (fNIRS), and functional magnetic resonance imaging (fMRI).
Fundamental Signal Origins & Motion Susceptibility
FAQ: Why are some brain signals more affected by motion than others?
Q1: What is the core physiological difference between the signals measured by EEG and fNIRS/fMRI? EEG measures the brain's electrical activity directly, detecting voltage changes from synchronized firing of cortical neurons, primarily pyramidal cells. In contrast, fNIRS and fMRI measure hemodynamic activity indirectly; they track changes in blood oxygenation (oxygenated and deoxygenated hemoglobin) that occur in response to neural activity, a process known as neurovascular coupling [26].
Q2: How does this difference explain EEG's high sensitivity to motion? EEG's electrical signals are measured at the microvolt level. Motion causes artifacts primarily by:
- Changing the electrical contact between the electrode and the scalp, creating variable impedance.
- Generating electrical potentials from the movement of the electrode cable within the magnetic field (for simultaneous EEG-fMRI).
- Creating electrogenic artifacts from skin stretch and muscle movement, such as from facial expressions or neck movement [26] [27].
Q3: Why are hemodynamic signals generally more resilient to motion? Hemodynamic signals (fNIRS/fMRI) are based on optical (fNIRS) or magnetic (fMRI) properties. While motion still causes artifacts, the mechanisms are different:
- fNIRS: Motion primarily causes artifacts by disrupting the optode-scalp coupling, changing the path of near-infrared light rather than the hemodynamic signal itself. This makes it more tolerant of movement, especially in naturalistic settings [26] [4].
- fMRI: Motion causes artifacts by disrupting the magnetic field homogeneity and by physically moving the brain within the imaging volume. While highly sensitive, the artifact is of a physical rather than electrical nature [28] [29].
Table 1: Core Signal Characteristics and Motion Vulnerability
| Feature | EEG (Electroencephalography) | fNIRS (functional NIRS) | fMRI (functional MRI) |
|---|---|---|---|
| What It Measures | Electrical potentials from neurons [26] | Hemodynamic response (blood oxygenation) [26] | Hemodynamic response (BOLD signal) [29] |
| Signal Origin | Direct neural electrical activity [26] | Indirect neurovascular coupling [26] | Indirect neurovascular coupling [29] |
| Primary Motion Artifact Source | Changing electrode-skin interface; muscle activity [27] | Disruption of optode-scalp light coupling [4] [30] | Disruption of magnetic field; physical head movement [29] |
| Inherent Motion Tolerance | Low [26] | Moderate (Better than EEG) [26] | Low (Requires highly controlled environment) |
Troubleshooting Motion Artifacts: A Modality-Specific Guide
EEG Artifact Troubleshooting
Problem: EEG signal shows high-frequency noise or large, abrupt signal shifts coinciding with participant movement.
Solutions:
- Prevention is Key:
- Proper Preparation: Clean the scalp thoroughly to reduce skin impedance. Use high-quality conductive gel or paste and ensure secure electrode attachment [27].
- Equipment Check: Use twisted and shielded cables to reduce cable motion artifacts.
- Algorithmic Correction:
- Wavelet-Based Methods: Techniques like Wavelet Packet Decomposition (WPD) can effectively separate motion artifact components from neural signals in single-channel EEG [31].
- Multi-Stage Denoising: For improved performance, use a two-stage approach like WPD combined with Canonical Correlation Analysis (WPD-CCA), which has been shown to achieve a high percentage reduction in motion artifacts (η ≈ 59.51%) and a significant improvement in signal-to-noise ratio (ΔSNR ≈ 30.76 dB) [31].
- Independent Component Analysis (ICA): This is a powerful blind source separation method that can identify and remove motion-related components from multi-channel EEG data.
EEG Motion Correction Workflow
fNIRS Artifact Troubleshooting
Problem: fNIRS signals show spike-like artifacts or baseline shifts during participant motion.
Solutions:
- Hardware-Based Solutions:
- Accelerometer/IMU: Attach an inertial measurement unit (IMU) to the fNIRS headpiece to directly measure motion. This signal can be used for active noise cancellation (ANC) or accelerometer-based motion artifact removal (ABAMAR) [4].
- Video Tracking: Use infrared thermography (IRT) with a video tracking procedure to monitor optode movement without physical contact, providing a reference signal for artifact correction [30].
- Algorithmic Correction (Without Auxiliary Hardware):
- Wavelet-Based Correction: Similar to EEG, WPD and WPD-CCA are highly effective. The two-stage WPD-CCA method has shown an average ΔSNR of 16.55 dB and η of 41.40% for fNIRS signals [31].
- Other Methods: Spline interpolation, moving average, and principal component analysis (PCA) are also commonly used to model and subtract motion artifacts [4] [30].
fNIRS Motion Artifact Origin
fMRI Artifact Troubleshooting
Problem: fMRI images are blurred or show structured noise patterns due to subject motion or physiological cycles.
Solutions:
- Physiological Noise Correction:
- RETROICOR (Retrospective Image Correction): This method uses recorded cardiac and respiratory signals (e.g., from a pulse oximeter and breathing belt) to model and remove the physiological noise components from the fMRI time series data. It can be applied to individual echoes or composite data in multi-echo fMRI [29].
- Real-Time Correction:
- Prospective Motion Correction: Uses trackers to update the scanner's imaging volume in real-time to account for head motion.
- Data-Driven Methods:
- Multi-Echo Independent Component Analysis (ME-ICA): Leverages multi-echo fMRI data to automatically separate BOLD from non-BOLD (e.g., motion) signal components based on their distinct echo time dependencies [29].
Experimental Protocols for Motion Correction
Protocol 1: Implementing WPD-CCA for Single-Channel EEG/fNIRS
This protocol is adapted from a study that tested the method on a benchmark dataset [31].
Objective: To remove motion artifacts from a single-channel EEG or fNIRS recording using the two-stage WPD-CCA technique.
Materials: See "Research Reagent Solutions" table.
Procedure:
- Signal Acquisition: Record the single-channel EEG or fNIRS signal at your standard sampling rate.
- Wavelet Packet Decomposition (WPD):
- Select a wavelet packet family (e.g., Daubechies 'db1' for EEG, 'db1' or Fejer-Korovkin 'fk4' for fNIRS).
- Decompose the contaminated signal into multiple nodes containing different frequency components.
- Reconstruct Artifact Signal:
- Identify the nodes containing the motion artifacts based on their correlation with the movement's characteristics.
- Reconstruct a "motion-only" signal from these nodes.
- Canonical Correlation Analysis (CCA):
- Treat the reconstructed artifact signal and the original contaminated signal as two variables.
- Apply CCA to find the linear combinations that are maximally correlated between them. This helps in further isolating the artifact component.
- Signal Reconstruction:
- Subtract the artifact component identified by CCA from the original signal.
- Reconstruct the clean EEG/fNIRS signal using the inverse WPD on the corrected nodes.
Validation: The performance can be quantified by the improvement in Signal-to-Noise Ratio (ΔSNR) and the percentage reduction in motion artifacts (η) [31].
Protocol 2: fNIRS Motion Correction with Video Tracking
This protocol is based on a method that uses infrared thermography (IRT) to track optode motion [30].
Objective: To correct fNIRS signals using motion data obtained from a contactless video tracking system.
Materials: See "Research Reagent Solutions" table.
Procedure:
- Synchronized Setup: Position a thermal camera (e.g., FLIR SC660) pointed at the participant's head to record the fNIRS optodes simultaneously with the fNIRS data collection. Precisely synchronize the fNIRS and IRT systems.
- Optode Tracking:
- In the first frame of the thermal video, define a rectangular master ROI (Region of Interest) over an fNIRS detector.
- Use a 2-D cross-correlation algorithm (e.g., with Gaussian pyramid decomposition for speed) to track the movement of this ROI in all subsequent video frames.
- Define and track slave ROIs on the light sources.
- Wavelet and Coherence Analysis:
- Compute the Continuous Wavelet Transform (CWT) of both the fNIRS signal and the tracked optode movement signal.
- Calculate the Wavelet Coherence (WCOH) between the two signals to identify time-frequency points where they are highly correlated.
- Artifact Removal:
- Set a threshold for the movement magnitude and WCOH.
- Perform the inverse CWT on the fNIRS signal, excluding the frequency content at the time points where the movement and coherence exceeded the threshold.
- Signal Output: The result is a motion-corrected fNIRS signal.
Table 2: Performance of Selected Motion Correction Algorithms
| Modality | Correction Method | Key Metric | Reported Performance | Reference |
|---|---|---|---|---|
| EEG | WPD-CCA (db1 wavelet) | ΔSNR (Average) | 30.76 dB | [31] |
| EEG | WPD-CCA (db1 wavelet) | η (Reduction in Artifacts) | 59.51% | [31] |
| fNIRS | WPD-CCA (db1/fk8 wavelet) | ΔSNR (Average) | 16.55 dB | [31] |
| fNIRS | WPD-CCA (db1/fk8 wavelet) | η (Reduction in Artifacts) | 41.40% | [31] |
| EIT (Cardiac) | Source Consistency (vs. ECG) | Correlation (HR) | 0.83 (in high-motion) | [32] |
The Scientist's Toolkit: Research Reagent Solutions
Table 3: Essential Materials for Motion-Resilient Neuroimaging Experiments
| Item Name | Function / Application | Specific Example / Note |
|---|---|---|
| High-Density EEG Cap | Ensures stable electrode placement and better signal source localization. | Often uses the international 10-20 system. Some are compatible with integrated fNIRS optodes [26]. |
| Conductive Gel/Paste | Reduces impedance between electrode and scalp, crucial for minimizing motion-related electrical artifacts in EEG [27]. | Ten20 paste, NeuroPrep gel [27]. |
| Inertial Measurement Unit (IMU) | Measures acceleration and rotation. Used as a reference signal for motion artifact correction in fNIRS and EEG. | Can be attached to the headpiece for adaptive filtering (e.g., ABAMAR, ANC) [4]. |
| Thermal Camera | Contactless tracking of optode or head movement for fNIRS motion correction. | FLIR SC660 camera used for video tracking of fNIRS optodes [30]. |
| Wavelet Packet Decomposition Algorithm | Core signal processing technique for decomposing signals into components for artifact removal. | Implemented in MATLAB, Python (PyWavelets). Use 'db1' or 'fk4' wavelets for optimal results [31]. |
| RETROICOR Software | For removing cardiac and respiratory noise from fMRI data. | Requires peripheral physiological recording (pulse oximeter, respiratory belt) [29]. |
| Synchronization Trigger Box | Precisely aligns data streams from different devices (e.g., EEG, fNIRS, IMU, camera) for multi-modal studies. | Critical for implementing hardware-based correction methods [26]. |
Practical Applications: Matching Neuroimaging Modalities to Experimental and Clinical Settings
Functional Near-Infrared Spectroscopy (fNIRS) has emerged as a particularly valuable neuroimaging tool for studying brain function outside traditional laboratory settings. Its unique combination of portability, motion tolerance, and reasonable spatial resolution makes it ideally suited for naturalistic paradigms in mobile, pediatric, and rehabilitation contexts. This technical support center addresses the key practical challenges researchers face when implementing fNIRS in these ecologically valid environments, with particular emphasis on its advantages for motion-tolerant applications compared to EEG and fMRI.
The core principle of fNIRS involves using near-infrared light to measure changes in cerebral blood oxygenation, which serves as an indirect marker of neural activity via neurovascular coupling [33]. Light emitted at specific wavelengths is partially absorbed by oxygenated (HbO) and deoxygenated hemoglobin (HbR) in the cortical tissue, enabling the calculation of relative concentration changes based on detected light intensity [34] [35]. This optical methodology provides fNIRS with distinct operational advantages for studying brain function in real-world scenarios.
Technical Comparison: fNIRS vs. EEG vs. fMRI for Motion-Tolerant Applications
Comparative Analysis of Neuroimaging Modalities
Table 1: Technical comparison of fNIRS, EEG, and fMRI for naturalistic research
| Feature | fNIRS | EEG | fMRI |
|---|---|---|---|
| Motion Tolerance | High - resistant to movement artifacts [36] [33] | Low - highly susceptible to movement artifacts [36] [33] | Very Low - requires complete stillness [33] |
| Portability | High - wearable, wireless systems available [36] [33] | High - lightweight systems available [36] | Very Low - confined to scanner environment [34] [33] |
| Temporal Resolution | Moderate (seconds) [36] | High (milliseconds) [36] | Low (seconds) [34] |
| Spatial Resolution | Moderate (cortical surface, ~1-2.5 cm depth) [36] | Low [36] | High (whole brain) [33] |
| Primary Signal | Hemodynamic response (blood oxygenation) [36] | Electrical activity [36] | Hemodynamic response (BOLD) [33] |
| Best Use Cases | Naturalistic studies, child development, motor rehabilitation [36] [37] [38] | Fast cognitive tasks, ERP studies, sleep research [36] | Controlled lab studies requiring whole-brain coverage [33] |
| Typical Environment | Real-world settings, clinics, schools [37] [34] [38] | Controlled lab settings [36] | Scanner environment only [33] |
Key Technical Advantages of fNIRS for Naturalistic Paradigms
fNIRS occupies a unique position in the neuroimaging landscape, particularly for studies requiring both mobility and reasonable spatial localization. While EEG provides superior temporal resolution, it suffers from significant motion artifacts and poor spatial accuracy. Conversely, fMRI offers excellent spatial resolution but requires complete immobilization. fNIRS bridges this gap with several distinct advantages:
- Superior motion tolerance compared to both EEG and fMRI, enabling studies involving walking, conversation, and other natural behaviors [33]
- Portability that allows deployment in real-world environments including classrooms, clinics, and homes [34] [33]
- Reduced electromagnetic interference that enables simultaneous use with therapeutic neuromodulation devices [34]
- Tolerance for metallic implants that would preclude fMRI scanning [34]
These characteristics make fNIRS particularly suitable for vulnerable populations including children [34] [38], individuals with neurodevelopmental disorders [38], and patients undergoing rehabilitation who cannot remain perfectly still.
Troubleshooting Guides & FAQs
Pre-Experiment Planning
Q: What is the optimal experimental design for naturalistic fNIRS studies? A: For naturalistic fNIRS studies, block designs with 30-second task intervals typically provide the best signal-to-noise ratio, as they align well with the hemodynamic response timeline [33]. However, event-related designs with irregular timing can also be effective when studying spontaneous real-world behaviors. Ensure your design includes appropriate baseline conditions that are matched to your experimental condition for motor and cognitive aspects.
Q: How do I select appropriate control conditions for real-world fNIRS paradigms? A: Control conditions should account for both the cognitive and motor components of your task. For example, in a rehabilitation study involving reaching movements, your control condition should include similar arm movements without the cognitive component being tested. Well-selected control conditions are essential for isolating the neural correlates of specific functions [33].
Data Acquisition & Signal Quality
Q: How can I minimize motion artifacts during mobile fNIRS recordings? A: Implement a multi-pronged approach:
- Use secure, comfortable headgear with adjustable straps [38]
- Employ motion-tolerant acquisition systems and secure optode attachment [33]
- Implement real-time motion tracking to flag periods of excessive movement
- For pediatric populations, allow for acclimation time and use child-sized caps [38]
- Train research staff to recognize and note behavioral observations that correlate with motion artifacts
Q: What signal quality indicators should I monitor during acquisition? A: Continuously monitor:
- Signal-to-noise ratio for each channel
- Physiological waveforms (cardiac and respiratory pulsations) as indicators of good scalp coupling
- Motion artifact indices provided by your acquisition software
- Consistency of hemodynamic responses across trials and participants
Data Processing & Analysis
Q: What preprocessing pipeline is recommended for naturalistic fNIRS data? A: While pipelines should be tailored to specific experimental needs, a standard approach includes:
- Converting raw light intensity to optical density
- Identifying and correcting motion artifacts using validated algorithms (e.g., wavelet-based, PCA, or spline interpolation methods)
- Bandpass filtering to isolate hemodynamic signals (typically 0.01-0.5 Hz)
- Converting to hemoglobin concentration changes using the Modified Beer-Lambert Law
- Removing physiological noise using short-channel regression or principal component analysis [8]
Q: How can I address the reproducibility challenges in fNIRS analysis? A: Recent large-scale reproducibility initiatives recommend:
- Clearly documenting and reporting all analysis parameters and quality thresholds
- Using automated preprocessing pipelines to minimize researcher bias
- Establishing data quality criteria before analysis
- Sharing analysis code whenever possible
- Teams with higher fNIRS experience show better reproducibility, so consider consulting with experienced researchers [8]
Detailed Experimental Protocols
Protocol 1: Naturalistic Executive Function Assessment After Social Media Use
Table 2: Key reagents and materials for social media impact study
| Item | Function | Specifications |
|---|---|---|
| Wearable fNIRS System | Measures prefrontal cortex hemodynamics | Portable, multi-channel, covers prefrontal regions [37] |
| Executive Function Tasks | Assess cognitive performance | n-back, Go/No-Go paradigms [37] |
| Social Media Platform | Experimental intervention | Passive scrolling (no active engagement) [37] |
| Behavioral Assessment Tools | Measure subjective states | Self-report questionnaires for mood and addiction (e.g., SMAS) [37] |
This protocol demonstrates fNIRS implementation for assessing immediate cognitive impacts of everyday activities:
Participant Preparation:
- Apply fNIRS headgear using international 10-20 system for positioning [37]
- Ensure proper optode-scalp contact with signal quality verification
- Provide clear instructions for both the social media exposure and cognitive tasks
Experimental Procedure:
- Baseline Assessment (Pre-Exposure):
- Administer executive function tasks (n-back, Go/No-Go) while recording fNIRS
- Collect self-report measures of emotional state
Experimental Intervention:
- Social media group: 15 minutes of passive social media scrolling
- Control group: quiet rest or neutral computer activity
Post-Exposure Assessment:
- Repeat executive function tasks with fNIRS recording
- Re-administer self-report measures
Data Analysis:
- Preprocess fNIRS data focusing on prefrontal regions
- Compare HbO concentration changes between pre- and post-exposure
- Correlate neural activation changes with behavioral performance measures [37]
Protocol 2: Verbal Fluency Assessment in Pediatric ADHD
Participant Preparation:
- Use child-sized fNIRS cap with secure, comfortable fit
- Allow child to acclimatize to the equipment in presence of parent
- Provide practice trials to ensure task comprehension [38]
Experimental Procedure:
- Setup:
- Position fNIRS optodes over bilateral prefrontal regions, focusing on DLPFC
- Verify signal quality with child engaged in simple counting task
Task Structure:
- Pre-task baseline (30 s): Counting 1-5 repeatedly
- Verbal fluency task (60 s): Generate words related to specific cues
- Post-task baseline (70 s): Return to counting 1-5
- Change task cues every 20 seconds to maintain engagement [38]
Data Acquisition:
- Record continuous HbO and HbR changes at 11 Hz sampling rate
- Audio record verbal responses for subsequent performance analysis
- Monitor for motion artifacts and note behavioral observations
Analysis Approach:
- Focus on mean amplitude, center of gravity, and initial slope of hemodynamic response
- Correlate DLPFC activation with clinical symptom severity (SNAP-IV scores) [38]
Naturalistic fNIRS Experimental Workflow
The Scientist's Toolkit: Essential Research Reagents & Materials
Table 3: Essential research reagents and solutions for fNIRS naturalistic studies
| Category | Specific Items | Purpose & Application Notes |
|---|---|---|
| fNIRS Hardware | Wearable fNIRS systems (e.g., NIRSport, ETG-one) [37] [38] | Mobile data acquisition; select based on channel count, portability, and compatibility with movement |
| Headgear & Accessories | Child-sized caps [38], adjustable headbands, spare optodes | Ensure proper fit across age groups; maintain signal stability during movement |
| Calibration Tools | Phantom heads, 3D digitization systems (e.g., Polhemus FASTRK) [38] | Verify system performance; accurately localize measurement channels |
| Software Platforms | HOMER2 [38], NIRS Toolbox, custom analysis scripts | Data preprocessing, visualization, and statistical analysis |
| Stimulus Presentation | Tablets, VR headsets, portable computers | Present experimental paradigms in real-world settings |
| Complementary Measures | Motion capture systems, eye trackers, audio recorders | Multimodal data acquisition to contextualize fNIRS signals |
| Quality Assurance Tools | Signal quality indices, motion artifact metrics | Monitor data integrity during acquisition [8] |
| Stimulus Materials | Verbal fluency task cues [38], executive function tasks [37] | Standardized cognitive activation paradigms |
Advanced Technical Considerations
Motion Artifact Management Strategies
Effective motion artifact management requires a proactive approach throughout the experimental pipeline:
Prevention Strategies:
- Use customized headgear for specific populations (e.g., children [38])
- Implement adequate acclimatization periods, especially for clinical populations
- Train participants on task requirements to minimize surprise movements
- Secure cables and equipment to prevent tugging during movement
Correction Approaches:
- Apply validated motion correction algorithms (e.g., wavelet-based, spline interpolation)
- Use short-separation channels to regress out superficial physiological noise
- Implement accelerometer-based motion detection when available
- Establish quality thresholds for segment exclusion [8]
Integration with Complementary Technologies
fNIRS can be effectively combined with other modalities to provide comprehensive insights:
EEG-fNIRS Integration:
- Simultaneously capture electrophysiological and hemodynamic responses [10]
- Use integrated caps with careful placement to avoid interference [36]
- Synchronize systems via TTL pulses or shared clock systems [36]
- Apply data fusion techniques (jICA, CCA) to leverage complementary information [36]
Multimodal Applications:
- Combine with eye tracking to correlate visual attention with prefrontal engagement
- Integrate with motion capture for comprehensive rehabilitation assessment
- Use with physiological monitors (ECG, EDA) to control for autonomic influences
fNIRS Data Processing Pipeline
fNIRS provides an unparalleled neuroimaging platform for studying brain function in real-world contexts where traditional modalities face significant limitations. Its motion tolerance, portability, and compatibility with natural behaviors make it particularly valuable for mobile assessments, pediatric populations, and rehabilitation settings. By implementing the troubleshooting guides, experimental protocols, and technical considerations outlined in this support document, researchers can overcome common challenges and leverage the full potential of fNIRS for ecologically valid cognitive neuroscience.
The future of naturalistic fNIRS research lies in standardized methodologies, improved motion management techniques, and sophisticated multimodal integration. As the field addresses current reproducibility challenges through clearer reporting standards and validated processing pipelines [8], fNIRS is poised to become an increasingly powerful tool for understanding brain function in the complex contexts of everyday life.
Technical Support Center: FAQs & Troubleshooting Guides
Frequently Asked Questions
Q1: What are the primary advantages of EEG in a controlled, stationary lab setting? In a controlled environment where motion is minimized, EEG's core strengths truly shine. Its primary advantages are its exceptional temporal resolution (on the millisecond scale), which allows you to capture fast cognitive processes, and its direct measurement of the brain's electrical activity [39]. Without the confound of motion artifacts, you can achieve a higher signal-to-noise ratio for precise event-related potential (ERP) analysis and study of neural oscillations [40].
Q2: Our EEG signal is consistently noisy across all channels. What could be the cause? Persistent noise across all channels often points to a problem with the ground (GND) or reference (REF) electrodes [41]. This can be due to poor skin contact, high impedance, or oversaturation. To troubleshoot, first re-prep and re-apply these electrodes. As a diagnostic step, try temporarily placing the ground electrode on the participant's hand or an experimenter's hand to see if the signal improves [41].
Q3: What is the best way to remove motion artifacts from EEG data, even in a controlled setting? Even in controlled settings, minor motion artifacts can occur. The optimal method depends on your data and goals. Common and effective techniques include:
- Adaptive filtering, which uses a reference signal from an accelerometer to subtract artifacts [7].
- Signal processing methods like Independent Component Analysis (ICA), which can separate and remove artifact components from neural signals [42] [7].
- Deep learning models like Motion-Net, a subject-specific CNN framework that has demonstrated high efficacy in removing motion artifacts while preserving neural data integrity [7].
Q4: How does EEG's motion tolerance compare to fNIRS and fMRI? This is a key differentiator. The following table summarizes the motion tolerance and other characteristics of these three non-invasive neuroimaging techniques.
Table 1: Comparison of Non-Invasive Neuroimaging Modalities
| Feature | EEG | fNIRS | fMRI |
|---|---|---|---|
| Motion Tolerance | Low (Highly susceptible) [39] | Moderate (More tolerant) [39] | Very Low (Requires near immobility) [43] |
| Temporal Resolution | Excellent (Milliseconds) [39] | Poor (Seconds) [39] | Poor (Seconds) [10] |
| Spatial Resolution | Low [39] | Moderate (Cortical surface) [39] | Excellent |
| Primary Signal | Electrical neuronal activity [39] | Hemodynamic (blood oxygenation) [39] | Hemodynamic (BOLD response) [43] |
| Best for Measuring | Rapid neural dynamics (ERPs, oscillations) [39] | Sustained cortical activity (workload, attention) [39] | Deep brain activity, precise spatial localization |
Q5: Can EEG be integrated with fNIRS, and why would we do this? Yes, simultaneous EEG-fNIRS is a powerful and growing multimodal approach [10] [39]. Integration is feasible because both systems often use the international 10-20 placement system. You would combine them to leverage their complementary strengths: EEG provides the high-temporal-resolution electrical signature of neural events, while fNIRS provides the better-localized hemodynamic response [10]. This is particularly useful for studying neurovascular coupling or obtaining a more complete picture of brain function [39].
Troubleshooting Guide
This guide follows a step-by-step logic to efficiently isolate and resolve common EEG issues in a research setting.
Problem: Poor Signal Quality or Unusual Noise
Table 2: Troubleshooting Common EEG Signal Issues
| Symptom | Potential Cause | Troubleshooting Action |
|---|---|---|
| Noisy signal on all channels | Poor ground or reference electrode connection [41]. | 1. Re-clean and re-apply GND and REF electrodes.2. Try an alternative GND placement (e.g., participant's hand) [41]. |
| Signal drop-out or artifact on a single channel | Dry or clogged electrode; poor contact with scalp [41] [44]. | 1. Add more conductive gel.2. Re-adjust the electrode for better contact.3. Replace the electrode if faulty. |
| Persistent issues after hardware checks | Software, amplifier, or headbox malfunction [41]. | 1. Restart acquisition software and computer.2. Try a different headbox or amplifier system if available [41]. |
| Oversaturation (channels grayed out) | Signal too strong for the amplifier; possible static or skin product issue [41]. | 1. Ensure participant has removed all metal accessories [41].2. Re-clean electrode sites thoroughly. |
Experimental Protocols & Methodologies
Protocol: Combined EEG-fNIRS for Motor Imagery Neurofeedback This protocol, adapted from current research, demonstrates how to leverage EEG in a controlled setup for a classic motor imagery task, with the option to enrich data with fNIRS [10].
Aim: To investigate the effects of unimodal (EEG-only) versus multimodal (EEG-fNIRS) neurofeedback on brain activity during left-hand motor imagery.
Materials:
- Integrated EEG-fNIRS cap (e.g., 32-channel EEG + 16-detector fNIRS) [10].
- Amplifiers and acquisition systems for both modalities.
- A computer with real-time signal processing and feedback presentation software.
Procedure:
- Participant Preparation: Position the participant comfortably in a chair. Fit the integrated cap according to the 10-10 system, focusing electrodes and fNIRS optodes over the right sensorimotor cortex (e.g., C3, C4 locations) [10].
- Calibration: Run a short, non-feedback motor imagery block to calibrate the baseline brain activity for each modality.
- Experimental Conditions: Participants undergo three randomized NF conditions:
- EEG-only NF: Feedback is based on the sensorimotor rhythm (e.g., event-related desynchronization - ERD).
- fNIRS-only NF: Feedback is based on hemodynamic changes (e.g., oxygenated hemoglobin - HbO).
- EEG-fNIRS NF: Feedback is based on a combined score from both EEG and fNIRS signals [10].
- Task & Feedback: In each trial, participants are cued to perform kinesthetic motor imagery of their left hand. A visual feedback element (e.g., a ball on a gauge) moves upwards in real-time proportionally to the level of their calculated NF score [10].
- Data Analysis: Compare the NF scores, the specificity of brain activation in the right motor cortex, and the vividness of motor imagery across the three conditions.
The workflow for this integrated experimental setup is as follows:
The Scientist's Toolkit: Research Reagents & Materials
Table 3: Essential Materials for an EEG-fNIRS Neurofeedback Experiment
| Item | Function / Specification |
|---|---|
| EEG Amplifier System | A high-quality amplifier (e.g., 32-channel ActiCHamp) for recording electrical brain activity with high temporal resolution [10]. |
| fNIRS System | A continuous-wave NIRS device (e.g., NIRScout) with sources and detectors to measure hemodynamic responses [10]. |
| Integrated Cap | A custom cap (e.g., EasyCap) that holds both EEG electrodes and fNIRS optodes in predefined positions over the sensorimotor cortex [10]. |
| Conductive Gel & Abrasive Prep | Electrolyte gel and skin preparation gel to achieve and maintain low-impedance connections (< 10 kΩ) at the scalp [41]. |
| Real-Time Processing Software | Custom software (e.g., using Matlab, Python) for calculating NF scores, processing signals, and presenting visual feedback in real-time [10]. |
| Accelerometer | A motion sensor that can be attached to the participant or system to provide a reference signal for advanced motion artifact removal algorithms [7]. |
Technical Support Center
Troubleshooting Guides
Issue 1: Spurious Activation in High-Resolution fMRI After Motion Correction
- Problem Description: After image-based retrospective motion correction (e.g., using SPM, FSL, AFNI), you observe suspicious or false-positive activation, particularly at the edges of the brain or in areas with high image intensity gradients. This is a known confound in high-field (e.g., 7T) fMRI with partial brain coverage [45].
- Root Cause: Image-based motion detection algorithms can misclassify stimulus-related intensity changes in the EPI time series as head motion. This is exacerbated at ultra-high resolutions where the spatial shift caused by small movements is large relative to the voxel size [45].
- Solution Steps:
- Verify Motion Parameters: Check if the estimated motion parameters from your software are correlated with your task paradigm. A high correlation suggests the motion correction may be removing true activation.
- Use a Gold Standard for Comparison: If available, compare image-based motion estimates with a ground truth, such as data from a prospective motion correction system like Moiré Phase Tracking (MPT) [45].
- Increase Field of View (FOV): If your sequence allows, increase the acquisition FOV. A limited FOV is a dominant factor in this error [45].
- Model Motion Parameters in GLM: Include the motion parameters (e.g., 6 or 24 regressors) as nuisance covariates in your first-level general linear model to account for residual motion-related variance.
- Consider Prospective Correction: For future studies, employ prospective motion correction if your scanner hardware and sequences support it.
Issue 2: Excessive Signal Loss and Geometric Distortion at Ultra-High Field
- Problem Description: Images, particularly in regions like the orbitofrontal cortex and temporal lobes, show severe signal dropouts and distortions, making analysis impossible.
- Root Cause: At high fields (7T and above), magnetic field (B0) inhomogeneities are magnified. The longer readout times (echo train length) required for high-resolution encoding exacerbate T2* blurring and distortion in single-shot EPI [46].
- Solution Steps:
- Implement Parallel Imaging: Use acceleration factors (e.g., GRAPPA, SENSE) to reduce the echo train length. At 7T, acceleration factors of R=4 are readily achievable with a 16-channel coil [46].
- Optimize Sequence Parameters: Reduce the echo time (TE) to be closer to the T2* of tissue at your field strength (~20 ms at 7T) [46].
- Use Advanced Sequences: Consider multi-band echo-volumar imaging (MB-EVI), which combines multiple acceleration methods to achieve sub-second temporal resolution and reduced distortion at high resolutions [47].
- B0 Field Mapping: Acquire a B0 field map during your session to retrospectively correct for geometric distortions in your functional data.
Issue 3: Inadequate Signal-to-Noise Ratio (SNR) in Ultra-High Resolution Acquisitions
- Problem Description: Functional images appear noisy, and BOLD activation is weak or undetectable despite a robust experimental paradigm.
- Root Cause: SNR decreases with the cube of the voxel edge length. Reducing the voxel size from 2 mm isotropic to 0.65 mm isotropic results in an ~27-fold reduction in voxel volume, drastically lowering SNR [45] [48].
- Solution Steps:
- Increase Field Strength: The primary reason for using ultra-high field (7T, 9.4T) is the gains in SNR and BOLD contrast, which can be traded for higher resolution [46].
- Use Multi-Channel Coils: Maximize the number of receive channels in your head coil (e.g., 32-channel or 64-channel) to improve signal reception [48].
- Increase Scan Duration: Acquire more repetitions or runs to increase the number of data points for averaging. Be mindful of participant fatigue and motion over long sessions [46].
- Sequence Optimization: Employ sequences with inherent SNR advantages, such as 3D acquisitions like MS-EVI or MB-EVI [47].
- Denoising: In post-processing, apply advanced denoising techniques like NORDIC, which is compatible with highly accelerated data like MB-EVI [47].
Frequently Asked Questions (FAQs)
Q1: What are the practical resolution limits for human fMRI at 3T vs. 7T? A1: The limits are defined by a trade-off between SNR, acquisition speed, and coverage.
- At 3T, a reasonable upper limit for a whole-brain study with standard single-shot 2D GE-EPI is around 2 mm isotropic with a TR of ~3 seconds [46].
- At 7T, with advanced hardware (e.g., head gradient inserts) and parallel imaging, whole-brain studies can achieve 1 mm isotropic resolution with a TR of under 2 seconds. "Ultra-high" resolutions below 1 mm are feasible but often require restricted coverage or very long scan times [46].
Q2: How does motion tolerance compare between fMRI, fNIRS, and EEG? A2: This is a core consideration in the motion tolerance thesis. The modalities differ significantly, as summarized in the table below.
| Modality | Motion Tolerance | Key Motion-Related Issues | Best Use Case for Motion-Prone Contexts |
|---|---|---|---|
| fMRI | Very Low | Even sub-millimeter motion is problematic at high resolution; causes spin history effects, signal dropouts, and geometric distortions [48]. | Highly constrained, cooperative subjects where supreme spatial resolution is the absolute priority [45]. |
| fNIRS | Moderate/High | Relatively robust to movement artifacts; more portable and suitable for naturalistic settings [49] [3]. | Real-world environments, studies with children, or tasks requiring mobility (e.g., driving simulations) [49] [3]. |
| EEG | Low | Highly susceptible to movement artifacts (muscle, cable movement); often requires strict immobility [49] [27]. | Controlled lab environments where millisecond temporal resolution is critical [49]. |
Q3: What is the role of fMRI in drug development? A3: fMRI can serve as a pharmacodynamic biomarker to de-risk drug development [50] [51].
- Early Phase (1): It can demonstrate that a drug engages a functional brain system, inform dose-response relationships via its effect on brain circuits, and provide evidence of brain penetration [51].
- Later Phase (2/3): It can be used to demonstrate normalization of disease-related brain activity and potentially enrich trials by selecting patients most likely to respond to therapy [50] [51]. No fMRI biomarker has yet been fully qualified by regulatory agencies for this purpose, but efforts are underway [50].
Q4: Are there alternatives to retrospective image-based motion correction? A4: Yes, prospective motion correction (PMC) is a superior but more complex alternative.
- How it works: PMC systems (e.g., optical tracking like MPT) continuously measure head position in real-time and update the scanner's imaging coordinate system slice-by-slice or volume-by-volume to account for motion during acquisition [45] [48].
- Advantage: Prevents motion from occurring in the first place, rather than trying to estimate and correct for it afterwards. This avoids the introduction of spurious activation and preserves the integrity of the time series signal [45].
Experimental Protocols: Key Methodologies
Protocol 1: Evaluating Motion Correction Efficacy with Prospective Motion Tracking
- Purpose: To systematically quantify the confounding effects of retrospective motion correction algorithms and their dependence on spatial resolution [45].
- Setup: Acquire fMRI data (e.g., a visual task) at two resolutions (e.g., 2.0 mm³ and 0.65 mm³ isotropic) at 7T. Simultaneously, track head motion with a high-precision, non-image-based system (e.g., Moiré Phase Tracking - MPT) [45].
- Procedure:
- Process the fMRI data with common software (FSL, AFNI, SPM), applying their respective retrospective motion correction tools.
- Use the prospective MPT motion parameters as the gold standard to evaluate the accuracy of the image-based motion estimates.
- Generate brain activation maps using both the image-based and MPT motion parameters.
- Quantify the rate of false-positive and false-negative activations introduced by the image-based methods, particularly near brain edges [45].
- Analysis: Compare activation maps and motion parameter time series. Correlate stimulus paradigms with residual motion after correction to identify spurious correlations.
Protocol 2: High-Resolution Resting-State fMRI using Multi-Band EVI
- Purpose: To achieve high spatial-temporal resolution for mapping functional connectivity, including high-frequency signals, across the whole brain [47].
- Pulse Sequence: Use a Multi-band Echo-Volumar Imaging (MB-EVI) sequence.
- Key Parameters (Example from [47]):
- Voxel Size: 1 mm to 3 mm isotropic.
- Temporal Resolution (TR): 118 ms to 650 ms.
- Acceleration: Combines multi-band encoding (e.g., 6 slabs), in-plane GRAPPA, and multi-shot slab segmentation.
- Online Processing: Implement exponential deconvolution of T2* signal decay to reduce spatial blurring.
- Procedure:
- Acquire resting-state data over a typical duration (e.g., 10-15 minutes).
- Preprocess data with motion correction, coregistration, and normalization.
- Perform connectivity analysis (e.g., seed-based or ICA) on standard (0.01-0.1 Hz) and high-frequency (e.g., >0.3 Hz) bands, enabled by the very short TR [47].
- Outcome: Sensitive mapping of resting-state networks at high spatial resolution, with the ability to resolve dynamic connectivity changes.
The Scientist's Toolkit: Research Reagent Solutions
Table: Essential Materials and Tools for High-Resolution fMRI
| Item | Function & Brief Explanation |
|---|---|
| High-Field MRI Scanner (7T+) | Provides the essential high intrinsic Signal-to-Noise Ratio (SNR) and BOLD contrast-to-noise ratio (CNR) required to resolve small voxels without excessive averaging [46]. |
| Multi-Channel Receive Coil (e.g., 32/64-ch) | Acts as a high-sensitivity "signal antenna." More channels improve parallel imaging performance (lower g-factor) and increase overall SNR, which is critical for high-resolution imaging [46]. |
| Prospective Motion Correction (PMC) System | A hardware solution (e.g., optical camera + marker) that tracks head motion in real-time and updates the scanner, preventing motion artifacts from being introduced during acquisition. Crucial for realizing nominal ultra-high resolution [45] [48]. |
| Accelerated Acquisition Sequences | Software "reagents" like Multi-band EPI (MB-EPI) or Echo-Volumar Imaging (EVI). They reduce readout times, minimizing T2* blurring and distortions, which is vital for image quality at high resolutions and high fields [47] [46]. |
| Advanced Denoising Software (e.g., NORDIC) | A post-processing tool that suppresses noise in the reconstructed images, effectively enhancing the SNR after data acquisition. Particularly beneficial for highly accelerated, high-resolution data [47]. |
Decision and Signaling Workflows
Choosing a Neuroimaging Modality Based on Motion Tolerance and Resolution Needs
fMRI Motion Artifact Causation and Remediation Pathway
Motion artifacts present a significant challenge in neuroimaging studies for drug development, particularly when assessing central nervous system (CNS) therapeutics in patient populations who may have difficulty remaining still. This technical guide compares the motion tolerance of three key neuroimaging modalities—functional near-infrared spectroscopy (fNIRS), electroencephalography (EEG), and functional magnetic resonance imaging (fMRI)—and provides practical troubleshooting advice for implementing these technologies in pharmaceutical research settings.
Motion Tolerance Comparison: fNIRS vs. EEG vs. fMRI
Table 1: Technical comparison of motion tolerance across neuroimaging modalities
| Feature | fNIRS | EEG | fMRI |
|---|---|---|---|
| Primary Signal Measured | Hemodynamic response (blood oxygenation) [52] | Electrical activity of neurons [52] | Blood Oxygen Level Dependent (BOLD) signal [53] |
| Spatial Resolution | Moderate (1-3 cm) [53] | Low (centimeter-level) [52] | High (millimeter-level) [53] |
| Temporal Resolution | Low (seconds) [52] | High (milliseconds) [52] | Low (seconds) [53] |
| Motion Tolerance | High - relatively robust to movement artifacts [52] [54] | Moderate - susceptible to movement artifacts but mobile systems available [52] [55] | Low - highly sensitive to motion; requires immobility [53] [23] |
| Portability | High - portable and wearable systems [54] | High - mobile/wireless systems available [55] | Low - immobile systems requiring specialized facilities [53] |
| Best Use Cases in Drug Development | Naturalistic studies, pediatric populations, rehabilitation monitoring [52] [54] | Fast cognitive tasks, ERP studies, sleep research, longitudinal monitoring [52] [55] | Precise spatial localization, deep brain structure investigation [53] |
Table 2: Application suitability for different therapeutic areas
| Therapeutic Area | Recommended Modality | Rationale |
|---|---|---|
| Neurodegenerative Diseases (e.g., Alzheimer's, Parkinson's) | fNIRS [54] | Tolerates mild tremors and restless behaviors common in patients |
| Psychiatric Disorders (e.g., schizophrenia, depression) | fNIRS with optional EEG integration [54] [56] | Allows monitoring during more natural social interactions |
| Epilepsy | Mobile EEG [57] [55] | Enables long-term monitoring of seizure activity in real-world settings |
| Pediatric CNS Disorders | fNIRS [54] | More tolerant of natural movement in children; safer for repeated measures |
| Stroke Rehabilitation | fNIRS or mobile EEG [54] [55] | Monitors cortical activation during physical therapy and movement exercises |
Troubleshooting Guides & FAQs
FAQ 1: How can I minimize motion artifacts in fMRI studies for drug trials?
Challenge: fMRI is highly sensitive to head movement, which can corrupt data quality and lead to inaccurate assessment of drug effects on brain function.
Solutions:
- Prospective Motion Correction: Implement real-time motion tracking and correction systems [23].
- Retrospective Data Processing: Apply advanced denoising pipelines such as:
- Participant Preparation: Use customized head restraints, practice sessions in mock scanners, and provide clear motion minimization instructions [53].
- Protocol Design: Incorporate brief scanning sessions and include rest breaks to reduce participant fatigue [53].
FAQ 2: When should I choose fNIRS over EEG for monitoring drug effects in naturalistic settings?
Decision Framework:
- Choose fNIRS when:
- Studying sustained cognitive states, workload, or affective processing [52]
- Investigating cortical regions near the brain surface, particularly prefrontal cortex [52] [54]
- Working with populations prone to movement (children, elderly, patients with motor impairments) [54]
- Conducting studies in real-world environments (clinics, homes, rehabilitation settings) [54]
Choose EEG when:
- Capturing rapid neural dynamics (sensory processing, stimulus perception) with millisecond precision [52]
- Monitoring sleep architecture or epileptiform activity in ambulatory patients [55]
- Assessing event-related potentials (ERPs) in response to specific stimuli [55]
- Operating with budget constraints (EEG systems are generally lower cost than fNIRS) [52]
Consider multimodal fNIRS-EEG when:
FAQ 3: What practical strategies can improve data quality in mobile EEG studies for CNS drug development?
Challenge: While mobile EEG offers greater motion tolerance than traditional systems, movement artifacts still present data quality challenges.
Solutions:
- Advanced Hardware Selection:
Motion Artifact Mitigation:
Experimental Design Considerations:
FAQ 4: How can I effectively integrate fNIRS and EEG for comprehensive CNS drug evaluation?
Integration Benefits: Combined fNIRS-EEG provides simultaneous electrical and hemodynamic information, offering a more complete picture of neural activity and drug effects [9].
Technical Implementation:
- Hardware Setup:
Synchronization:
Data Fusion and Analysis:
Case Study Example: In a study examining motor execution, observation, and imagery, simultaneous fNIRS-EEG recordings revealed complementary activation patterns. The fused data consistently identified activation in the left inferior parietal lobe, superior marginal gyrus, and post-central gyrus across all conditions, demonstrating the value of multimodal approaches for studying the Action Observation Network [9].
FAQ 5: What are the key methodological considerations for implementing fNIRS in clinical trials for movement disorders?
Solution Framework:
- Protocol Design:
- Incorporate tasks that are clinically relevant yet compatible with the technology (e.g., simple motor tasks, cognitive tests) [54]
- Include appropriate controls for systemic physiological confounds (heart rate, blood pressure, respiration) [59]
- Standardize testing conditions across multiple trial sites [54]
Data Quality Assurance:
Clinical Validation:
Experimental Protocols for Motion-Tolerant Neuroimaging in Drug Development
Protocol 1: fNIRS for Prefrontal Cortex Assessment in Antipsychotic Drug Trials
Background: fNIRS has been successfully used to identify functional abnormalities in the prefrontal cortex in schizophrenia patients, making it a promising tool for evaluating antipsychotic drug efficacy [54].
Methodology:
- Task Design: Verbal fluency task (VFT) with pre-task baseline, task period, and post-task baseline
- Duration: 5-minute baseline, 3-minute task period, 2-minute recovery
- fNIRS Parameters:
- Measure oxygenated (HbO) and deoxygenated hemoglobin (HbR) concentrations
- Focus on prefrontal cortex coverage with 16-32 channels
- Sampling rate: 10 Hz
- Primary Outcomes: HbO changes during VFT compared to baseline
- Motion Mitigation: Use a head cap with secure optode placement, allow for natural head movements while avoiding excessive motion
Validation Approach: Compare fNIRS findings with clinical scales (PANSS, BPRS) and cognitive battery results [54].
Protocol 2: Mobile EEG for Monitoring Antiepileptic Drug Effects
Background: Mobile EEG enables long-term monitoring of epileptiform activity in real-world settings, providing complementary data to traditional clinic-based EEG.
Methodology:
- Device Selection: Choose discreet, comfortable systems suitable for extended wear (e.g., ear-EEG devices) [57]
- Recording Parameters:
- Minimum 24-hour recording period to capture circadian variations
- Include various activity states (sleep, rest, activities of daily living)
- Synchronize with medication administration times and seizure diaries
- Data Analysis:
- Automated detection of interictal epileptiform discharges (IEDs)
- Spectral analysis to identify drug-related changes in background activity
- Seizure detection and characterization algorithms
- Outcome Measures: IED frequency, seizure frequency and duration, spectral power in key frequency bands
Advantages Over Traditional EEG: Captures epileptiform activity that may be missed in brief clinical recordings, provides correlation with real-world triggers [55].
Research Reagent Solutions
Table 3: Essential materials and technologies for motion-tolerant neuroimaging
| Item | Function | Specification Considerations |
|---|---|---|
| fNIRS Systems | Measures cortical hemodynamics | Continuous wave systems for cost-effectiveness; time-domain for depth resolution [59] |
| Mobile EEG Devices | Records electrical brain activity | Wireless systems with dry electrodes for ease of use; active electrodes for noise reduction [55] |
| Integrated fNIRS-EEG Caps | Enables simultaneous multimodal recording | Pre-configured caps with compatible placement for both modalities [52] [9] |
| Motion Tracking Sensors | Quantifies head movement | Accelerometers, gyroscopes integrated into headwear [23] |
| 3D Digitization Systems | Documents precise sensor locations | Magnetic or optical systems for coregistration with brain anatomy [9] |
| Artifact Removal Software | Corrects motion artifacts | Algorithms specific to each modality (e.g., ICA-AROMA for fMRI, motion correction algorithms for fNIRS) [23] [58] |
| Multimodal Data Fusion Platforms | Integrates different neuroimaging data | Support for techniques like ssmCCA, jICA [9] |
Decision Framework for Technology Selection
Technology Selection Decision Tree
Key Takeaways for Drug Development Professionals
fNIRS offers the strongest motion tolerance among the three modalities, making it particularly valuable for studies involving naturalistic behaviors, rehabilitation monitoring, and special populations [54].
EEG provides the best temporal resolution for capturing rapid neural dynamics and can be implemented in mobile configurations for real-world monitoring [52] [55].
fMRI delivers superior spatial resolution but requires careful motion mitigation strategies, making it most suitable for highly controlled laboratory settings [53] [23].
Multimodal approaches combining fNIRS and EEG can provide complementary data streams that overcome the limitations of individual modalities [52] [9].
Technology selection should be driven by specific research questions, patient populations, and experimental contexts rather than assuming a one-size-fits-all solution.
By understanding the relative strengths and limitations of each modality and implementing appropriate motion mitigation strategies, drug development researchers can successfully leverage neuroimaging technologies to evaluate CNS therapeutics even in challenging research populations and settings.
FAQs: fNIRS, EEG, and fMRI Motion Tolerance
How does motion tolerance compare between fNIRS, EEG, and fMRI in real-world settings?
fNIRS offers the highest motion tolerance, making it ideal for ecological studies, while EEG is moderately tolerant, and fMRI requires near-complete immobility.
| Feature | fNIRS | EEG | fMRI |
|---|---|---|---|
| Primary Signal Measured | Hemodynamic response (blood oxygenation) [60] | Electrical activity of neurons [60] | Blood oxygenation level-dependent (BOLD) signal |
| Motion Tolerance | High – Relatively robust to movement artifacts [60] [3] | Moderate – Susceptible to movement artifacts [60] [61] | Very Low – Requires near-complete immobility [3] |
| Typical Experimental Setting | Naturalistic, mobile settings (e.g., workplaces, classrooms) [3] | Controlled lab to moderately mobile settings [61] | Highly controlled laboratory (scanner environment) [10] |
| Common Motion Artifact Sources | Head movements, optode displacement, facial muscle movements [62] [4] | Head and body movements, muscle activity (EMG), eye blinks (EOG) [63] | Any head movement, even millimeters can cause artifacts [64] |
| Key Motion Correction Strategies | Accelerometer-based algorithms, computer vision, signal processing (e.g., ABAMAR) [62] [4] | Independent Component Analysis (ICA), wavelet transforms, auxiliary sensors (IMUs) [63] | Prospective Motion Correction (PMC), real-time tracking, post-processing [64] |
What are the best practices for minimizing motion artifacts in fNIRS studies?
Minimizing motion artifacts in fNIRS involves a combination of hardware, setup, and signal processing strategies.
- Secure Optode Placement: Ensure the cap has a tight but comfortable fit to minimize optode movement relative to the scalp. The adherence and fit of the cap are crucial in managing motion artifacts [62].
- Use Auxiliary Hardware: Integrate inertial measurement units (IMUs) or accelerometers to record head motion. This data is invaluable for algorithms like Accelerometer-Based Motion Artifact Removal (ABAMAR) [4].
- Apply Advanced Signal Processing: Implement motion correction algorithms such as targeted Principal Component Analysis (tPCA) or wavelet-based methods to identify and clean contaminated signal segments without discarding entire datasets [4].
- Characterize Movement: Understand that different movements (e.g., upward/downward vs. rotational head turns) affect different brain regions (e.g., occipital vs. temporal) with varying severity, informing protocol design [62].
How can I improve signal quality in wearable EEG experiments outside the lab?
Wearable EEG faces unique challenges from dry electrodes and uncontrolled environments, requiring specific artifact management pipelines.
- Artifact Detection and Identification: Use algorithms to detect artifacts and identify their category (e.g., ocular, muscular). Wavelet transforms and Independent Component Analysis (ICA) are common for managing ocular and muscular artifacts, while Deep Learning approaches are emerging for motion artifacts [63].
- Leverage Auxiliary Sensors: Despite being underutilized, sensors like IMUs can significantly enhance artifact detection under ecological conditions by providing a direct measure of head motion [63].
- Optimize Electrode Technology: Choose dry electrode EEG headsets or ear-EEG systems with ultra-high impedance amplifiers. These systems handle higher contact impedances and offer faster setup times, improving comfort for long-term recordings [61].
Can fNIRS and EEG be used together, and what are the benefits?
Yes, fNIRS and EEG are highly complementary and can be used in a multimodal approach to provide a more comprehensive view of brain activity.
- Combining Strengths: This hybrid approach leverages EEG's high temporal resolution (milliseconds) with fNIRS's better spatial resolution and tolerance to movement [60] [10].
- Enriched Data: It allows for the simultaneous capture of the brain's electrical (neuronal firing) and hemodynamic (metabolic) responses, providing insights into neurovascular coupling [10].
- Improved Brain-Computer Interface (BCI) Performance: Multimodal systems can enhance the accuracy of decoding brain activity for applications like motor imagery-based BCIs and neurofeedback [10] [65].
- Integration Considerations: Successful integration requires careful sensor placement compatibility (often using the 10-10 system), hardware synchronization via triggers, and the use of motion correction algorithms tailored to each modality [60] [10].
What experimental protocols are used to study motion artifacts?
Researchers use controlled protocols to systematically induce and characterize motion artifacts for developing correction algorithms.
fNIRS Protocols: Participants are instructed to perform a series of controlled, stereotyped head movements. These are often categorized by:
- Axis: Vertical (e.g., nodding), frontal (e.g., bending left/right), sagittal (e.g., turning left/right) [62].
- Speed: Fast vs. slow movements [62].
- Type: Half-rotations, full rotations, or repeated rotations [62].
- Monitoring: Sessions are typically video-recorded and analyzed frame-by-frame using computer vision (e.g., deep neural networks like SynergyNet) to extract precise head orientation angles, which are then correlated with artifacts in the fNIRS signal [62].
Wearable EEG Protocols: Studies assess performance during tasks that involve naturalistic movement. Artifact detection pipelines are validated using metrics like accuracy (when a clean reference is available) and selectivity (the ability to preserve the physiological signal of interest) on datasets containing labeled artifacts [63].
Troubleshooting Guides
Problem: Excessive noise in fNIRS data during a mobile experiment.
Solution: Follow this systematic workflow to diagnose and correct the issue.
Actions:
- Inspect Raw Signals: Plot the raw light intensity data. Look for sudden, large spikes or baseline shifts that are characteristic of motion artifacts [4].
- Check Hardware: Ensure the cap is snug and all optodes have stable, proper contact with the scalp. The cap adherence is a primary factor [62].
- Correlate with Movement: Synchronize the fNIRS data with video recordings or accelerometer data to confirm specific movements caused the noise [62].
- Select Correction Method: Choose an algorithm based on the artifact type and available data.
- Validate: After correction, check that the hemodynamic response appears physiologically plausible and that the signal-to-noise ratio has improved.
Problem: EEG data from a wearable headset is contaminated with muscle and movement artifacts.
Solution: Implement a robust preprocessing pipeline designed for wearable EEG.
Actions:
- Filtering: Apply a bandpass filter (e.g., 1-40 Hz) to remove slow drifts and high-frequency line noise.
- Artifact Detection: Run an algorithm like Artifact Subspace Reconstruction (ASR) to identify and remove periods of high-amplitude noise. Alternatively, use Wavelet transforms or ICA to find components representing blinks, eye movements, and muscle activity [63].
- Artifact Identification: Classify the detected artifacts by type (ocular, muscular, motion). This is a critical step for choosing the most effective removal strategy and is often overlooked [63].
- Targeted Removal: For ICA, manually or automatically reject components identified as artifacts. For other methods, clean or remove the contaminated data segments.
- Validate: Compare the power spectral density before and after cleaning. Check for the removal of high-frequency muscle noise and the preservation of expected neural oscillations.
The Scientist's Toolkit: Key Research Reagent Solutions
| Item | Function | Example Use Case |
|---|---|---|
| Accelerometer / IMU | Records head acceleration and rotation, providing a reference signal for motion artifact correction algorithms in both fNIRS and EEG [4] [63]. | Quantifying the timing and intensity of head movements during an fNIRS study of occupational workload [3]. |
| Computer Vision System | Uses camera and deep learning models (e.g., SynergyNet) to track head pose and movement without physical contact, useful for characterizing artifacts [62]. | Providing ground-truth movement data in a controlled fNIRS motion artifact study [62]. |
| Dry Electrode EEG System | Allows for rapid EEG setup without conductive gel, enabling easier and more comfortable long-term or field recordings [61]. | Monitoring cognitive load in professionals (e.g., surgeons, pilots) in their natural work environment [63] [3]. |
| Integrated EEG-fNIRS Cap | A custom cap that holds both EEG electrodes and fNIRS optodes in a predefined arrangement, facilitating multimodal brain imaging [10]. | Investigating the relationship between electrical brain activity and hemodynamic responses during a motor imagery task [10]. |
| Artifact Subspace Reconstruction (ASR) | A statistical EEG cleaning method that removes high-variance components in real-time or offline, effective for large-amplitude motion artifacts [63]. | Cleaning data from a wearable EEG headset used in a brain-computer interface application involving slight movements [63]. |
Advanced Motion Artifact Mitigation: Techniques and Technologies for Signal Correction
> FAQs: Hardware Solutions for Motion Artifact Mitigation
Q1: What are the primary hardware-based approaches for motion artifact correction in fNIRS and EEG? The two main hardware strategies are ancillary sensor integration and improved physical interface design. Integrating accelerometers or other motion sensors allows for direct measurement of head movements, which can then be used to inform algorithmic correction of the acquired brain signals [66] [67]. Alternatively, enhancing the stability of the optode-scalp (for fNIRS) or electrode-scalp (for EEG) coupling through customized helmet designs or specialized fixation methods can directly reduce the occurrence of motion artifacts [68].
Q2: How is accelerometer data used to correct motion artifacts in fNIRS signals? Accelerometers provide an independent measure of head movement. This data serves as a reference for the timing and intensity of motion events. Several advanced processing techniques leverage this information:
- Adaptive Filtering and Active Noise Cancellation: The accelerometer signal is used as a noise reference to adaptively filter out motion artifacts from the fNIRS signal [69].
- Accelerometer-based Motion Artifact Removal (ABAMAR): This method uses accelerometer data to identify segments of the fNIRS signal that are contaminated by motion for subsequent correction or rejection [69].
- Blind Source Separation: This technique uses the accelerometer signal to help separate motion artifacts from the brain signal of interest within the fNIRS data [69].
Q3: Why are traditional EEG labs considered problematic for motion-tolerant research? Traditional EEG labs face significant limitations for real-world monitoring due to three key factors:
- High Operational Costs and Limited Accessibility: Maintaining a 24-hour EEG service is financially burdensome, with labor costs constituting up to 98% of total expenditures. This creates diagnostic bottlenecks, particularly in low-income regions [61].
- Patient Discomfort and Restricted Mobility: Patients are often confined to a bed for 3-7 days, experiencing physical discomfort and privacy issues, which is incompatible with monitoring natural brain activity [61].
- Incompatibility with Real-World Monitoring: The requirement for controlled, immobile environments (like Faraday cages) prevents the capture of authentic neurological activity during natural movement and daily functions [61].
Q4: What novel methods are emerging for obtaining ground-truth movement data? Beyond accelerometers, Computer Vision (CV) approaches are now being developed. These methods use deep learning models, such as a 1D-UNet, to automatically detect and annotate head movements from standard video recordings of experimental sessions. This provides an efficient, cost-effective solution for obtaining objective ground-truth movement data without requiring additional sensors attached to the participant [69].
> Troubleshooting Guides
Issue 1: Inconsistent Motion Artifact Correction with Accelerometer Data
Problem: The accelerometer data is not synchronizing properly with the fNIRS/EEG signals, or the correction algorithm is not effectively removing artifacts.
Solution:
- Verify Hardware Synchronization: Ensure the accelerometer and your primary neuroimaging device (fNIRS/EEG) share a common trigger pulse or clock signal for precise temporal alignment [68]. Check manufacturer specifications for recommended synchronization protocols.
- Inspect Signal Quality: Visually compare the raw accelerometer signal with the raw fNIRS/EEG signal. Prominent motion events should be visible in both data streams at the same time points. A dedicated preprocessing step to synchronize the data by aligning these motion event peaks may be necessary [7].
- Validate Algorithm Inputs: Confirm that the motion correction algorithm (e.g., Adaptive Filtering, ABAMAR) is receiving the accelerometer data in the correct format (units, sampling rate, and channel order). Consult the algorithm's documentation for specific requirements [69].
Issue 2: Unstable Optode-Scalp Interface Causing Signal Drop-Out
Problem: The fNIRS optodes lose contact with the scalp during participant movement, leading to severe motion artifacts or complete signal loss.
Solution:
- Implement Mechanical Isolation Designs: Use optode holders with patented mechanical isolation or spring-loading mechanisms. These stabilizers maintain consistent pressure and contact even during movement, preventing displacement and reducing motion artifacts [61] [68].
- Adopt Customized Helmet Designs: Replace standard elastic caps with customized, rigid helmet solutions. 3D-printed helmets or those made from cryogenic thermoplastic sheets can be tailored to an individual's head morphology, ensuring a secure and stable fit for all optodes and electrodes [68].
- Use Enhanced Fixation Methods: In studies requiring high motion tolerance, consider using collodion-fixed prism-based optical fibers or other adhesive methods to secure optodes directly to the scalp, drastically improving coupling stability [66].
> Performance Comparison of Hardware and Algorithmic Solutions
The table below summarizes key metrics for various motion artifact mitigation approaches, highlighting the comparative advantages of hardware solutions.
Table 1: Performance Comparison of Motion Artifact Solutions in Neuroimaging
| Method Category | Specific Technique | Reported Performance Metric | Value | Key Advantage |
|---|---|---|---|---|
| Hardware (Accelerometer) | Acceleration-based Movement Artifact Reduction [69] | Improved artifact identification | N/A | Provides direct, independent measure of motion. |
| Hardware (Interface) | Dry Electrode EEG [61] | Setup Time | ~4.02 minutes | Faster setup, no skin preparation. |
| Hardware (Interface) | Customized 3D-Printed Helmets [68] | Probe stability | High | Excellent optode/scalp coupling, reduced displacement. |
| Algorithmic (fNIRS) | Spline + Wavelet Hybrid [67] | Channel Improvement Rate | 94.1% | Effective for both baseline shifts & sharp spikes. |
| Algorithmic (EEG) | Motion-Net (Deep Learning) [7] | Artifact Reduction (η) | 86% ± 4.13% | Subject-specific correction. |
| Algorithmic (EEG) | Motion-Net (Deep Learning) [7] | Signal-to-Noise Ratio (SNR) Improvement | 20 ± 4.47 dB | Significant signal quality enhancement. |
> Experimental Protocol: Computer Vision for Ground-Truth Movement Annotation
Objective: To obtain accurate, automated ground-truth data for head movements during an fNIRS experiment, enabling robust evaluation of motion artifact correction algorithms [69].
Materials:
- Standard webcam or video camera.
- fNIRS system (e.g., NIRSport2).
- Computer with Python/Matlab and deep learning libraries (e.g., PyTorch, TensorFlow).
Procedure:
- Experimental Setup: Position the camera to capture a clear view of the participant's head. Ensure good lighting. Synchronize the camera's recording start time with the fNIRS system.
- Data Collection: Instruct participants to perform a series of controlled head movements (e.g., nodding, shaking, tilting) at various speeds and ranges. Record these sessions simultaneously with the video camera and fNIRS system.
- Head Orientation Extraction: Use a pre-trained computer vision model (e.g., SynergyNet [69]) to process the video and extract time-series signals of head orientation (pitch, yaw, roll).
- Movement Annotation: Implement a 1D-UNet model to perform semantic segmentation on the head orientation signals. Train the model to identify and annotate the start and end points of each distinct head movement.
- Model Validation: Compare the model's automated annotations against manually created ground-truth annotations. Use the Jaccard index (intersection over union) to evaluate performance, with values above 0.8 indicating strong agreement [69].
- Application: Use the validated movement annotations as a ground truth to benchmark and refine the performance of motion artifact correction algorithms on the synchronized fNIRS data.
> Experimental Workflow: Hardware-Assisted Motion Artifact Correction
The following diagram illustrates the logical workflow for integrating hardware solutions into a neuroimaging data processing pipeline to mitigate motion artifacts.
> The Scientist's Toolkit: Key Research Reagent Solutions
Table 2: Essential Materials for Hardware-Based Motion Mitigation
| Item | Function/Application |
|---|---|
| Tri-axial Accelerometer | Integrated into the headcap to provide a reference signal for the timing and magnitude of head movements, which is crucial for algorithms like ABAMAR and Adaptive Filtering [66] [69]. |
| 3D Motion Capture System | An external, high-precision system used to track head movement with great accuracy, often serving as a gold standard for validating other motion-tracking methods or correction algorithms [66]. |
| Custom 3D-Printed Helmet | A rigid, subject-specific substrate that ensures optimal and stable placement of fNIRS optodes and EEG electrodes, minimizing movement-induced changes in the scalp-probe interface [68]. |
| Cryogenic Thermoplastic Sheet | A moldable material that can be heated and formed to create a custom-fitted helmet for stable optode/electrode placement, improving comfort and coupling stability [68]. |
| Dry-Contact EEG Electrodes | Electrodes that do not require conductive gel, enabling faster setup and greater user comfort for long-term monitoring. They often feature ultra-high impedance amplifiers to handle poor contact impedance [61]. |
| Optode Mechanical Stabilizers | Spring-loaded or patented isolation systems that hold fNIRS optodes firmly against the scalp, maintaining consistent pressure and distance to reduce motion artifacts during movement [61] [68]. |
| Computer Vision Software (e.g., SynergyNet) | Pre-trained models that extract head pose and orientation data from standard video recordings, providing a non-contact method for obtaining ground-truth movement annotations [69]. |
Within a thesis investigating the motion tolerance of functional near-infrared spectroscopy (fNIRS) compared to electroencephalography (EEG) and functional magnetic resonance imaging (fMRI), a primary challenge is mitigating motion artifacts in fNIRS data. Unlike fMRI, which requires complete participant immobility and is highly sensitive to motion, and EEG, which is susceptible to electrical noise from movement, fNIRS offers a unique balance of portability and moderate motion tolerance [70] [71] [3]. However, fNIRS signals are still contaminated by motion artifacts, often manifested as sharp peaks or baseline shifts, which can severely hamper data interpretation [72]. Deep learning denoising autoencoders (DAEs) represent a state-of-the-art, assumption-free approach to this problem, enabling cleaner signal recovery and enhancing the validity of fNIRS in real-world, mobile experiments [72].
The following table compares the key characteristics of these neuroimaging modalities regarding motion tolerance:
| Feature | fNIRS | EEG | fMRI |
|---|---|---|---|
| Motion Tolerance | Moderate to High (tolerant to movement, but artifacts occur) | Low (susceptible to electrical noise from movement) | Very Low (requires complete immobility) [71] |
| Portability | High (wearable, wireless systems available) | High (lightweight and wireless systems) | None (stationary scanner) [71] |
| Typical Real-World Application | Naturalistic studies, child development, occupational workload [3] | Controlled lab environments [70] | Stationary tasks in a lab [71] |
| Primary Motion Artifact Type | Peaks and shifts from optode-scalp coupling changes [72] | Muscle and electrode movement artifacts | Head movement causing image misregistration |
Deep Learning Denoising Autoencoders (DAEs): Core Methodology
A Denoising Autoencoder (DAE) is a deep neural network trained to reconstruct a clean version of its input from a corrupted or noisy version. In the context of fNIRS, the model learns the complex features of motion artifacts to separate them from the underlying hemodynamic response [72].
Architecture and Workflow
The DAE model for fNIRS signal recovery typically employs a convolutional neural network (CNN) architecture with an encoder-decoder structure. The encoder compresses the noisy input signal into a lower-dimensional representation, forcing the network to learn its essential features. The decoder then uses this representation to reconstruct the clean signal.
Specialized Loss Function
A critical component of training an effective DAE is the design of the loss function. Research has shown that using a dedicated loss function that combines traditional metrics like Mean Squared Error (MSE) with other constraints tailored to fNIRS data properties leads to superior performance. This specialized loss helps the model not only minimize the overall error but also better preserve the physiological characteristics of the hemodynamic response [72].
Performance Evaluation: DAE vs. Conventional Methods
Quantitative evaluation is essential to validate the efficacy of any denoising algorithm. The DAE model has been benchmarked against conventional motion artifact removal methods, demonstrating significant advantages.
The table below summarizes a quantitative performance comparison of various denoising methods on a synthetic fNIRS dataset, with lower values indicating better performance:
| Denoising Method | Mean Squared Error (MSE) | Required Expert Parameter Tuning |
|---|---|---|
| DAE (Proposed Method) | Lowest | No (Fully automatic) [72] |
| Wavelet Filtering | Moderate | Yes (Probability threshold alpha) [72] |
| Spline Interpolation | Moderate | Yes (Noise detection method & interpolation degree) [72] |
| Principal Component Analysis (PCA) | Variable | Yes (Number/Variance of components to remove) [72] |
| Kalman Filtering | Higher | Yes (State prediction model parameters) [72] |
Beyond lower MSE, the DAE model has been shown to:
- Lower residual motion artifacts more effectively than conventional methods [72].
- Increase computational efficiency, which is a crucial factor for processing large datasets or for potential real-time applications [72].
- Perform robustly on experimental task data (e.g., finger-tapping) that the model was not trained on, demonstrating good generalization [72].
Experimental Protocol for DAE Implementation
Implementing a DAE for fNIRS denoising involves a structured pipeline from data preparation to model training and validation.
Data Simulation and Preparation
To facilitate the training of the deep learning model, which requires large amounts of data, a synthetic fNIRS dataset is often generated. The simulated noisy signal is constructed as a composite of several components [72]:
Noisy fNIRS(t) = Clean Hemodynamic Response(t) + Motion Artifacts(t) + Resting-state fNIRS(t)
- Clean Hemodynamic Response: Simulated using a gamma function to model the typical brain activation response.
- Motion Artifacts: Simulated as "spike" noise (modeled with a Laplace distribution) and "shift" noise (simulated as a change in DC level), with parameters derived from experimental data.
- Resting-state fNIRS: Simulated using an AutoRegressive (AR) model fitted to real resting-state data to capture physiological noise like cardiac and respiratory cycles.
Model Training and Validation
- Training: The DAE is trained using backpropagation. The input is the simulated
Noisy fNIRS(t), and the target output is the simulatedClean Hemodynamic Response(t). The model learns to minimize the custom loss function. - Validation: The trained model's performance is first quantitatively assessed on held-out synthetic data. Crucially, it must then be validated on independent, real experimental fNIRS datasets (e.g., a finger-tapping task) to confirm its practical utility and generalization ability [72].
The Scientist's Toolkit: Research Reagent Solutions
The following table details the essential "research reagents"—the key materials, software, and equipment—required to implement the DAE-based fNIRS denoising methodology.
| Item / Solution | Function / Application |
|---|---|
| Continuous-wave fNIRS System | Core hardware for data acquisition. Measures light intensity at specified wavelengths to calculate changes in oxy- and deoxy-hemoglobin concentrations [73]. |
| Standardized Optode Cap | Holds light sources and detectors in place according to international systems (e.g., 10-20 system). Ensures consistent spatial targeting and repeatability across sessions [10] [74]. |
| High-Performance Computing Workstation | Equipped with a powerful GPU (e.g., NVIDIA series). Essential for training deep learning models like DAEs in a reasonable timeframe. |
| Python Deep Learning Frameworks | Software libraries such as TensorFlow or PyTorch. Used to define, train, and deploy the DAE model architecture. |
| Synthetic fNIRS Data Generator | Custom scripts (e.g., in Python/MATLAB) to create training data using Gamma functions, AR models, and noise models as described in the experimental protocol [72]. |
| Experimental Task Paradigm | Software to present stimuli and record triggers. For validation, a simple motor imagery or finger-tapping task is often used [73]. |
Troubleshooting Guides and FAQs
Q1: My DAE model does not converge during training, and the loss value remains high. What could be the issue?
- A: This is often related to problems with the training data or model configuration.
- Check Data Quality: Ensure your synthetic data accurately reflects the properties of your real experimental data. Verify the signal-to-noise ratio and the amplitude ranges of both the simulated hemodynamic response and the motion artifacts.
- Adjust Learning Rate: A learning rate that is too high can prevent the model from converging. Try reducing the learning rate or using a learning rate scheduler.
- Model Capacity: Your model might be too simple (underfitting) for the complexity of the denoising task. Consider increasing the number of layers or filters in the convolutional layers [72].
Q2: After applying the trained DAE, my real fNIRS signal appears over-smoothed, and I suspect the neural response is being attenuated. How can I prevent this?
- A: Over-smoothing indicates the model is being too aggressive.
- Review Loss Function: The loss function used during training must balance noise removal with signal preservation. A loss function that heavily penalizes any deviation from the smooth gamma function might be suppressing valid, faster neural dynamics. Consider adjusting the weights in a composite loss function.
- Validate on Task Data: Use a known task-based paradigm (e.g., block-design finger tapping) where the expected hemodynamic response is well-understood. If the model fails to recover the expected activation pattern, it is a sign that the training process needs refinement [72].
Q3: The DAE works well on data from one experimental paradigm but performs poorly on another. How can I improve its generalization?
- A: This is a common challenge in machine learning.
- Diversify Training Data: Retrain the model using a more comprehensive synthetic dataset that incorporates a wider variety of hemodynamic response shapes, noise types, and amplitudes. Include data that simulates different tasks and subject populations.
- Fine-Tuning: If data from the new paradigm is available, you can "fine-tune" the pre-trained DAE by continuing the training process with a small number of examples (either synthetic or carefully labeled real data) from the new paradigm. This adapts the model to the new context without requiring training from scratch.
Q4: Are there alternatives to DAEs for deep learning-based fNIRS denoising?
- A: Yes, the field is rapidly evolving. Another promising architecture is the Transformer model, which uses a self-attention mechanism to weigh the importance of different time points in the signal. Recent research has shown transformers can be highly effective for tasks like predicting short-separation channels from long-channel data, which is another denoising strategy [75]. The choice between DAE, Transformer, or other models depends on the specific denoising objective and data availability.
This guide provides technical support for researchers employing traditional signal processing methods to enhance data quality in neuroimaging studies. A primary challenge in brain imaging is managing motion artifacts—unwanted signals caused by subject movement which severely reduce the signal-to-noise ratio and can lead to both false positives and false negatives in data interpretation [76]. While all modalities are affected, their motion tolerance varies significantly. Functional Near-Infrared Spectroscopy (fNIRS) is generally more robust to movement than Electroencephalography (EEG) and is far more portable than functional Magnetic Resonance Imaging (fMRI), making it suitable for naturalistic, real-world experiments [77] [2]. The techniques detailed here—Spline Interpolation, Wavelet Filtering, and Principal Component Analysis (PCA)—are cornerstone methods for mitigating these artifacts in fNIRS data, and their principles are often adapted for EEG and fMRI processing.
Frequently Asked Questions (FAQs)
Q1: Which motion correction method should I choose for my fNIRS study? The choice depends on your signal type, noise profile, and computational needs. Wavelet filtering and Spline interpolation are often recommended, especially in combination, for their effective recovery of the hemodynamic response [78]. For data with severe motion artifacts, a combined Spline + Wavelet approach has been shown to outperform individual methods, saving nearly all corrupted trials, which is crucial in studies with vulnerable populations like infants [78]. Temporal Derivative Distribution Repair (TDDR) and Wavelet filtering have also been identified as particularly effective for subsequent functional connectivity analysis [76].
Q2: How does the motion tolerance of fNIRS compare to EEG? fNIRS has a significant advantage over EEG in motion tolerance. EEG measures electrical potentials on the scalp and is highly susceptible to movement artifacts from muscle activity or electrode displacement [77]. In contrast, fNIRS, which measures hemodynamic changes with near-infrared light, is more resilient to these disturbances. This makes fNIRS the preferred modality for studies involving children, motor activities, or any real-world setting where movement is inevitable [77] [4].
Q3: What are the main limitations of PCA-based correction? PCA-based correction has two primary limitations. First, its performance is highly dependent on correctly identifying and removing the principal components that represent motion artifacts, a parameter that often requires subjective tuning [79]. Second, as a spatial filtering technique, its efficacy is limited by the total number of measurement channels and the specific geometry of the probes on the scalp [79] [4].
Q4: Why might my results differ from other studies even when using the same correction algorithm? Reproducibility in fNIRS can be influenced by multiple factors beyond the choice of algorithm. A large-scale initiative found that variability often stems from how different research groups handle poor-quality data, model hemodynamic responses, and conduct statistical analyses [8]. Teams with higher self-reported confidence and more fNIRS experience showed greater agreement, highlighting the importance of detailed methodological reporting [8].
Troubleshooting Guides
Artifact Correction Performance Issues
| Problem Description | Possible Causes | Recommended Solutions |
|---|---|---|
| Residual artifacts after correction. | Incorrect parameter tuning (e.g., threshold for Wavelet, interpolation nodes for Spline). | Re-calibrate parameters on a short, representative data segment; consider combining Spline and Wavelet methods [78]. |
| Signal distortion and loss of physiological data. | Over-correction, particularly with PCA removing too many components. | Reduce the number of components removed in PCA; validate against a known baseline or task paradigm [79]. |
| Poor recovery of the Hemodynamic Response Function (HRF). | Algorithm not suited for the specific noise profile (e.g., spikes vs. baseline shifts). | For complex artifact profiles, use a combined approach (Spline+Wavelet) for optimal HRF recovery [78]. |
| Low classification accuracy in Brain-Computer Interface (BCI) applications. | Motion artifacts overwhelming the neural features of interest. | Apply robust motion correction (e.g., TDDR, Wavelet) as a preprocessing step to improve functional connectivity and subsequent decoding [76]. |
Method Selection Guide
The following table summarizes the core principles, advantages, and limitations of each method to guide your selection.
| Method | Core Principle | Key Advantages | Known Limitations & Parameters |
|---|---|---|---|
| Spline Interpolation [76] [4] | Identifies artifact segments and replaces them with fitted spline curves. | Simple, intuitive concept; widely implemented in toolboxes like Homer2. | Performance heavily depends on accurate artifact detection. The interpolation degree requires tuning [79]. |
| Wavelet Filtering [76] [4] | Decomposes signal into frequency components and thresholds coefficients dominated by artifacts. | Effective for various artifact types (spikes, shifts) without needing auxiliary hardware. | The probability threshold (alpha) needs tuning. May require significant computational resources [79]. |
| PCA-Based Correction [76] [79] | Removes principal components that account for the highest variance, assumed to be motion artifacts. | A spatial filter that can remove widespread, correlated artifacts across channels. | Subjective choice of how many components to remove. Limited by channel count and probe geometry [4]. |
Experimental Protocols & Workflows
Standardized Preprocessing Protocol for fNIRS
This protocol outlines a common workflow for applying motion correction, integrating the three featured methods.
Comparative Validation Protocol
To validate the efficacy of a motion correction method, a semi-simulation approach is recommended [78]. This involves adding realistic motion artifacts to a clean fNIRS recording or a known synthetic hemodynamic response.
The Scientist's Toolkit: Essential Research Reagents & Materials
| Item Name | Function / Purpose | Specification Notes |
|---|---|---|
| fNIRS System | Measures cortical hemodynamics via near-infrared light. | Choose continuous-wave systems for cost-effectiveness; ensure sufficient channel count for spatial coverage [77] [10]. |
| EEG System | Measures electrical brain activity from the scalp. | High temporal resolution (milliseconds) is key for studying rapid cognitive processes; often integrated with fNIRS [77] [80]. |
| Motion Artifact Correction Software | Implements algorithms like Spline, Wavelet, and PCA. | Toolboxes like Homer2 (MATLAB) are standard; ensure chosen software supports the specific methods you plan to use [76] [78]. |
| Integrated EEG-fNIRS Cap | Allows simultaneous multimodal brain data acquisition. | Ensure compatibility between systems to avoid hardware interference; often uses the international 10-20 system for placement [77] [10]. |
| Accelerometer / Inertial Measurement Unit (IMU) | Provides reference signal for motion artifact removal. | Can be used for adaptive filtering (e.g., ABAMAR) to improve motion artifact removal [4]. |
| Synchronization Trigger Box | Temporally aligns data from multiple devices (e.g., EEG, fNIRS). | Critical for multimodal studies to ensure data streams can be accurately correlated [77] [10]. |
FAQs: Motion Tolerance in Neuroimaging
How do the motion tolerance profiles of fNIRS, EEG, and fMRI fundamentally differ?
The three neuroimaging modalities have distinct motion tolerance profiles, largely determined by their underlying measurement principles. The following table summarizes their key characteristics:
| Modality | Primary Signal Measured | Relative Motion Tolerance | Primary Motion Artifact Sources |
|---|---|---|---|
| fNIRS | Hemodynamic response (blood oxygenation) [81] [82] | High [81] [82] | Optode displacement, pressure changes, hair movement, scalp blood flow variations [4] |
| EEG | Electrical activity from cortical neurons [81] | Moderate (susceptible to movement artifacts) [81] [40] | Electrode-skin impedance changes, cable sway, muscle activity (EMG), sweat [42] [40] [7] |
| fMRI | Blood Oxygenation Level Dependent (BOLD) signal [23] | Low [23] [82] | Head movement (causing spin-history effects, magnetic field distortions, image misregistration) [23] [83] |
fNIRS is the most motion-tolerant because it measures optical properties and is less susceptible to the electromagnetic artifacts that plague EEG and the profound spatial encoding disruptions that affect fMRI [81] [82]. EEG's susceptibility stems from its measurement of minute electrical potentials, which are easily confounded by motion-induced changes in electrode contact and muscle activity [40]. fMRI is the most sensitive because even millimeter-scale movements can distort the magnetic field and cause image misalignment, leading to large signal changes [23] [83].
What experimental design strategies can minimize motion artifacts for each modality?
Proactive design is the first and most effective line of defense against motion artifacts.
General Strategies for All Modalities:
- Participant Preparation: Clearly explain the importance of remaining still. Use practice sessions to acclimate participants to the experimental setup and task.
- Task Design: For tasks involving responses, use silent periods (e.g., silent reading, covert verb generation) to minimize jaw and face movement [4]. Avoid paradigms requiring sudden, jerky movements.
Modality-Specific Protocols:
- fNIRS Protocols:
- Stable Optode Mounting: Use customized headcaps, flexible probes, and optode holders that ensure a snug fit. For high-motion studies, secure probes with medical-grade adhesives or collodion [4].
- Task Selection: Design tasks that involve sustained cognitive states (e.g., workload, emotional processing) rather than transient, rapid responses, leveraging fNIRS's strength in monitoring hemodynamic trends [81].
EEG Protocols:
- Electrode and Hardware Choice: Use active electrodes, which are less sensitive to impedance changes. Employ lightweight, wireless systems with short, secured cables to reduce cable sway [40] [7].
- Controlled Environment: Conduct studies in lab settings where movement can be minimized. For mobile EEG (mo-EEG), design tasks with controlled, predictable movements [81] [42].
fMRI Protocols:
What are the best practices for correcting motion artifacts after data collection?
When prevention is not enough, several post-processing techniques can be applied.
fNIRS Correction Methods:
- Algorithmic Solutions: The combination of Spline interpolation and Wavelet filtering is highly effective. Spline interpolation identifies and corrects motion artifacts, while Wavelet filtering removes high-frequency noise, together recovering a significant portion of corrupted trials [78].
- Hardware-Assisted Solutions: Using accelerometers integrated into the fNIRS headpiece allows for adaptive filtering, where the motion signal is used as a noise reference to clean the fNIRS data [4].
EEG Correction Methods:
- Advanced Signal Processing: Independent Component Analysis (ICA) is a widely used method to separate and remove artifact components from brain signals [42] [7].
- Machine Learning: Deep learning models, such as the Motion-Net (a U-Net based CNN), are emerging as powerful tools for subject-specific motion artifact removal, showing high artifact reduction percentages and improved signal-to-noise ratio [7].
fMRI Correction Methods:
- Realignment and Regression: Standard preprocessing includes rigid-body realignment (motion correction) and regressing out the estimated motion parameters from the signal [23] [83].
- Censoring (Scrubbing): For large, infrequent movements, censoring involves removing motion-corrupted volumes from the time series. Advanced methods like JumpCor model the signal baseline for each stable segment between large motions, significantly improving functional connectivity estimates [83].
When should I choose a hybrid or multimodal approach?
A multimodal approach is advantageous when your research question requires capturing both the rapid electrophysiological dynamics (via EEG) and the localized hemodynamic response (via fNIRS or fMRI) [81].
Key Considerations for Multimodal Integration:
- fNIRS-EEG: This is the most natural combination for motion-prone studies. fNIRS provides better spatial resolution for cortical areas and is motion-tolerant, while EEG provides millisecond-level temporal resolution. They can be synchronized using hardware triggers and co-registered using the international 10-20 system for sensor placement [81].
- fMRI-EEG: While powerful, this combination is challenging in motion-prone contexts due to fMRI's extreme sensitivity to movement. It is best suited for highly controlled lab environments where motion is minimized [81].
Troubleshooting Guides
Problem: Excessive noise in fNIRS data during a walking task.
Solution:
- Prevention: Ensure the fNIRS cap is tight and secure. Use a headband over the cap for additional stability. If available, use a wearable, high-density fNIRS system designed for mobility.
- Correction: In post-processing, apply a combined Spline and Wavelet filter [78]. If an accelerometer is available, use an accelerometer-based motion artifact removal (ABAMAR) algorithm to guide the correction [4].
Problem: Unusable fMRI data due to large, infrequent head movements in infant studies.
Solution:
- Prevention: Swaddle the infant and use a vacuum immobilization bag designed for pediatric populations. Schedule scans during natural, deep sleep [83].
- Correction: Do not discard the entire dataset. Instead, use a censoring-based approach like JumpCor [83]. This technique:
- Identifies volumes where frame-to-frame displacement exceeds a threshold (e.g., 1 mm).
- Generates separate regressors for each stable segment between these large motions.
- Includes these regressors as nuisances in the general linear model, effectively normalizing the signal baseline across segments and recovering valuable data.
Problem: Motion artifacts in mobile EEG (mo-EEG) during gait experiments.
Solution:
- Prevention: Use a wireless, in-ear EEG system to minimize cable artifacts and improve stability [40]. Employ active electrodes to reduce sensitivity to impedance fluctuations.
- Correction: For a subject-specific and highly accurate solution, train a deep learning model like Motion-Net on clean and motion-corrupted data from the same individual [7]. For a more general approach, use ICA or channel rejection to remove persistently noisy components or channels [42].
Experimental Protocol Selection Workflow
The following diagram outlines a decision pathway for selecting the most appropriate motion-resistant experimental protocol.
Motion Mitigation Techniques Workflow
This workflow details the step-by-step process for addressing motion artifacts, from experimental design to data analysis.
The Scientist's Toolkit: Essential Research Reagent Solutions
The following table lists key hardware, software, and methodological "reagents" essential for implementing motion-resistant neuroimaging protocols.
| Tool Name / Category | Function / Purpose | Applicable Modality |
|---|---|---|
| Accelerometer / Inertial Measurement Unit (IMU) | Provides a reference signal of head movement used for hardware-based motion artifact removal (e.g., adaptive filtering) [4]. | fNIRS, EEG |
| Spline + Wavelet Filtering | A powerful algorithmic combination for correcting motion artifacts in hemodynamic signals; Spline interpolates corrupted segments, Wavelet removes high-frequency noise [78]. | fNIRS |
| Independent Component Analysis (ICA) | A blind source separation algorithm used to isolate and remove motion artifact components from neural signals [42] [7]. | EEG, fMRI |
| Motion-Net (Deep Learning Model) | A subject-specific, 1D CNN model designed to remove motion artifacts from EEG signals, particularly effective with smaller datasets [7]. | EEG |
| JumpCor | A censoring-based technique for fMRI that models signal baselines between large head "jumps," preserving data that would otherwise be discarded [83]. | fMRI |
| Vacuum Immobilization Bag | A physical restraint system that uses suction to conform to the subject's head and body, drastically reducing movement [83]. | fMRI (especially pediatric) |
| Active Electrodes | EEG electrodes with built-in amplification that reduce sensitivity to cable motion and changes in skin-electrode impedance [40]. | EEG |
| Collodion | A flammable liquid adhesive used to securely fix EEG electrodes or fNIRS optodes to the scalp for long-term, stable recordings [4]. | fNIRS, EEG |
Frequently Asked Questions (FAQs)
Q1: What are the most critical metrics for evaluating motion artifact removal in fNIRS, EEG, and fMRI? The most critical metrics assess both noise suppression and signal integrity. For quantitative evaluation, Signal-to-Noise Ratio improvement (ΔSNR) and Percentage Reduction in Motion Artifacts (η) are fundamental for fNIRS and EEG [84] [85]. For fMRI, the Framewise Displacement (FD) to DVARS relationship is a key marker of motion artifacts in resting-state data [86]. It is also essential to use metrics that evaluate signal distortion, such as Mean Squared Error (MSE) and Pearson's Correlation Coefficient (R²), to ensure the cleaning process preserves the underlying physiological signal [13] [85].
Q2: Why is it better to correct motion artifacts rather than simply reject contaminated trials? Trial rejection is only feasible when the number of artifacts is low and the total number of trials is high [13]. In many real-world scenarios, especially with challenging populations (e.g., infants, patients, children) or mobile experiments, the number of trials is strictly limited, and motion artifacts are common [13] [4]. Research on fNIRS has demonstrated that it is "always better to correct for motion artifacts than reject trials" to avoid losing valuable data and ending up with a noisy, unreliable signal [13].
Q3: How does motion tolerance differ between fNIRS and EEG? fNIRS and EEG exhibit different motion tolerance profiles due to their fundamental measurement principles. fNIRS is generally more tolerant of movement because it uses optical sensors and is less susceptible to the electrical artifacts caused by movement [87] [4]. In contrast, EEG is highly susceptible to motion artifacts from muscle activity, cable swings, and changes in electrode-scalp contact, making it more suitable for controlled lab environments [87] [42].
Q4: What are common types of motion artifacts in these modalities?
- fNIRS: Artifacts often manifest as high-frequency spikes, baseline shifts, and low-frequency variations caused by head movements, jaw movements (e.g., talking), or body movements that disrupt optode-scalp contact [13] [4].
- EEG: Artifacts include high-frequency spikes from muscle twitches, baseline shifts from head movements, and gait-related amplitude bursts from electrode displacement during walking [7].
- fMRI: Motion causes spin history artifacts and disruptions in the BOLD signal, leading to intensity changes and signal dropouts that result in distance-dependent biases in functional connectivity [23] [86].
Troubleshooting Guides
Guide 1: Selecting a Motion Artifact Correction Method
Problem: My neuroimaging data (fNIRS/EEG/fMRI) is contaminated with motion artifacts. Which correction method should I use?
Solution: Follow this decision workflow to select an appropriate correction strategy.
Next Steps:
- For fNIRS: If using wavelet filtering, studies indicate Wavelet Packet Decomposition combined with Canonical Correlation Analysis (WPD-CCA) is highly effective, showing a 93% success rate in correcting certain artifacts and improving SNR by over 16 dB [13] [84].
- For EEG: For single-channel data, WPD-CCA is also a robust choice, with reports of nearly 60% artifact reduction and over 30 dB SNR improvement [84]. For multi-channel data, consider deep learning approaches like Motion-Net, which has achieved an 86% artifact reduction [7].
- For fMRI: When censoring high-motion volumes, structured low-rank matrix completion can recover the missing entries and reduce connectivity errors more effectively than leaving gaps or using simple interpolation [23].
Guide 2: Diagnosing Poor Signal Quality After Artifact Removal
Problem: After applying a motion correction algorithm, my signal quality is still poor, or the physiological data appears distorted.
Solution: Perform the following diagnostic checks.
- Verify Metric Consistency: Check if the ΔSNR and η values have improved. If they have not, the correction method may be unsuitable for your artifact type. For example, some algorithms struggle with low-frequency artifacts that mimic the hemodynamic response in fNIRS [13] [4].
- Check for Signal Distortion: Calculate the Pearson's Correlation (R²) between the cleaned signal and a ground-truth baseline or a clean segment of data. A low R² indicates that the neural signal may have been distorted or removed during the cleaning process [13] [85].
- Inspect the Method's Limitations:
- Algorithmic Solutions: Methods like PCA or ICA may require careful selection of components to avoid removing neural signals [86]. Deep learning models like Motion-Net are subject-specific and require retraining for new individuals or experimental setups [7].
- Hardware Solutions: Ensure that auxiliary sensors (e.g., accelerometers) are properly synchronized with your neuroimaging data, as timing errors can lead to inadequate artifact correction [4].
- Consider a Hybrid Approach: If a single method fails, a cascaded or hybrid approach can be more effective. For instance, combining WPD with CCA has been shown to improve performance over either method used alone [84].
Quantitative Assessment Metrics
The following tables summarize key metrics for evaluating the effectiveness of motion artifact removal.
Table 1: Core Performance Metrics for fNIRS and EEG
| Metric | Formula / Description | Interpretation | Typical Values (Reported) |
|---|---|---|---|
| ΔSNR (dB) | ( \Delta SNR = SNR{output} - SNR{input} ) | Higher positive values indicate better noise suppression. | EEG (WPD-CCA): ~30.76 dB [84]fNIRS (WPD-CCA): ~16.55 dB [84] |
| η - Artifact Reduction (%) | ( \eta = \frac{Power{Artifact,Input} - Power{Artifact,Output}}{Power_{Artifact,Input}} \times 100\% ) | Higher percentage indicates greater volume of artifacts removed. | EEG (WPD-CCA): ~59.51% [84]fNIRS (WPD-CCA): ~41.40% [84]EEG (Motion-Net): 86% ±4.13 [7] |
| Mean Squared Error (MSE) | ( MSE = \frac{1}{N}\sum{i=1}^{N}(Y{true,i} - Y_{cleaned,i})^2 ) | Lower values indicate less distortion and closer fit to the true signal. | Used in fMRI and fNIRS studies to compare recovered vs. simulated HRF [13] [23]. |
| Pearson's Correlation (R²) | Measures linear correlation between cleaned signal and ground truth. | Values closer to 1.0 indicate the cleaned signal preserves the original signal's morphology. | Used to validate hemodynamic response recovery in fNIRS [13]. |
Table 2: fMRI-Specific Motion Metrics and Correction Performance
| Metric | Description | Application in Evaluation |
|---|---|---|
| Framewise Displacement (FD) | Summarizes volume-to-volume head movement. | Used to identify motion-corrupted volumes for censoring ("scrubbing") [86]. |
| DVARS | Measures the root mean square of the temporal derivative of the data. | A high correlation between FD and DVARS indicates persistent motion artifacts [86]. |
| Connectivity Specificity | Assesses if motion correction reduces short-range and increases long-range connectivity. | A successful correction should reverse the motion-induced bias of inflated short-range connections [86]. |
| aCompCor Efficacy | Number of principal components from noise ROIs needed to reduce FD-DVARS relationship. | Using more components (e.g., 10 vs. 2) more effectively mitigates motion artifacts [86]. |
Standard Experimental Protocols for Validation
To ensure rigorous validation of any motion artifact correction technique, follow these established experimental protocols.
Protocol 1: Validating with a Real Cognitive Task (fNIRS)
This protocol uses a task that inherently produces motion artifacts correlated with the stimulus, making correction challenging [13].
- Task: Color-Word Stroop Task. Participants verbally state the color of a displayed word, causing jaw and head movements.
- Artifact Type: Low-frequency, low-amplitude motion artifacts temporally correlated with the hemodynamic response.
- Validation Method: Compare multiple correction techniques (e.g., wavelet filtering, Kalman filtering, spline interpolation, PCA) using physiological plausibility of the recovered hemodynamic response as the primary outcome measure [13].
- Key Outcome: Studies using this protocol found that wavelet filtering was the most effective technique, correcting artifacts in 93% of cases [13].
Protocol 2: Benchmarking with a Public Dataset (EEG/fNIRS)
This approach uses a standardized public dataset to ensure comparable results.
- Dataset: A benchmark dataset containing simultaneous recordings of EEG, fNIRS, and accelerometer data during motion tasks [84] [7].
- Procedure:
- Synchronize the neuroimaging signals with the accelerometer data using trigger points [7].
- Identify segments of data contaminated with motion artifacts.
- Apply the chosen correction algorithm (e.g., WPD-CCA, Motion-Net).
- Calculate performance metrics (ΔSNR, η) by comparing the cleaned signal to ground-truth "clean" segments or using the accelerometer as a noise reference [84] [7].
Protocol 3: Testing on Resting-State fMRI Data
This protocol assesses the ability of a correction method to remove motion-induced biases in functional connectivity.
- Data Acquisition: Collect resting-state fMRI data from participants with varying motion levels (e.g., low-motion vs. high-motion subgroups) [86].
- Processing Pipeline:
- Calculate FD and DVARS for all volumes.
- Apply the motion correction strategy (e.g., aCompCor, scrubbing, structured matrix completion).
- Evaluation: Quantify the reduction in the correlation between FD and DVARS. Assess the specificity of known functional networks (e.g., default mode network) post-correction. A successful method will enhance long-range connectivity estimates [23] [86].
Motion Artifact Processing Workflow
The following diagram illustrates a generalized signal processing workflow for motion artifact correction that can be adapted for fNIRS, EEG, and fMRI.
The Scientist's Toolkit: Essential Research Reagents & Materials
This table lists key hardware and software "reagents" essential for effective motion artifact management.
Table 3: Key Solutions for Motion Artifact Research
| Item Name | Type | Function & Application |
|---|---|---|
| Inertial Measurement Unit (IMU) | Hardware | An accelerometer, gyroscope, and magnetometer package used to quantitatively measure head motion. Provides a reference signal for adaptive filtering algorithms (e.g., ABAMAR in fNIRS) [4]. |
| Wavelet Packet Decomposition (WPD) | Algorithm | A signal processing technique that decomposes a signal into multiple frequency sub-bands. Used as a powerful, flexible foundation for identifying and isolating motion artifacts in single-channel EEG and fNIRS signals [84]. |
| Canonical Correlation Analysis (CCA) | Algorithm | A statistical method that finds relationships between two sets of data. When combined with WPD, it helps separate motion artifacts from brain signals in a two-stage denoising process (WPD-CCA) [84]. |
| aCompCor (Anatomical Component Correction) | Algorithm | An fMRI-specific nuisance regression method that uses principal components from noise regions of interest (white matter, CSF) instead of mean signals. More effective than mean-based methods at mitigating motion artifacts [86]. |
| Motion-Net | Algorithm | A subject-specific, CNN-based deep learning model designed to remove motion artifacts from EEG signals. Effective for mobile EEG setups but requires training on individual subject data [7]. |
| Structured Low-Rank Matrix Completion | Algorithm | An advanced fMRI processing technique used to recover missing data from censored ("scrubbed") volumes. Reduces discontinuities in the time series and improves functional connectivity estimates [23]. |
Multimodal Validation: Integrating fNIRS, EEG, and fMRI for Comprehensive Brain Assessment
This section compares the core technical specifications of fNIRS, EEG, and fMRI, with a specific focus on their motion tolerance, a critical factor for experimental design in real-world settings and specific populations.
Table 1: Motion Tolerance and Technical Comparison of Neuroimaging Modalities
| Feature | EEG (Electroencephalography) | fNIRS (Functional Near-Infrared Spectroscopy) | fMRI (Functional Magnetic Resonance Imaging) |
|---|---|---|---|
| What It Measures | Electrical activity from neurons [88] [89] | Hemodynamic response (blood oxygenation) [88] [89] | Blood Oxygen Level Dependent (BOLD) signal [90] |
| Temporal Resolution | High (milliseconds) [88] [89] | Low (seconds) [88] [89] | Low (seconds) [90] |
| Spatial Resolution | Low (centimeter-level) [88] [89] | Moderate (better than EEG) [88] [89] | High [90] |
| Motion Tolerance | Low - highly susceptible to movement artifacts [88] | Moderate - more tolerant to subject movement [88] [91] | Very Low - requires complete stillness [90] |
| Portability | High - lightweight and wireless systems available [88] [92] | High - often used in mobile formats [88] [92] | Very Low - requires a fixed scanner [90] |
| Best Use Cases for Motion-Prone Scenarios | Controlled lab environments with minimal movement [88] | Naturalistic studies, children, clinical populations, rehabilitation [88] [92] | Not suitable for any significant movement |
Experimental Protocols & Methodologies
This section provides a detailed methodology for a standard simultaneous EEG-fNIRS experiment, focusing on a motor imagery paradigm, which is a common application in hybrid Brain-Computer Interface (BCI) research [93] [94].
Detailed Motor Imagery Experiment Protocol
Objective: To classify left-hand vs. right-hand motor imagery tasks using a fused EEG-fNIRS approach, leveraging the complementary strengths of both modalities to achieve higher accuracy than unimodal systems [93] [94].
1. Participant Preparation and Setup:
- Cap Integration: Use an integrated EEG-fNIRS cap. Ensure the cap has a dark fabric to minimize unwanted optical reflection for fNIRS [89]. The montage should place sensors over the brain region of interest (e.g., the sensorimotor cortex for motor imagery).
- EEG Setup: Apply EEG electrodes according to the international 10-20 system. For motor imagery, focus on electrodes around the sensorimotor cortex (e.g., C3, C4, Cz). Reduce electrode impedances to acceptable levels (typically below 10 kΩ) [89].
- fNIRS Setup: Place fNIRS optodes (sources and detectors) on the same cap, interleaved or adjacent to EEG electrodes, targeting the sensorimotor cortex. Ensure good scalp coupling for all optodes [89] [19].
2. Data Acquisition and Synchronization:
- Hardware: Use a synchronized EEG-fNIRS system. This can be a unified processor or two separate systems synchronized via a shared trigger system (e.g., TTL pulses) or software protocols like the Lab Streaming Layer (LSL) [89] [19].
- Parameters:
- Paradigm: Implement a trial-based or block design. A sample trial for motor imagery [93]:
- Cue (0-2 s): A visual cue (e.g., an arrow) indicates the task (left or right hand).
- Task (2-12 s): The participant performs kinesthetic motor imagery of the cued hand (e.g., imagining opening and closing the hand).
- Rest (12-22 s): A rest period with a fixation cross.
- Record 20-30 trials per task [93].
3. Data Preprocessing (Dual Pipelines):
- EEG Preprocessing [93]:
- Downsample to 128 Hz.
- Re-reference to a common average reference.
- Apply a band-pass filter (e.g., 8-25 Hz to isolate mu and beta rhythms for motor imagery).
- Remove channels with excessive noise and interpolate if necessary.
- fNIRS Preprocessing [93] [91]:
- Convert raw light intensity to optical density.
- Apply motion artifact correction. Techniques like Moving Average (MA), wavelet-based correction, or spline interpolation are highly recommended, especially for data from children or other motion-prone populations [91].
- Band-pass filter (e.g., 0.01-0.2 Hz) to remove physiological noise (e.g., cardiac, respiratory) and slow drifts.
- Convert optical density to concentration changes of HbO and HbR using the modified Beer-Lambert law.
4. Data Fusion and Analysis:
- Fusion Level: Research indicates that early-stage fusion (combining raw or preprocessed data) of EEG and fNIRS can yield significantly higher classification performance compared to middle or late-stage fusion in a Y-shaped neural network architecture [93] [94].
- Feature Extraction:
- Classification: Use machine learning classifiers (e.g., sLDA, SVM) or deep learning models on the fused feature set to discriminate between left and right motor imagery tasks [93].
The Scientist's Toolkit: Research Reagent Solutions
Table 2: Essential Materials and Hardware for EEG-fNIRS Experiments
| Item | Function & Explanation | Example/Specifications |
|---|---|---|
| Integrated EEG-fNIRS Cap | A single cap designed to hold both EEG electrodes and fNIRS optodes. It ensures consistent and co-registered sensor placement, which is crucial for accurate data fusion [89] [19]. | actiCAP with 128+ slits (Easycap) or custom 3D-printed/cryogenic thermoplastic helmets for better fit [89] [19]. |
| EEG Amplifier System | Measures and digitizes microvolt-level electrical potentials from the scalp. A key choice is between wet, semi-dry, or dry electrodes, balancing signal quality and setup time [92]. | BrainAmp (Brain Products), Versatile EEG (Bitbrain); Wireless systems enhance mobility [93] [92]. |
| fNIRS Imaging System | Emits near-infrared light into the scalp and detects the attenuated light that emerges. Continuous-Wave (CW) systems are popular for their portability and cost-effectiveness [92]. | NIRScout (NIRx), Cortivision Photon Cap; Systems with more sources/detectors allow for higher-density coverage [93] [92]. |
| Electrolyte Gel (for wet EEG) | Facilitates electrical conduction between the scalp and the electrode. Crucial for obtaining low-impedance connections and high-quality EEG signals [89]. | Various conductive pastes and gels (e.g., from Easycap). Not needed for dry or semi-dry EEG systems. |
| Synchronization Hardware/Software | Ensures temporal alignment of EEG and fNIRS data streams with millisecond precision. This is a non-negotiable requirement for meaningful multimodal analysis [89] [19]. | Lab Streaming Layer (LSL), TTL trigger cables, or a unified acquisition system from a single vendor [89] [19]. |
| Motion Artifact Correction Software | Algorithmic tools to identify and clean motion-induced noise in the signals. This is especially critical for fNIRS data and for studies with children or patient populations [91]. | Moving Average (MA), Wavelet methods, spline interpolation; Often implemented in Homer2, NIRS-KIT, or custom MATLAB/Python scripts [91]. |
Troubleshooting Guides & FAQs
This section addresses common practical challenges encountered during simultaneous EEG-fNIRS experiments.
FAQ: Frequently Asked Questions
Q1: Which is more tolerant to movement, EEG or fNIRS? A1: fNIRS is generally more tolerant to movement artifacts than EEG [88]. While both can be affected, EEG signals are more susceptible to electromagnetic noise from muscle activity and cable movement. fNIRS signals are based on optical measurements, making them relatively more robust to such motion, though they are still susceptible to motion that disrupts optode-scalp coupling [88] [91].
Q2: Can I use a standard EEG cap for a combined EEG-fNIRS study? A2: It is possible but not ideal. Standard elastic EEG caps may not securely hold fNIRS optodes, leading to variations in pressure and light source-detector distances, which harm data quality. For best results, use a cap specifically designed for multimodal integration, with reinforced slits and dark, non-stretchy fabric [89] [19].
Q3: What is the key advantage of fusing EEG with fNIRS? A3: The primary advantage is the combination of EEG's high temporal resolution (milliseconds) with fNIRS's good spatial resolution (centimeter-level), providing a more comprehensive picture of brain activity by capturing both fast electrical neural events and the slower hemodynamic responses that are spatially more localized [88] [89] [92].
Q4: How do I know if my fused system is properly synchronized? A4: Perform a validation test before your main experiment. Send a clear, sharp trigger pulse (e.g., a button press) to both systems simultaneously and record a simple, synchronous event (e.g., a flash of light). During analysis, inspect the recorded markers in both data streams; they should be aligned within the expected temporal precision of your synchronization method (e.g., within a few milliseconds for LSL) [89].
Troubleshooting Guide
Problem: Poor fNIRS Signal Quality
- Check Optode-Scalp Coupling: Ensure all optodes have firm and consistent contact with the scalp. Loose optodes are a primary cause of signal loss [89] [19].
- Verify Source-Detector Distance: The distance between a light source and detector should typically be 2.5-3.5 cm to probe the cortical surface effectively. Distances that are too short will not reach the cortex, while distances that are too long will result in a very weak signal [19].
- Inspect for Hair Obstruction: Part the hair under each optode to ensure a clear path to the scalp [89].
- Apply Motion Correction: During preprocessing, apply robust motion artifact correction algorithms like Moving Average (MA) or wavelet-based methods [91].
Problem: Excessive EEG Noise in a Mobile Setting
- Check Electrode Impedances: Re-check and lower impedances for all electrodes. High impedance is a major source of noise.
- Secure Cables: Use bandages or wraps to secure EEG and fNIRS cables to the participant's body, minimizing movement-induced cable noise (microphonics).
- Use a Referential Montage: If using a bipolar montage, switch to a common average reference, which can help mitigate noise that is common to all electrodes.
Problem: Inconsistent or Failed Synchronization Between Systems
- Verify Trigger Line Connection: Physically check the cable connecting the trigger output of your stimulus PC to the input of both the EEG and fNIRS systems.
- Test with a Simple Paradigm: Run a short test where you send a known number of triggers and verify that the same number is recorded in both data files.
- Consider Software Synchronization: If using hardware triggers is not feasible, switch to a software-based synchronization protocol like the Lab Streaming Layer (LSL), which is designed for multimodal data streaming [89].
FAQs: Core Principles and Methodological Rationale
Q1: Why is fMRI considered the gold standard for validating fNIRS signals?
fMRI is regarded as a gold standard in validation studies due to its high spatial resolution, whole-brain coverage, and well-established ability to localize brain activity in both cortical and deep subcortical structures. Since both fNIRS and fMRI are based on measuring hemodynamic responses related to neural activity, comparing fNIRS findings against fMRI's Blood Oxygen Level Dependent (BOLD) signal provides a critical benchmark for establishing the validity and reliability of fNIRS measurements [2] [71]. This correlation confirms that fNIRS accurately captures task-related brain activity.
Q2: What is the fundamental physiological link between fNIRS and fMRI signals?
Both techniques measure metabolic changes consequent to neural activity but do so through different physical principles. fMRI detects the Blood Oxygen Level Dependent (BOLD) signal, which reflects changes in the magnetic properties of deoxygenated hemoglobin [56] [71]. fNIRS uses near-infrared light to directly measure concentration changes in both oxygenated (HbO) and deoxygenated (HbR) hemoglobin in the cortical tissue [2] [3]. They are both coupled to the same underlying neurovascular response, providing a basis for comparison.
Q3: In what scenarios is fNIRS superior to fMRI for brain imaging?
fNIRS offers distinct advantages in situations that are challenging for fMRI:
- Naturalistic & Moving Subjects: fNIRS is highly tolerant of movement artifacts, enabling studies involving walking, rehabilitation exercises, or other gross motor activities [2] [71].
- Special Populations: Its portability and quiet operation make it ideal for infants, children, and clinical populations who may find the fMRI environment intimidating or uncomfortable [2] [71].
- Ecological Validity: fNIRS allows for brain imaging in real-world settings, such as workplaces or social interactions, outside the constrained laboratory scanner environment [3] [56].
- Cost and Accessibility: fNIRS systems are more affordable and have lower ongoing operational costs than fMRI scanners [71].
Troubleshooting Guides: Common Experimental Challenges
Issue: Poor Correlation Between fNIRS and fMRI Signals
Potential Causes and Solutions:
- Cause 1: Improper fNIRS Probe Placement.
- Solution: Use a 3D digitizer to record the precise locations of fNIRS optodes on the subject's scalp. Co-register these positions with the individual's structural MRI or a standard brain atlas to ensure the fNIRS channels are correctly targeting the brain regions activated in the fMRI scan [71].
- Cause 2: Inadequate Control of Systemic Physiological Confounds.
- Solution: Implement short-separation channels in your fNIRS setup. These channels are primarily sensitive to systemic changes in scalp blood flow (e.g., from blood pressure, heart rate). Use their signal as a regressor to isolate the cerebral component of the fNIRS signal [3].
- Cause 3: Differences in Data Analysis Pipelines.
- Solution: Strive for methodological alignment in analysis. A major reproducibility initiative (FRESH) found that variability in how researchers handle poor-quality data, model responses, and conduct statistical tests is a primary source of discrepant results [8]. Adopt standardized processing steps where possible and report analysis parameters in detail.
Issue: Low Reproducibility of fNIRS Measurements Across Sessions
Potential Causes and Solutions:
- Cause 1: Inconsistent Optode Placement Between Sessions.
- Solution: Implement a strict protocol for cap placement using anatomical landmarks (e.g., nasion, inion, pre-auricular points). Studies show that increased shifts in optode position significantly reduce spatial overlap and measurement reproducibility across sessions [95].
- Cause 2: Reliance on Deoxygenated Hemoglobin (HbR) Signals.
- Solution: Focus analysis on oxygenated hemoglobin (HbO). Research has demonstrated that task-related changes in HbO are significantly more reproducible over multiple sessions than changes in HbR [95].
- Cause 3: Suboptimal Data Quality.
- Solution: Monitor signal quality in real-time and post-process to identify and correct for motion artifacts and poor signal-to-noise ratio. Reproducibility is higher in datasets with better inherent quality [8].
Experimental Protocols for Validation
Protocol 1: Synchronous fNIRS-fMRI Acquisition
This protocol involves simultaneously collecting fNIRS and fMRI data, allowing for a direct, temporal comparison of the hemodynamic responses.
- Objective: To validate fNIRS signals against the fMRI BOLD response in real-time and develop cross-validated hemodynamic models.
- Equipment:
- MRI-safe fNIRS system (specifically designed to operate without causing interference or safety hazards inside the MRI scanner).
- fMRI scanner.
- MRI-compatible fNIRS cap with fiber-optic cables.
- Procedure:
- Place the MRI-safe fNIRS cap on the participant, ensuring optodes are positioned over the regions of interest.
- Position the participant in the MRI scanner.
- Synchronize the clocks of the fNIRS and fMRI systems to ensure data streams are aligned in time.
- Run a block-design or event-related paradigm (e.g., a motor task like finger tapping).
- Collect BOLD fMRI and fNIRS (HbO/HbR) data simultaneously.
- Data Analysis:
- Extract the fMRI BOLD time course from the brain region underlying the fNIRS channels.
- Extract the fNIRS HbO and HbR time courses.
- Conduct a cross-correlation analysis between the fNIRS HbR signal (which is most directly related to the BOLD signal) and the fMRI time course. A strong negative correlation is expected because the BOLD signal increases with blood oxygenation, while HbR decreases [2].
Protocol 2: Asynchronous Validation of Functional Localization
This protocol is used when simultaneous scanning is not feasible. The same task is performed in both scanners at different times, and the spatial pattern of activation is compared.
- Objective: To assess whether fNIRS can accurately localize brain activity identified by fMRI.
- Equipment:
- Standard fNIRS system.
- fMRI scanner.
- 3D digitizer for fNIRS.
- Procedure:
- The participant first completes the experimental task (e.g., a cognitive n-back task) in the fMRI scanner.
- The resulting fMRI activation map is used to identify the primary focus of activation in the prefrontal cortex (e.g., DLPFC).
- In a separate session, the participant performs the same task while fNIRS data is collected.
- The fNIRS probe is placed over the DLPFC region, and its exact location is co-registered with the fMRI anatomy.
- Data Analysis:
Signaling Pathways and Workflows
fNIRS-fMRI Hemynamic Coupling Pathway
The following diagram illustrates the shared neurovascular pathway measured by both fNIRS and fMRI, highlighting the key physiological relationship that enables validation.
fNIRS-fMRI Validation Workflow
This workflow charts the step-by-step process for designing and executing a validation study, from hypothesis to final analysis.
The Scientist's Toolkit: Research Reagent Solutions
Table: Essential Materials and Equipment for fNIRS-fMRI Validation Studies
| Item | Function in Validation | Technical Notes |
|---|---|---|
| MRI-Safe fNIRS System | Enables simultaneous data collection inside the scanner. | Must use fiber-optic cables; all components must be non-magnetic and not interfere with the BOLD signal [2]. |
| 3D Digitizer | Records precise 3D locations of fNIRS optodes on the scalp. | Critical for accurate co-registration of fNIRS channels with fMRI activation maps in asynchronous studies [95] [71]. |
| Short-Separation Detectors | Measures systemic physiological noise from the scalp. | Placed ~8 mm from a source; their signal is regressed out to isolate the cerebral component of the fNIRS signal, improving correlation with fMRI [3]. |
| Anatomical MRI Scans | Provides individual brain anatomy for co-registration. | High-resolution T1-weighted scans are used to map fNIRS channel locations onto the cortical surface, improving spatial accuracy [95]. |
| Synchronization Hardware | Aligns fNIRS and fMRI data streams in time. | A crucial component for synchronous studies to ensure the hemodynamic responses from both modalities can be directly compared [2]. |
| Standardized fNIRS Cap | Holds optodes in a consistent configuration. | Using caps based on the international 10-10/10-20 system improves consistency and reproducibility across subjects and sessions [3] [95]. |
Troubleshooting Guides
Motion Artifact Management
Problem: Excessive motion artifacts degrading signal quality during mobile or naturalistic experiments.
Solution: Implement a multi-layered approach combining hardware selection, experimental design, and post-processing techniques.
For fNIRS Studies: fNIRS is relatively robust to motion artifacts. However, for rigorous motion control:
- Hardware: Ensure optodes maintain consistent scalp contact pressure. Custom 3D-printed or thermoplastic helmets can improve fit compared to standard elastic caps [19].
- Processing: Utilize algorithms based on structured low-rank matrix completion to recover motion-corrupted segments, a technique validated in fMRI that is transferable to fNIRS hemodynamic data [23].
For EEG Studies: EEG is highly susceptible to motion artifacts [97].
- Hardware: Use dry electrode headsets with ultra-high impedance amplifiers (>47 GOhms) that can handle contact impedances up to 1-2 MOhms, making them more suitable for movement than traditional wet electrodes [61].
- Setup: Ensure tight but comfortable cap fittings to minimize sensor displacement [97].
For fMRI Studies: Motion is a fundamental limitation. Even small movements create spurious variance and distance-dependent changes in BOLD signal correlations [98].
- Processing: "Censoring" (scrubbing) of high-motion volumes is common, but this creates data discontinuities. Advanced methods like motion-compensated recovery using a structured low-rank matrix prior can effectively interpolate and recover missing entries [23].
Problem: Movement tolerance is limiting experimental paradigm design.
Solution: Choose the appropriate technology for the desired ecological validity.
- High-Movement Paradigms (e.g., walking, rehabilitation): fNIRS is the preferred modality due to its inherent tolerance to movement, portability, and lower sensitivity to motion artifacts compared to EEG and fMRI [97] [2].
- Controlled Lab Settings: EEG can be used if motion is minimal. fMRI is the least suitable for any movement [97].
Hardware Integration and Synchronization
Problem: Difficulty achieving precise temporal synchronization between fNIRS and EEG data streams.
Solution: The synchronization strategy depends on the required precision and available hardware.
- For Microsecond Precision: Use a unified processor or acquisition system that simultaneously processes and acquires both EEG and fNIRS signals. This method offers the highest synchronization accuracy, though it requires a more complex system design [19].
- For Standard Research Applications: Shared hardware triggers (e.g., TTL pulses via parallel port) are a common and reliable method. The Lab Streaming Layer (LSL) protocol, an open-source system for unified collection of measurement time series, is also a highly flexible software-based solution [89].
Problem: Physical interference between EEG electrodes and fNIRS optodes on the scalp.
Solution: Careful cap montage design is critical.
- Cap Selection: Use an cap with a high density of slits (e.g., 128 or 160) made of black fabric to host both sensor holders and reduce unwanted optical reflection for fNIRS [89].
- Montage Planning: Define the fNIRS montage based on your region of interest first, then add EEG electrodes to the remaining 10-20 system locations. Some manufacturers offer integrated caps or software tools (e.g., DOT-HUB ArrayDesigner) to help plan compatible montages [89] [97].
- Custom Solutions: For complex montages or specific populations, consider 3D-printed or cryogenic thermoplastic sheet helmets for a customized, secure fit that maintains sensor placement [19].
Frequently Asked Questions (FAQs)
Q1: Which neuroimaging modality is most tolerant to subject movement, and why?
A1: fNIRS is the most tolerant to subject movement. This is because it measures hemodynamic activity using light, which is less susceptible to motion artifacts than the electrical potentials measured by EEG. Furthermore, unlike fMRI, it does not require a highly controlled magnetic environment, allowing for more naturalistic and ambulatory studies [97] [2].
Q2: Can I simultaneously record EEG and fNIRS without signal interference?
A2: Yes. The physical principles of EEG (electrical potentials) and fNIRS (near-infrared light) are distinct and do not inherently interfere with each other. The primary challenges are not interference, but rather the physical integration of sensors on the scalp and the precise temporal synchronization of the two data streams [89] [97].
Q3: What are the key technical trade-offs when choosing between EEG, fNIRS, and fMRI for a study involving patient populations?
A3: The trade-offs center on resolution, tolerance to movement, and practical constraints.
Table: Technical Trade-Offs for Patient Populations
| Feature | EEG | fNIRS | fMRI |
|---|---|---|---|
| Temporal Resolution | High (milliseconds) [97] | Low (seconds) [97] | Low (seconds) [2] |
| Spatial Resolution | Low (centimeter-level) [97] | Moderate (better than EEG) [97] | High (millimeter-level) [2] |
| Tolerance to Movement | Low - highly susceptible [97] | High - relatively robust [97] | Very Low - requires immobility [2] |
| Portability & Cost | High - lightweight, wireless systems available [97] [61] | High - portable, wearable formats [97] | Very Low - immobile, expensive equipment [2] |
| Best for Patient Use | Fast neural dynamics in controlled settings. | Naturalistic studies, bedside monitoring, children [97] [19]. | Precise spatial localization of deep brain structures where movement can be minimized [2]. |
Q4: What is the most effective method to correct for motion artifacts in fMRI data?
A4: While simple "censoring" (removing high-motion volumes) is common, it discards data. Advanced processing strategies are more effective. One robust method is motion-compensated recovery using a structured low-rank matrix prior. This approach models the excised, motion-corrupted data and recovers the missing entries based on the inherent structure of the BOLD time series, effectively interpolating the signal and reducing spurious motion-related effects in functional connectivity analysis [23] [98].
Experimental Protocols for Motion-Tolerant Neuroimaging
Protocol: Simultaneous EEG-fNIRS Recording for Naturalistic Tasks
Objective: To capture brain activity during a cognitive task with higher ecological validity, leveraging the complementary strengths of EEG and fNIRS [65].
Materials:
- Integrated EEG-fNIRS system (e.g., Brain Products EEG with a compatible fNIRS system [89]).
- Custom cap (e.g., black actiCAP with 128+ slits) [89].
- Synchronization interface (LSL or hardware triggers).
- Stimulus presentation software.
Procedure:
- Montage Design: Plan sensor placement based on the cortical regions of interest (e.g., prefrontal cortex for cognitive control). Place fNIRS optodes first, then fill in EEG electrodes using the 10-20 system, avoiding physical clashes [89].
- Cap Setup: Populate the cap with EEG snap holders and fNIRS optode holders according to the designed montage. Use a black cap to reduce optical reflection [89].
- Participant Preparation: Fit the cap on the participant. For EEG, prepare the scalp and apply gel to achieve low impedances (< 10 kΩ). For fNIRS, ensure good optode-scalp coupling and check signal quality in the acquisition software [89].
- Synchronization: Establish a synchronization link between the EEG and fNIRS systems using either the Lab Streaming Layer (LSL) protocol or shared hardware triggers [89].
- Experimental Run:
- Use a mixed block/event-related design.
- For fNIRS analysis, mark the start and end of task blocks (e.g., 30-second blocks of a cognitive task alternating with rest) [89].
- For EEG analysis, send event markers at the onset of each discrete trial or stimulus within the block (e.g., every time a problem is presented) [89].
- Data Acquisition: Record simultaneous and synchronized EEG and fNIRS data throughout the experiment.
Diagram: Simultaneous EEG-fNIRS Experimental Workflow
Protocol: fNIRS Hyperscanning for Social Interaction Studies
Objective: To measure inter-brain coupling (IBC) between two individuals during a cooperative task in a naturalistic setting, capitalizing on the motion tolerance of fNIRS [56].
Materials:
- Two portable, wireless fNIRS systems.
- Caps with optodes covering the prefrontal cortices.
- System for precise time-synchronization (e.g., network time protocol).
Procedure:
- Setup: Fit each participant with an fNIRS cap, ensuring optode placement over the same prefrontal regions for both individuals.
- Synchronization: Synchronize the clocks of the two fNIRS systems to millisecond accuracy to enable later analysis of inter-brain coupling.
- Task: Engage participants in a cooperative task (e.g, joint problem-solving, playing music together) [56].
- Data Collection: Simultaneously record hemodynamic activity from both brains throughout the social interaction.
- Analysis: Calculate the synchronization between the two participants' brain signals (e.g., Wavelet Transform Coherence) to quantify inter-brain coupling [99].
The Scientist's Toolkit: Essential Research Reagents & Materials
Table: Key Materials for fNIRS-EEG Motion-Tolerant Research
| Item | Function / Explanation |
|---|---|
| Integrated EEG-fNIRS Cap | A cap with a high density of slits and black fabric is essential for physically housing both EEG electrodes and fNIRS optodes in close proximity without signal interference [89]. |
| Dry Electrode EEG Systems | Dry electrodes with high-impedance amplifiers enable faster setup and are more suitable for studies where movement is expected, as they do not rely on conductive gel that can dry or smear [61]. |
| Lab Streaming Layer (LSL) | An open-source software platform for synchronizing multimodal data streams. It is crucial for achieving precise temporal alignment between EEG, fNIRS, and other experimental markers (e.g., stimulus presentation) [89]. |
| Custom 3D-Printed Helmets | For complex montages or challenging populations (e.g., infants), custom-fitted helmets provide superior sensor stability and consistent optode-scalp coupling, which is critical for data quality in motion-prone scenarios [19]. |
| Structured Low-Rank Matrix Completion Algorithms | Advanced computational tools used in post-processing to identify and recover motion-corrupted segments in hemodynamic time series (fNIRS/fMRI), mitigating the impact of motion without discarding large amounts of data [23]. |
| Wavelet Transform Coherence Analysis | A key analytical technique for quantifying inter-brain synchrony (IBC) in hyperscanning studies, allowing researchers to measure how two brains couple during social interactions [99]. |
Structured Sparse Multiset Canonical Correlation Analysis (ssmCCA)
FAQs: Core Concepts and Troubleshooting
FAQ 1: What is the primary advantage of using ssmCCA over traditional CCA for EEG-fNIRS data fusion?
ssmCCA addresses critical limitations of traditional multiset CCA (mCCA) that are particularly problematic for neuroimaging data. Specifically, it mitigates overfitting in studies with a limited number of participants (a common scenario) and high-dimensional features by incorporating a structured sparsity constraint. This constraint, a graph-guided fused LASSO penalty, performs feature selection and incorporates structural information amongst variables, such as the spatial relationships between brain regions. This leads to more interpretable and robust models that can localize neural responses more effectively than standard CCA [100] [101].
FAQ 2: During a simultaneous EEG-fNIRS experiment involving movement, we observe strong artifacts in the EEG data. Is the fNIRS data still usable, and can ssmCCA help?
Yes, this scenario highlights a key strength of multimodal research. fNIRS is significantly more tolerant of motion artifacts than EEG. While standard filtering may not be sufficient, advanced signal processing involving accelerometers can be used to clean the fNIRS signal. Furthermore, a core benefit of ssmCCA is its ability to fuse datasets despite different noise profiles. By finding linear transforms that maximize correlation between the modalities, ssmCCA can potentially extract the underlying shared neural signal, making it a robust tool even when one modality is noisier [102] [103].
FAQ 3: How does the motion tolerance of fNIRS compare to EEG and fMRI in practice?
The motion tolerance of these modalities exists on a spectrum. fNIRS offers a practical middle ground: it is far more robust to motion than fMRI, which requires near-total immobilization, and is generally more tolerant than EEG, which is highly susceptible to movement-induced electrical artifacts. This makes fNIRS, especially when combined with EEG, a preferred choice for ecologically valid paradigms involving action execution, observation, or studies in naturalistic settings [102] [101] [10].
FAQ 4: What is a common experimental design pitfall when combining EEG and fNIRS?
A frequent issue is using a design optimized for only one modality. EEG excels with event-related designs (e.g., many repeated trials), while fNIRS is often used with block designs due to the slower hemodynamic response. A successful simultaneous experiment must combine these approaches. The protocol should include both rapid trial events for EEG event-related potential (ERP) analysis and sustained blocks of conditions to allow the fNIRS hemodynamic response to be clearly observed [89].
Quantitative Data Comparison: fNIRS vs. EEG vs. fMRI
Table 1: Technical Specification and Motion Tolerance Comparison
| Feature | fNIRS | EEG | fMRI |
|---|---|---|---|
| What It Measures | Hemodynamic response (HbO, HbR) [102] | Electrical activity from cortical neurons [102] | Blood Oxygen Level Dependent (BOLD) signal [90] |
| Temporal Resolution | Low (seconds) [102] [104] | High (milliseconds) [102] [104] | Very Low (seconds) |
| Spatial Resolution | Moderate (cortical, <1-2 cm) [103] [105] | Low (centimeter-level) [102] | High (millimeter-level) [90] |
| Penetration Depth | Outer cortex (~1.5 - 3 cm) [105] [90] | Cortical surface [102] | Full brain |
| Motion Tolerance | High - relatively robust to movement [102] [103] | Moderate - susceptible to movement artifacts [102] | Very Low - requires immobilization [101] [10] |
| Portability | High - wearable systems available [102] [103] | High - lightweight/wireless systems [102] | None - fixed scanner environment |
| Best Use Case in Motor Research | Naturalistic studies, motor rehab, child development [102] | Fast cognitive tasks, ERPs, motor planning [102] | Precise localization in immobilized subjects |
Detailed Experimental Protocol for EEG-fNIRS Fusion using ssmCCA
The following protocol is adapted from studies on the action-observation network (AON) and motor imagery, which require good motion tolerance [100] [101] [10].
Objective: To identify shared neural correlates during action execution and observation using simultaneous EEG-fNIRS and the ssmCCA data fusion method.
Materials: Refer to "The Scientist's Toolkit" table below.
Procedure:
- Participant Preparation: Recruit participants (e.g., n=21 as in prior work [101]). Fit the integrated EEG-fNIRS cap according to the 10-20 system. For AON studies, focus on sensorimotor cortices and inferior parietal regions [100] [10].
- Signal Setup and Quality Check:
- Experimental Paradigm:
- Use a block design interspersed with event-related triggers.
- Blocks (for fNIRS): Present 20-30 second blocks of different conditions (e.g., Action Execution, Action Observation, Rest).
- Events (for EEG): Within the execution and observation blocks, mark the onset of each individual action with a trigger. This allows for analysis of EEG time-locked potentials and oscillations (e.g., mu-rhythm desynchronization) [101] [89].
- Data Acquisition & Synchronization:
- Data Preprocessing (Separate Pipelines):
- EEG: Apply band-pass filtering, remove bad channels, and perform Independent Component Analysis (ICA) to remove ocular and cardiac artifacts.
- fNIRS: Convert raw light intensity into optical density, then into concentration changes of oxygenated (HbO) and deoxygenated hemoglobin (HbR). Apply band-pass filtering to remove physiological noise (cardiac, respiratory) and motion artifact correction algorithms [103].
- Feature Extraction:
- EEG: Extract power spectral density in specific frequency bands (e.g., mu-band: 8-13 Hz) from all channels and time points of interest.
- fNIRS: Extract the mean HbO and HbR amplitude during each task block from all channels.
- Data Fusion with ssmCCA:
- Input the EEG features and fNIRS features (e.g., HbO from all channels) into the ssmCCA algorithm.
- The ssmCCA model, using its structured sparsity penalty, will find linear transformations for each modality that maximize their correlation while performing feature selection and preserving spatial relationships in the data [100] [101].
- The output will reveal which combinations of EEG and fNIRS features are most strongly correlated, highlighting brain regions and electrical patterns central to the task.
Signaling and Workflow Diagrams
The Scientist's Toolkit: Research Reagent Solutions
Table 2: Essential Materials for EEG-fNIRS-ssmCCA Research
| Item Name | Function / Explanation | Example Use Case |
|---|---|---|
| Integrated EEG-fNIRS Cap | A cap with slits to host both EEG electrodes and fNIRS optodes, often based on the 10-20 system. A dark fabric reduces optical reflection. | Simultaneous data acquisition from sensorimotor cortices [10] [89]. |
| Synchronization Hardware/Software | A system (e.g., TTL pulse generator) or protocol (e.g., Lab Streaming Layer - LSL) to send identical event markers to both EEG and fNIRS recorders. | Critical for temporal alignment of fast EEG events with slower fNIRS blocks during offline analysis [10] [89]. |
| Structured Sparse CCA Algorithm | The core computational tool (e.g., implemented in MATLAB or Python) that applies graph-guided fused LASSO penalty to multiset CCA for feature selection. | Fusing high-dimensional EEG and fNIRS features to find maximally correlated neural patterns [100] [101]. |
| Motion Artifact Correction Algorithms | Advanced signal processing techniques (e.g., adaptive filtering with accelerometer data) to clean motion artifacts, especially from fNIRS signals. | Essential for experiments involving overt movement, such as action execution or walking [103]. |
| Accelerometer | A sensor added to the cap to record head movement. Its signal is used as a reference for adaptive filtering to remove motion artifacts from the fNIRS data. | Cleaning data from mobile paradigms (e.g., treadmill walking) [103]. |
Technical Support & Troubleshooting Hub
This section provides targeted assistance for common challenges encountered during multimodal neuroimaging research, with a specific focus on motion tolerance in fNIRS and EEG.
Frequently Asked Questions (FAQs)
Q1: Our research involves monitoring patients in a rehabilitation setting where some head movement is unavoidable. Which modality is more tolerant of motion artifacts, fNIRS or EEG?
A: fNIRS is generally more robust and tolerant of movement artifacts than EEG [106]. This makes it particularly suitable for studies in ecological or real-world settings, such as rehabilitation clinics, with ambulatory participants [106]. In contrast, EEG is highly susceptible to movement artifacts and is better suited for highly controlled lab environments where movement can be minimized [106].
Q2: We are setting up a simultaneous EEG-fNIRS study. How can we minimize motion artifacts during data collection?
A: For combined EEG-fNIRS studies, specific steps can be taken to minimize motion's impact [106]:
- Secure Sensor Placement: Use tight but comfortable cap fittings to prevent slippage [106].
- Sensor Arrangement: Avoid physically overlapping EEG electrodes and fNIRS optodes on the scalp [106].
- Supplementary Sensors: Employ an accelerometer to record head movement data. This information can later be used with advanced signal processing techniques, like adaptive filtering, to clean the motion effects from the data [103].
- Software Correction: Utilize motion correction algorithms during the data preprocessing stage [106].
Q3: The hemodynamic response measured by fNIRS seems delayed compared to the neural events we see in EEG. Is this normal?
A: Yes, this is an expected and fundamental difference. EEG measures the brain's electrical activity directly, offering millisecond-level temporal resolution [106]. fNIRS measures the hemodynamic response (changes in blood oxygenation), which is an indirect marker of neural activity and has a slower temporal resolution, typically on the scale of seconds [106]. A normal hemodynamic response to a neural event usually occurs within 2 to 6 seconds [103].
Q4: Can we use a standard EEG cap for a combined EEG-fNIRS study?
A: Yes, the international 10–20 system is often used for placement of both EEG electrodes and fNIRS optodes [106]. For integrated setups, it is recommended to use high-density EEG caps that have pre-defined, compatible openings for mounting fNIRS optodes, or to use specialized optode holders that avoid contact with electrode points [106]. Some vendors also offer integrated caps designed for this purpose [10].
Quantitative Data Comparison: fNIRS vs. EEG vs. fMRI
The table below summarizes key technical characteristics of these neuroimaging modalities, with a focus on motion tolerance.
Table 1: Comparison of Neuroimaging Modalities for Clinical Translation
| Feature | EEG | fNIRS | fMRI |
|---|---|---|---|
| What It Measures | Electrical activity from cortical neurons [106] | Hemodynamic response (HbO/HbR) [106] | Blood Oxygen Level Dependent (BOLD) signal [90] |
| Temporal Resolution | High (milliseconds) [106] | Low (seconds) [106] | Very Low (seconds) |
| Spatial Resolution | Low (centimeter-level) [106] | Moderate (better than EEG) [106] | High [90] |
| Motion Tolerance | Low - highly susceptible to movement artifacts [106] | Moderate - relatively robust to movement [106] [103] | Very Low - requires near total immobilization [10] |
| Portability | High (wearable systems available) [106] | High (wearable, field-deployable) [106] [103] | None (fixed scanner) |
| Best Use Cases for Bedside Monitoring | Fast cognitive tasks, seizure detection, sleep studies [106] | Naturalistic studies, child development, motor rehab, real-world settings [106] | Precise anatomical localization and deep brain activity in controlled settings [10] |
Experimental Protocol: Simultaneous EEG-fNIRS for Motor Imagery Neurofeedback
This protocol is adapted from a study evaluating multimodal neurofeedback (NF) and is well-suited for investigating post-stroke motor rehabilitation, a context where motion tolerance is a key consideration [10].
Detailed Methodology
Aim: To assess the benefits of combining EEG and fNIRS for NF during upper-limb motor imagery (MI) tasks.
Equipment & Reagents: Table 2: Research Reagent Solutions & Essential Materials
| Item | Function |
|---|---|
| Integrated EEG-fNIRS Cap | A custom cap (e.g., EasyCap) that holds both EEG electrodes and fNIRS optodes over the sensorimotor cortices [10]. |
| EEG System | A high-density amplifier system (e.g., 32-channel ActiCHamp) to record electrical brain activity [10]. |
| fNIRS System | A continuous-wave fNIRS system (e.g., NIRScout XP) with sources (e.g., 760 & 850 nm LEDs) and detectors to measure hemodynamic changes [10]. |
| Synchronization Hardware/Software | TTL pulses or a shared clock system to temporally align the EEG and fNIRS data streams [106] [10]. |
| Visual Feedback Display | A screen to present the NF metaphor (e.g., a moving ball) to the participant in real-time [10]. |
| Data Processing Computer | A computer with custom software for real-time signal processing, NF score calculation, and feedback presentation [10]. |
Procedure:
- Sensor Placement: Position the integrated cap on the participant's head according to the international 10-10 system. Place EEG electrodes (e.g., FC5, FC3, FC1, FCz, FC2, FC4, FC6, C5, C3, C1, Cz, C2, C4, C6, CP5, CP3, CP1, CPz, CP2, CP4, CP6) and fNIRS optodes over the sensorimotor cortices [10].
- Signal Quality Check: Ensure good contact for all EEG electrodes and fNIRS optodes. Verify signal quality for both modalities before starting the experiment.
- Task Paradigm (Block Design):
- Instruct the participant to perform motor imagery of their left hand.
- The experiment will consist of alternating blocks of "Rest" and "MI Task."
- During "MI Task" blocks, participants are presented with real-time visual feedback (the NF score) based on their brain activity.
- Experimental Conditions: Run the participant through three randomized NF conditions in separate sessions or blocks:
- Condition A: EEG-only based NF.
- Condition B: fNIRS-only based NF.
- Condition C: Combined EEG-fNIRS based NF.
- Data Acquisition & Synchronization: Simultaneously record EEG and fNIRS data, using hardware triggers to ensure precise temporal synchronization between the two systems [106] [10].
- Real-Time Processing: In the combined condition, compute a single NF score derived from features of both the EEG signal (e.g., event-related desynchronization in the mu/beta rhythm over the right motor cortex) and the fNIRS signal (e.g., increase in oxygenated hemoglobin in the same region) [10].
Visualization of Workflows and Decision Pathways
The following diagrams, generated using Graphviz DOT language, illustrate the logical relationships and experimental workflows for multimodal monitoring.
Diagram 1: Modality Selection Logic
Diagram 2: Multimodal Experiment Workflow
Conclusion
The motion tolerance comparison reveals a clear continuum from fMRI (least tolerant) to fNIRS (most tolerant), with EEG occupying an intermediate position with specific vulnerability profiles. fNIRS emerges as the superior choice for naturalistic studies, mobile applications, and populations prone to movement, while EEG remains optimal for capturing rapid neural dynamics in controlled settings, and fMRI provides unparalleled spatial resolution when complete immobility can be maintained. Future directions point toward increased multimodal integration, with combined EEG-fNIRS systems offering complementary temporal and spatial resolution while maintaining good motion tolerance. Advancements in deep learning for motion artifact removal and the development of more portable, robust hardware will further expand the applications of motion-tolerant neuroimaging in both research and clinical drug development contexts, particularly for longitudinal monitoring and real-world assessment of therapeutic efficacy.
References
- 1. fNIRS vs EEG: Comparing Non-Invasive Brain Imaging ... [https://imotions.com/blog/learning/research-fundamentals/fnirs-vs-eeg/?srsltid=AfmBOoqh3dhgL27iQ5kDcngzLUWKUK-teXs0VBeQrUs0uFMTfdfTbXmV]
- 2. Applications and advances of combined fMRI-fNIRs ... [https://www.frontiersin.org/journals/neurology/articles/10.3389/fneur.2025.1542075/full]
- 3. The application of fNIRS in studies on occupational workload [https://www.frontiersin.org/journals/public-health/articles/10.3389/fpubh.2025.1560605/full]
- 4. Motion artifacts removal and evaluation techniques for ... [https://www.frontiersin.org/journals/neuroscience/articles/10.3389/fnins.2022.878750/full]
- 5. Controlling jaw-related motion artifacts in functional near- ... [https://www.sciencedirect.com/science/article/pii/S0165027023000298]
- 6. Learning based motion artifacts processing in fNIRS [https://pmc.ncbi.nlm.nih.gov/articles/PMC10683641/]
- 7. Motion Artifact Removal from EEG Signals Using the ... [https://www.sciencedirect.com/science/article/pii/S1746809425013886]
- 8. fNIRS reproducibility varies with data quality, analysis ... [https://www.nature.com/articles/s42003-025-08412-1]
- 9. Simultaneous multimodal fNIRS-EEG recordings reveal ... [https://www.nature.com/articles/s41598-023-31609-5]
- 10. Evaluating the effects of multimodal EEG-fNIRS ... [https://pmc.ncbi.nlm.nih.gov/articles/PMC12425317/]
- 11. fNIRS vs EEG: Comparing Non-Invasive Brain Imaging ... [https://imotions.com/blog/learning/research-fundamentals/fnirs-vs-eeg/?srsltid=AfmBOopWgYbmFrEaFJEquYz1gmFLR9_SsDYxrPEE-rEIhxs9JU8idQx5]
- 12. Application of Functional Near-Infrared Spectroscopy to the Study of... [https://pmc.ncbi.nlm.nih.gov/articles/PMC5582298/]
- 13. Motion artifacts in functional near-infrared spectroscopy [https://pmc.ncbi.nlm.nih.gov/articles/PMC3762942/]
- 14. Electrophysiological Insights in Exergaming ... [https://games.jmir.org/2025/1/e50992]
- 15. EEG Artifacts: Types, Detection, and Removal Techniques ... [https://www.bitbrain.com/blog/eeg-artifacts]
- 16. Getting to know EEG artifacts and how to handle them in ... [https://pressrelease.brainproducts.com/eeg-artifacts-handling-in-analyzer/]
- 17. How to handle EEG artifacts? - Neuroscience Grrl [https://neurosciencegrrl.net/post/how-to-handle-eeg-artifacts/4678]
- 18. fNIRS vs EEG: Comparing Non-Invasive Brain Imaging ... [https://imotions.com/blog/learning/research-fundamentals/fnirs-vs-eeg/?srsltid=AfmBOopxydf2jaTdQmT2bezhrnveNqINzLXC3y65piypbGKMmShk-qJf]
- 19. A Cross-Disciplinary Review of the fNIRS-EEG Dual-Modality ... [https://pmc.ncbi.nlm.nih.gov/articles/PMC11506513/]
- 20. Technical aspects of EEG [https://www.medlink.com/articles/technical-aspects-of-eeg]
- 21. Accounting for motion in resting-state fMRI - PubMed Central [https://pmc.ncbi.nlm.nih.gov/articles/PMC9233079/]
- 22. Accounting for motion in resting-state fMRI: What part of the ... [https://www.sciencedirect.com/science/article/pii/S1053811922004153]
- 23. Reducing the effects of motion artifacts in fMRI: A structured ... [https://pmc.ncbi.nlm.nih.gov/articles/PMC8934405/]
- 24. fMRI Environment Can Impair Memory Performance in Young ... [https://pmc.ncbi.nlm.nih.gov/articles/PMC1592517/]
- 25. fNIRS vs EEG: Comparing Non-Invasive Brain Imaging ... [https://imotions.com/blog/learning/research-fundamentals/fnirs-vs-eeg/?srsltid=AfmBOoqRaDvXduquXKurhNxj0l1xsA7Y4nVwrHl3LT14pGfnojtszS-_]
- 26. fNIRS vs EEG: Comparing Non-Invasive Brain Imaging ... [https://imotions.com/blog/learning/research-fundamentals/fnirs-vs-eeg/?srsltid=AfmBOork7LP4MTF0QQfnaVhtRJltemeVKnqhkDqHPcw9ueGuxEZKciZi]
- 27. Exploring Imagined Movement for Brain–Computer Interface ... [https://pmc.ncbi.nlm.nih.gov/articles/PMC12468679/]
- 28. EEG-fMRI Artifact Correction Techniques [https://www.nature.com/research-intelligence/nri-topic-summaries/eeg-fmri-artifact-correction-techniques-micro-223984]
- 29. Correction of Physiological Artifacts in Multi‐Echo fMRI Data ... [https://pmc.ncbi.nlm.nih.gov/articles/PMC12183604/]
- 30. A Motion Artifact Correction Procedure for fNIRS Signals ... [https://pmc.ncbi.nlm.nih.gov/articles/PMC8346954/]
- 31. Motion Artifacts Correction from Single-Channel EEG and ... [https://www.mdpi.com/1424-8220/22/9/3169]
- 32. Motion Artifacts Reduction for Noninvasive Hemodynamic ... [https://pmc.ncbi.nlm.nih.gov/articles/PMC10256054/]
- 33. How to design real-world functional near-infrared ... [https://pmc.ncbi.nlm.nih.gov/articles/PMC12618016/]
- 34. The functional near infrared spectroscopy applications in ... [https://www.frontiersin.org/journals/neurology/articles/10.3389/fneur.2025.1495138/full]
- 35. Applications of Functional Near-Infrared Spectroscopy ... [https://www.mdpi.com/2077-0383/14/15/5197]
- 36. fNIRS vs EEG: Comparing Non-Invasive Brain Imaging ... [https://imotions.com/blog/learning/research-fundamentals/fnirs-vs-eeg/?srsltid=AfmBOoovuL_EtSIip867PZzpWai-Mdg9kyWZHHvW4pU2Qt7a0l7gWDIC]
- 37. Naturalistic fNIRS assessment reveals decline in executive ... [https://www.nature.com/articles/s41598-025-20844-7]
- 38. Verbal fluency tasks and attention problems in children ... [https://pmc.ncbi.nlm.nih.gov/articles/PMC12263389/]
- 39. fNIRS vs EEG: Comparing Non-Invasive Brain Imaging ... [https://imotions.com/blog/learning/research-fundamentals/fnirs-vs-eeg/?srsltid=AfmBOopYpyYmKBZh5MmXRrwXByIa5Gkk14LAfm8aTpqFaRRfJu8d8-JK]
- 40. Motion Artifact Removal Techniques for Wearable EEG ... [https://www.frontiersin.org/journals/electronics/articles/10.3389/felec.2021.685513/full]
- 41. EEG Trouble Shooting | Center for ... [https://www.centerforsleepandcognition.com/eeg-trouble-shooting]
- 42. Methods for motion artifact reduction in online brain ... [https://pmc.ncbi.nlm.nih.gov/articles/PMC10619676/]
- 43. Prospective Motion Correction in Functional MRI - PMC [https://pmc.ncbi.nlm.nih.gov/articles/PMC5427003/]
- 44. EEG Machine Troubleshooting: Symptom Reasons ... [https://www.scribd.com/document/540019750/EEG-Troubleshooting-Pr]
- 45. False fMRI activation after motion correction - PMC [https://pmc.ncbi.nlm.nih.gov/articles/PMC5553448/]
- 46. High-Field fMRI for Human Applications: An Overview of ... [https://pmc.ncbi.nlm.nih.gov/articles/PMC3245408/]
- 47. Real-time fMRI using multi-band echo-volumar imaging ... [https://www.frontiersin.org/journals/neuroscience/articles/10.3389/fnins.2025.1543206/full]
- 48. High-resolution structural brain imaging [https://www.sciencedirect.com/science/article/abs/pii/B9780128244609000145]
- 49. fNIRS vs EEG: Comparing Non-Invasive Brain Imaging ... [https://imotions.com/blog/learning/research-fundamentals/fnirs-vs-eeg/?srsltid=AfmBOor-cwPWnBF9vRsZk119yXQc5WtlVDvHpml4fWHXKGSpzbMKIwyL]
- 50. The role of fMRI in drug development - PMC - PubMed Central [https://pmc.ncbi.nlm.nih.gov/articles/PMC5931333/]
- 51. Opportunities for use of neuroimaging in de-risking drug ... [https://www.nature.com/articles/s41386-024-01970-8]
- 52. fNIRS vs EEG: Comparing Non-Invasive Brain Imaging ... [https://imotions.com/blog/learning/research-fundamentals/fnirs-vs-eeg/?srsltid=AfmBOorjSbJIlsphFplN8oN-6B6FvO7yCbkLdy-9QrUmP5Wtqtx8wpHa]
- 53. Applications and advances of combined fMRI-fNIRs ... [https://pmc.ncbi.nlm.nih.gov/articles/PMC11958174/]
- 54. The present and future use of functional near‐infrared spectroscopy... [https://pmc.ncbi.nlm.nih.gov/articles/PMC6367070/]
- 55. Mobile EEG Mobile Electroencephalography - Brainbox [https://brainbox-neuro.com/techniques/mobile-eeg]
- 56. Environmental effects on inter-brain coupling: a systematic ... [https://pmc.ncbi.nlm.nih.gov/articles/PMC12351501/]
- 57. Hearables: Bioelectronics technological challenges and ... [https://pmc.ncbi.nlm.nih.gov/articles/PMC12529436/]
- 58. An evaluation of the efficacy, reliability, and sensitivity ... [https://www.sciencedirect.com/science/article/pii/S1053811917310972]
- 59. Review Functional near-infrared spectroscopy based blood ... [https://www.sciencedirect.com/science/article/abs/pii/S0031938424001197]
- 60. fNIRS vs EEG: Comparing Non-Invasive Brain Imaging ... [https://imotions.com/blog/learning/research-fundamentals/fnirs-vs-eeg/?srsltid=AfmBOorPu1656RankxfBTsv2exg0qPkWdpGoqv8iGSySssdcmo0YCi6x]
- 61. Why Brain Wearables Are Making Traditional EEG Labs ... [https://globalrph.com/2025/10/why-brain-wearables-are-making-traditional-eeg-labs-obsolete-in-2025/]
- 62. Characterizing motion artifacts in functional near-infrared ... [https://www.sciencedirect.com/science/article/pii/S1746809425007670]
- 63. A Systematic Review of Techniques for Artifact Detection ... [https://pmc.ncbi.nlm.nih.gov/articles/PMC12473706/]
- 64. Prospective Motion Correction of Functional MRI Using ... [https://archive.ismrm.org/2025/1438.html]
- 65. Simultaneous EEG and fNIRS recordings for semantic ... [https://www.nature.com/articles/s41597-025-04967-0]
- 66. Motion artifacts removal and evaluation techniques for ... [https://pmc.ncbi.nlm.nih.gov/articles/PMC9576156/]
- 67. Enhancing fNIRS data analysis with a novel motion artifact ... [https://www.sciencedirect.com/science/article/abs/pii/S1746809424005548]
- 68. A Cross-Disciplinary Review of the fNIRS-EEG Dual ... [https://www.mdpi.com/2076-3425/14/10/1022]
- 69. Computer Vision-Driven Movement Annotations to ... [https://www.mdpi.com/1424-8220/24/21/6821]
- 70. fNIRS vs EEG: Comparing Non-Invasive Brain Imaging ... [https://imotions.com/blog/learning/research-fundamentals/fnirs-vs-eeg/?srsltid=AfmBOoqUZNtjcPVC2Nk6pb7rrV103OmdQQlMMSQ69tu-6Pbm6uoFQ8S2]
- 71. Comparison of fNIRS with other neuroimaging modalities [https://www.artinis.com/blogpost-all/comparison-fnirs-vs-fmri]
- 72. Deep learning-based motion artifact removal in functional ... [https://www.spiedigitallibrary.org/journals/neurophotonics/volume-9/issue-4/041406/Deep-learning-based-motion-artifact-removal-in-functional-near-infrared/10.1117/1.NPh.9.4.041406.full]
- 73. Detecting cognitive motor dissociation by functional near- ... [https://www.frontiersin.org/journals/neurology/articles/10.3389/fneur.2025.1532804/full]
- 74. Optimizing spatial specificity and signal quality in fNIRS [https://www.frontiersin.org/journals/neuroergonomics/articles/10.3389/fnrgo.2024.1286586/full]
- 75. Transformer-based deep learning model for predicting ... [https://pmc.ncbi.nlm.nih.gov/articles/PMC12618017/]
- 76. Disentangling the impact of motion artifact correction ... [https://pmc.ncbi.nlm.nih.gov/articles/PMC11498316/]
- 77. fNIRS vs EEG: Comparing Non-Invasive Brain Imaging ... [https://imotions.com/blog/learning/research-fundamentals/fnirs-vs-eeg/?srsltid=AfmBOop5r_Zf1lYleUZ33simBJDVXzZkkZwYu-wwDI9qRYLNSnDx0C3h]
- 78. Recommendations for motion correction of infant fNIRS ... [https://www.sciencedirect.com/science/article/pii/S1053811919305531]
- 79. Deep learning-based motion artifact removal in functional ... [https://pmc.ncbi.nlm.nih.gov/articles/PMC9034734/]
- 80. EEG–fNIRS signal integration for motor imagery ... [https://www.sciencedirect.com/science/article/pii/S2772528625000299]
- 81. fNIRS vs EEG: Comparing Non-Invasive Brain Imaging ... [https://imotions.com/blog/learning/research-fundamentals/fnirs-vs-eeg/?srsltid=AfmBOorPNdMGEZtK1vjhzaA5Fiwt0nNx0hFxV6J-jLmLn9WMEmdq3Kwv]
- 82. Functional Near-Infrared Spectroscopy in Schizophrenia ... [https://pmc.ncbi.nlm.nih.gov/articles/PMC12413766/]
- 83. Reduction of Motion Artifacts in Functional Connectivity ... [https://pmc.ncbi.nlm.nih.gov/articles/PMC9618388/]
- 84. Motion Artifacts Correction from Single-Channel EEG and ... [https://pmc.ncbi.nlm.nih.gov/articles/PMC9102309/]
- 85. Learning based motion artifacts processing in fNIRS: a mini ... [https://www.frontiersin.org/journals/neuroscience/articles/10.3389/fnins.2023.1280590/full]
- 86. Reduction of motion-related artifacts in resting state fMRI ... [https://www.sciencedirect.com/science/article/abs/pii/S105381191400175X]
- 87. fNIRS vs EEG: Comparing Non-Invasive Brain Imaging ... [https://imotions.com/blog/learning/research-fundamentals/fnirs-vs-eeg/?srsltid=AfmBOoqwb7be0b4f6byWfpCEPHs2Qds9eZqjUkmlR2eWEy1dX9VJ39ae]
- 88. fNIRS vs EEG: Comparing Non-Invasive Brain Imaging ... [https://imotions.com/blog/learning/research-fundamentals/fnirs-vs-eeg/?srsltid=AfmBOoq7ArdaQyKsLFspqR9IKOAKebZzpOueQwDc1qXzzysEa3otPKT-]
- 89. EEG-fNIRS Cookbook [https://www.brainproducts.com/support-resources/eeg-fnirs-cookbook/]
- 90. Environmental effects on inter-brain coupling: a systematic ... [https://www.frontiersin.org/journals/human-neuroscience/articles/10.3389/fnhum.2025.1627457/full]
- 91. Comparison of motion correction techniques applied to ... [https://pmc.ncbi.nlm.nih.gov/articles/PMC9900395/]
- 92. Fusion of fNIRS and EEG: a step further in brain research [https://www.bitbrain.com/blog/fusion-fnirs-eeg-brain-activity-research]
- 93. Early-stage fusion of EEG and fNIRS improves ... [https://www.frontiersin.org/journals/neuroscience/articles/10.3389/fnins.2022.1062889/full]
- 94. Early-stage fusion of EEG and fNIRS improves ... [https://pmc.ncbi.nlm.nih.gov/articles/PMC9869134/]
- 95. Reproducibility of fNIRS within Subject for Visual and Motor ... [https://www.sciencedirect.com/science/article/pii/S1053811925004951]
- 96. Enhancing Brain Plasticity: Functional near-infrared ... [https://www.sciencedirect.com/science/article/pii/S0361923025004587]
- 97. fNIRS vs EEG: Comparing Non-Invasive Brain Imaging ... [https://imotions.com/blog/learning/research-fundamentals/fnirs-vs-eeg/?srsltid=AfmBOopVYVjKgSip3zyFiI4_x4Hy5GSny66egfrgxgciM12FMxoEqgqx]
- 98. Methods to detect, characterize, and remove motion artifact ... [https://www.sciencedirect.com/science/article/abs/pii/S1053811913009117]
- 99. Synchronization processes in fNIRS visibility networks [https://appliednetsci.springeropen.com/articles/10.1007/s41109-024-00663-x]
- 100. Structured sparse multiset canonical correlation analysis of ... [https://pubmed.ncbi.nlm.nih.gov/35477980/]
- 101. Structured sparse multiset canonical correlation analysis of ... [https://www.nature.com/articles/s41598-022-10942-1]
- 102. fNIRS vs EEG: Comparing Non-Invasive Brain Imaging ... [https://imotions.com/blog/learning/research-fundamentals/fnirs-vs-eeg/?srsltid=AfmBOoqgr9HAN3cAkBiAM4YtIzxQhO5r39NyJU_5iAycgeEkM8Gy806W]
- 103. What should I know about fNIRS imaging? [https://www.biopac.com/knowledge-base/fnir-faq/]
- 104. A Practical Guide for fNIRS and EEG [https://nirx.net/blog-content/2021/12/22/eeg-fnirs-guideline-download]
- 105. FAQ on NIRS - fNIRS Questions Answered [https://nirx.net/faq]
- 106. fNIRS vs EEG: Comparing Non-Invasive Brain Imaging ... [https://imotions.com/blog/learning/research-fundamentals/fnirs-vs-eeg/?srsltid=AfmBOop-WcKwEkgJgRe8pRauhoGIcBvodrmkWo8vjUx0hujZv0dkgSVg]