Virtual Reality Spatial Navigation as a Digital Biomarker for Early Alzheimer's Detection in Clinical Research and Drug Development
This article synthesizes current research on Virtual Reality (VR) spatial navigation tasks as sensitive, non-invasive digital biomarkers for early Alzheimer's disease (AD) detection.
Virtual Reality Spatial Navigation as a Digital Biomarker for Early Alzheimer's Detection in Clinical Research and Drug Development
Abstract
This article synthesizes current research on Virtual Reality (VR) spatial navigation tasks as sensitive, non-invasive digital biomarkers for early Alzheimer's disease (AD) detection. It explores the foundational neuroscience linking path integration deficits to entorhinal cortex pathology, details methodological approaches for implementing VR in clinical trials, addresses key optimization challenges, and validates performance against established plasma and imaging biomarkers. Tailored for researchers and drug development professionals, this review highlights how VR-based cognitive assessment can enhance participant screening, monitor therapeutic efficacy, and serve as a functional outcome measure in preclinical and prodromal AD trials.
The Neuroscience of Spatial Navigation and Its Early Vulnerability in Alzheimer's Pathology
The Entorhinal Cortex as the Epicenter of Early Alzheimer's Pathophysiology
The entorhinal cortex (EC), a brain region critical for memory and spatial navigation, is now established as the earliest site of pathological change in Alzheimer's disease (AD) [1] [2] [3]. This application note details the central role of EC dysfunction in AD's preclinical stages, framing this pathophysiology as a foundational biological principle for developing early detection strategies, particularly those leveraging virtual reality (VR) spatial navigation tasks. Decades of postmortem and neuroimaging evidence confirm that neurofibrillary tangles (NFTs) of tau protein and significant neuronal death occur in the EC layers II/III years before the onset of clinical dementia [1] [4] [3]. More recent electrophysiological findings reveal that impaired neuronal activity, including dysfunction of grid cells responsible for spatial mapping, precedes overt neurodegeneration and correlates with early spatial memory deficits [1] [2]. This convergence of pathological and functional alterations positions the EC as a critical biomarker and target for therapeutic intervention. We provide a synthesized overview of quantitative evidence, detailed experimental protocols for assessing EC-dependent spatial navigation in both rodents and humans, and a catalog of essential research tools to accelerate the development of EC-focused diagnostic and therapeutic platforms for preclinical AD.
Alzheimer's disease progresses through decades-long stages, beginning with a preclinical (asymptomatic) stage, moving to mild cognitive impairment (MCI), and finally culminating in dementia [1] [5]. A cornerstone of AD research is the Braak staging system, which demonstrates that the formation of NFTs begins in the transentorhinal region of the EC (Braak stages I-II) during the preclinical stage [1]. These tangles subsequently propagate to the hippocampus (Braak stages III-IV) at the MCI stage and eventually spread throughout the neocortex in dementia (Braak stages V-VI) [1]. This anatomical progression is coupled with severe cellular degeneration, resulting in up to 60-75% loss of layer II neurons in the EC [1] [2]. The EC serves as a major gateway, or "hub," interconnecting the hippocampus with multimodal association cortices, and its disruption effectively disconnects the hippocampus, leading to the profound memory and navigation impairments characteristic of AD [1] [2]. Consequently, the EC's early and selective vulnerability provides a critical window for early diagnostic and therapeutic strategies aimed at preventing or slowing disease progression before widespread, irreversible brain damage occurs.
Key Pathophysiological and Functional Evidence
The following tables synthesize key quantitative and observational data that underpin the EC's role as the epicenter of early AD.
Table 1: Histological and Functional Alterations in the Entorhinal Cortex Across AD Stages
| AD Stage | Key Histological/PATHOLOGICAL Changes | Functional & Behavioral Correlates | Supporting Evidence |
|---|---|---|---|
| Preclinical (Asymptomatic) | - Tau tangle formation begins in EC Layer II (Braak I-II) [1].- Aβ deposition and physiological alterations begin [1].- ~20% reduction in grid cell tuning in mouse models [1]. | - No overt cognitive symptoms [1].- fMRI shows reduced grid-cell-like activity in at-risk humans (APOE-ε4 carriers) [1].- Spatial memory is intact despite grid cell impairment in mice [1]. | Postmortem studies [3], Tau-PET [1], APP-KI mouse models [1], human fMRI [1]. |
| Mild Cognitive Impairment (MCI) | - Tau propagates from EC to hippocampus (Braak III-IV) [1].- Significant EC atrophy measurable via MRI [4].- ~75% loss of MEC Layer II excitatory neurons in EC-Tau mice [1]. | - Moderate memory-related symptoms (e.g., forgetting appointments) [1].- Spatial navigation deficits, particularly in allocentric strategies [5].- EC atrophy is a strong predictor of progression from MCI to AD dementia [4]. | Structural MRI [4], EC-Tau mouse models [1], VR navigation tests [5]. |
| Dementia | - Widespread NFTs in cortical areas (Braak V-VI) [1].- Severe structural atrophy of the EC and hippocampus [2]. | - Severe memory loss, inability to perform daily tasks [1].- Profound deficits in both allocentric and egocentric navigation [5] [6].- Patients experience spatial disorientation and getting lost [6]. | Clinical diagnosis, VR and real-world navigation tests [6], postmortem analysis. |
Table 2: Performance of AD Patients on Spatial Navigation Tasks in Virtual and Real Worlds
| Assessment Tool | Navigation Strategy Assessed | Key Performance Deficits in AD vs. Controls | Predictive Value |
|---|---|---|---|
| Sea Hero Quest (SHQ) [6] | Allocentric (Wayfinding) | - Increased wayfinding distance.- Increased wayfinding duration. | Significantly predicted composite disorientation score in the real world (β = 0.422, R²=0.299) [6]. |
| Virtual Supermarket Test (VST) [6] | Egocentric & Allocentric | - Impaired egocentric orientation.- Impaired allocentric orientation.- Impaired heading direction. | Could not reliably predict highest-risk patients in the community (p > 0.1) [6]. |
| Detour Navigation Test (DNT - Real World) [6] | Integrated/Egocentric | - Increased spatial disorientation in a familiar community setting. | Real-world benchmark for spatial disorientation. |
The following diagram illustrates the central role of EC dysfunction in the early AD pathway, connecting molecular pathology to cellular, network, and cognitive deficits.
Experimental Protocols for Assessing EC Function
This section provides detailed methodologies for evaluating EC-dependent spatial navigation and memory in animal models and human participants, which is crucial for preclinical AD research.
Protocol: Active Place Avoidance (APA) Task in Rodents
The APA task is a robust, hippocampal- and EC-dependent behavioral test for assessing spatial learning and memory in mice [7]. It requires the animal to use distal visual cues (allothetic navigation) to avoid a stationary shock zone on a rotating arena, preventing the use of internal, self-movement cues.
- Primary Applications: Assessing short- and long-term spatial memory, cognitive flexibility via reversal learning, and screening cognitive effects of therapeutics or genetic modifications in AD rodent models.
- Key Advantages: Rapid acquisition of spatial learning within a single trial; distinguishes between spatial navigation and non-spatial strategies (e.g., chaining); highly sensitive to EC/hippocampal dysfunction.
Materials and Equipment
- APA Apparatus: Elevated rotating arena (77 cm diameter) with metal grid floor, surrounded by a 32-cm high transparent boundary.
- Tracking System: Overhead camera connected to tracking software (e.g., Bio-Signal Group Tracker).
- Shock Delivery System: Constant current shock source with scrambler (0.5 mA, 500 ms).
- Visual Cues: Four distinct, high-contrast A3-sized cues placed on room walls.
- Cleaning Supplies: 70% ethanol to clean arena between trials.
Stepwise Procedure
- Pre-test Handling: Handle mice daily for 30-60 seconds for two weeks prior to testing to minimize stress.
- Habituation (Day 0): Place the mouse on the stationary, non-energized arena for 10 minutes. Allow free exploration without shock.
- Testing (Day 1 for short-term memory):
- Place the mouse in the arena, which now rotates counter-clockwise at 1 rpm.
- The shock zone (a 60° sector) is fixed in space. A foot shock is delivered upon entry, with subsequent shocks every 1.5 seconds if the mouse remains.
- Conduct a single 20-minute trial.
- Track the mouse's path and record: number of entrances into the shock zone, latency to first entrance, and total time spent in the shock zone.
- Testing (Consecutive Days for long-term memory): Repeat the 20-minute trial once per day for 4-5 consecutive days to assess long-term memory encoding and retrieval.
- Reversal Learning (Cognitive Flexibility): After the standard test, change the location of the shock zone to the opposite quadrant for one or more trials to assess the ability to learn a new spatial contingency.
Data Analysis
- Learning Acquisition: Compare the number of shocks in the first 5 minutes versus the last 5 minutes of a single trial. A significant decrease indicates successful rapid spatial learning.
- Long-term Memory: Compare the number of shocks and latency to first shock on Day 1 versus Days 4-5. Improved performance indicates robust long-term spatial memory.
- Path Efficiency: Analyze the total distance traveled and the specificity of avoidance using heat maps.
Protocol: Virtual Reality-Based Spatial Navigation Assessment in Humans
This protocol outlines the use of non-immersive VR tasks on a tablet device to assess allocentric navigation, a function highly dependent on the EC and hippocampus, in at-risk and MCI populations [5] [6].
- Primary Applications: Differentiating cognitively normal individuals from those with MCI or AD; stratifying risk in preclinical AD (e.g., APOE-ε4 carriers); serving as a functional outcome measure in clinical trials.
- Key Advantages: Standardized, controllable environments; ability to isolate specific navigational strategies (allocentric vs. egocentric); better ecological validity than traditional paper-and-pencil tests; scalable for large-scale screening.
Materials and Equipment
- Hardware: iPad or tablet computer.
- Software: Validated VR navigation applications (e.g., Sea Hero Quest (SHQ), Virtual Supermarket Test (VST)).
- Cognitive Screening Tool: Mini-Addenbrooke's Cognitive Examination (Mini-ACE) or similar.
- Data Collection Forms: For demographics and clinical history.
Stepwise Procedure
- Participant Screening and Consent: Recruit participants (e.g., cognitively normal, MCI, AD) following ethical approval. Obtain informed consent. Collect demographics and history of getting lost episodes.
- Cognitive Screening: Administer the Mini-ACE to establish a baseline cognitive profile.
- VR Task Administration:
- Sea Hero Quest (SHQ): Instruct the participant to navigate a virtual boat through waterways to find a set of checkpoints as quickly as possible. This primarily taxes allocentric (wayfinding) navigation [6].
- Key Metrics: Wayfinding distance, wayfinding duration, success rate.
- Virtual Supermarket Test (VST): Show the participant first-person videos of navigation along a set path in a virtual supermarket. After each trial, ask questions to assess [6]:
- Egocentric Orientation: "Point to your starting position."
- Allocentric Orientation: "Mark the path you took on a map."
- Heading Direction: "Point to the destination."
- Sea Hero Quest (SHQ): Instruct the participant to navigate a virtual boat through waterways to find a set of checkpoints as quickly as possible. This primarily taxes allocentric (wayfinding) navigation [6].
- Community Navigation Testing (Optional Validation): In a separate session, administer a real-world navigation test (e.g., Detour Navigation Test) in a familiar community setting to correlate VR performance with real-world spatial disorientation [6].
Data Analysis
- Group Comparisons: Use ANOVA or t-tests to compare SHQ and VST performance metrics between diagnostic groups.
- Correlation and Regression: Correlate VR performance (e.g., SHQ wayfinding distance) with cognitive scores, biomarker data (e.g., EC volume on MRI), and real-world navigation outcomes.
- Diagnostic Accuracy: Calculate the sensitivity, specificity, and area under the curve (AUC) of VR metrics for classifying MCI or preclinical AD.
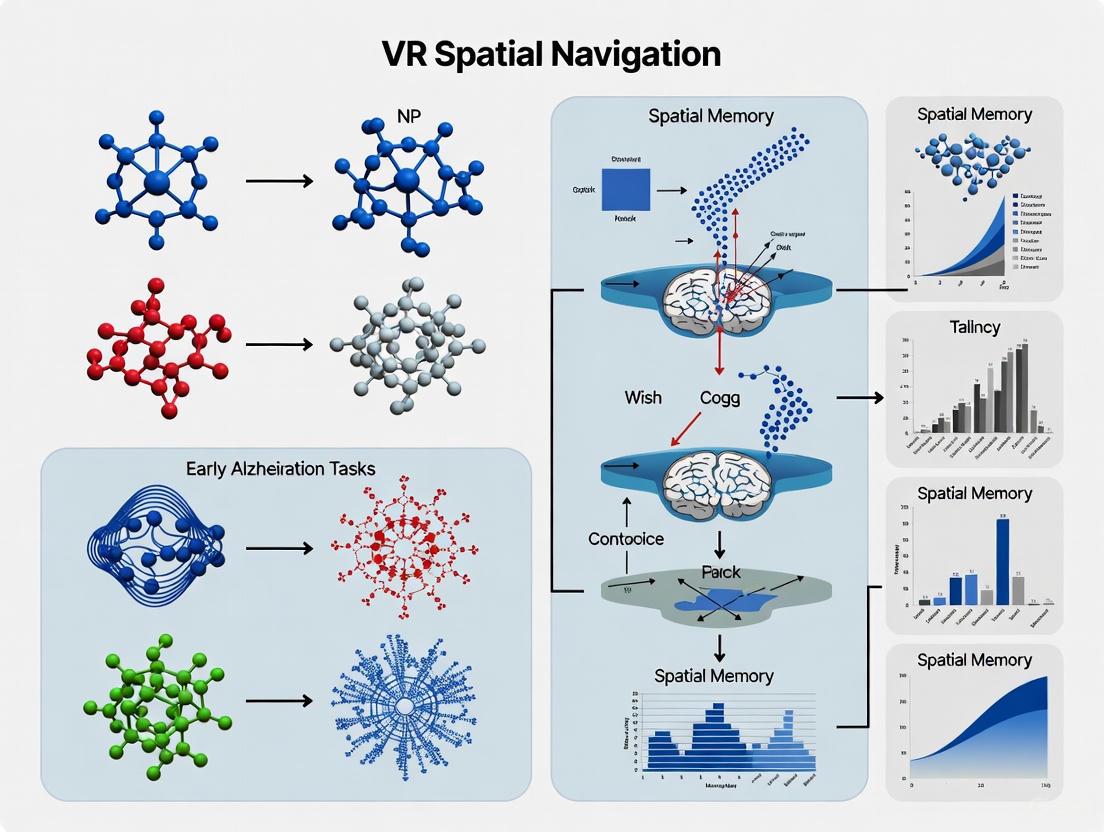
The workflow for implementing and validating these VR protocols is summarized below.
The Scientist's Toolkit: Research Reagent Solutions
Table 3: Essential Research Materials and Tools for EC-Centric AD Research
| Category / Item | Function/Application in EC Research | Specific Examples / Notes |
|---|---|---|
| Animal Models | Modeling Preclinical AD Pathophysiology: Recapitulate early tau/Aβ pathology and grid cell dysfunction originating in the EC. | - EC-Tau Mice: Express mutant human tau selectively in EC; show late-onset grid cell loss & neurodegeneration [1].- APP Knock-in Mice: Slow Aβ accumulation; show early (3 mo) grid cell dysfunction before memory loss [1]. |
| Behavioral Apparatus | Assessing EC-Dependent Spatial Navigation & Memory: Quantifying allocentric navigation deficits in rodent models. | - Active Place Avoidance (APA) Task: Rotating arena with fixed shock zone to test hippocampal/EC-dependent spatial memory [7].- Morris Water Maze (Virtual/Real): Standard test for spatial learning and memory. |
| VR Software Platforms | Assessing Human Spatial Navigation: Isolating and quantifying allocentric vs. egocentric strategy use for early biomarker development. | - Sea Hero Quest (SHQ): Game-based tool measuring allocentric wayfinding distance/duration [6].- Virtual Supermarket Test (VST): Assesses egocentric and allocentric map-based navigation [6]. |
| Neuroimaging & Analysis | In Vivo Biomarker Measurement: Quantifying EC structural integrity and functional activity in living humans. | - High-Resolution Structural MRI: Volumetric measurement of EC atrophy [4] [8].- fMRI: Detection of grid-cell-like signals and network activity [1] [9].- Anatomically Refined EC Segmentation: Deep learning pipelines (e.g., nnU-Net) for precise EC delineation on MRI, improving diagnostic sensitivity [8]. |
| Electrophysiology | Probing Network Dysfunction: Directly measuring grid cell activity and oscillatory rhythms in animal models. | - In Vivo Single-/Multi-unit Recording: Recording from MEC layer II neurons in behaving animals to quantify grid field properties [1].- Local Field Potential (LFP) Recording: Assessing theta/gamma oscillations in the EC-hippocampal circuit. |
Path integration (PI) is a fundamental navigational process that enables an individual to continuously track their position and orientation in space using self-motion cues such as vestibular, proprioceptive, and motor efference copy information [10]. This cognitive function is primarily supported by grid cells within the entorhinal cortex (EC), which create a neural coordinate system for spatial navigation [11]. The strategic importance of PI in Alzheimer's disease (AD) research stems from the vulnerability of the EC to early neurofibrillary tangle pathology, making PI deficits potentially one of the earliest detectable cognitive signs of AD [12] [13]. Recent advances in virtual reality (VR) technology have enabled the precise quantification of PI performance, establishing it as a promising digital biomarker for detecting preclinical AD stages, including subjective cognitive decline (SCD) and mild cognitive impairment (MCI) [10] [14]. This protocol outlines the application of VR-based PI assessment in AD research and drug development contexts.
Key Research Findings and Quantitative Data
Table 1: Correlations Between Path Integration Errors and Alzheimer's Disease Biomarkers
| Biomarker/Factor | Population Studied | Correlation with PI Errors | Statistical Significance | Citation |
|---|---|---|---|---|
| Plasma p-tau181 | 111 healthy adults | Significant positive correlation | t-value = 2.53, p = 0.0128 | [12] |
| Plasma GFAP | 111 healthy adults | Significant positive correlation | t-value = 2.16, p = 0.0332 | [12] |
| Tau-PET in MTL | 102 non-dementia participants | Rotation errors significantly increased | Associated with tau pathology | [13] |
| Age | 111 healthy adults | Significant positive correlation | Increased from ~50 years | [12] |
| SCD status | 102 older adults (30 SCD, 72 controls) | Significant increase in errors | Estimate = 0.257, SE = 0.065, p < 0.001 | [10] |
| APOE ε4 genotype | 111 healthy adults | Positive association | Coefficient = 0.650, p = 0.037 | [12] |
Table 2: Path Integration Performance Across Clinical Stages of Cognitive Decline
| Participant Group | PI Performance in Landmark-Free Environment | PI Performance with Landmark Cues | Key Error Pattern |
|---|---|---|---|
| Cognitively normal, amyloid-negative | Normal | Normal | Age-related distance errors |
| Preclinical AD (amyloid-positive, cognitively normal) | Impaired | Improved with landmarks | Increased rotation errors [13] |
| Subjective Cognitive Decline (SCD) | Impaired | Not reported | Driven by "memory leak" [10] [14] |
| Mild Cognitive Impairment (MCI) | Impaired | No improvement with landmarks | Both rotation and distance errors |
Experimental Protocols for VR-Based Path Integration Assessment
Head-Mounted Display VR Protocol for Pure Path Integration
Application: This protocol is designed to assess basic PI ability without landmark cues, specifically targeting entorhinal cortex function [12] [13].
Equipment Requirements:
- Meta Quest 2 or comparable HMD
- Custom VR software creating a circular arena (20 virtual meters diameter)
- Joystick controller for movement
- Stable tracking environment
Procedure:
- Participant Preparation: Secure HMD properly, ensure comfortable joystick operation, and administer simulator sickness questionnaire.
- Training Phase: Allow 5-10 minutes of free navigation in a practice environment with visible landmarks to acclimatize participants to VR controls.
- Testing Phase:
- Present participants with a featureless virtual environment (no distal cues)
- Participants follow a predetermined curved path to a stopping point
- At stopping point, participants indicate original starting position and orientation using a virtual pointer
- Multiple trials (typically 8-12) with varying path configurations
- Data Collection: Record linear and angular errors in returning to start position, path efficiency, and completion time.
Key Controls: Monitor and account for age, video game experience, and motion sickness susceptibility [12].
Landmark-Supported Path Integration Protocol
Application: Differentiates between pure PI deficits and landmark-supported navigation capabilities, helping isolate EC-specific dysfunction [13].
Procedure:
- Follow identical setup and training as pure PI protocol
- Testing Phase:
- Conduct trials in environments with distinctive landmarks
- Use identical paths to pure PI condition for direct comparison
- Measure accuracy in utilizing landmarks to correct navigation errors
- Data Analysis: Compare performance between landmark and no-landmark conditions to calculate landmark benefit score
Computational Modeling of PI Components
Application: Deconstructs PI errors into specific cognitive components using Bayesian modeling, particularly valuable for detecting specific deficits in SCD [10].
Procedure:
- Collect raw PI performance data using standard VR PI protocol
- Apply hierarchical Bayesian model that decomposes errors into:
- Memory leak (information decay from memory trace)
- Velocity gain (systematic underestimation/overestimation of velocity)
- Additive bias (consistent directional errors)
- Accumulating noise (random errors during integration)
- Reporting noise (motor response inaccuracies)
- Calculate posterior distributions for each parameter using Markov Chain Monte Carlo sampling
- Compare parameter distributions between clinical groups and controls
Signaling Pathways and Neural Mechanisms
Diagram 1: Neural pathway of path integration showing impact of Alzheimer's pathology.
Experimental Workflow for AD Diagnostic Application
Diagram 2: Integrated experimental workflow combining VR assessment and biomarker analysis.
The Scientist's Toolkit: Essential Research Materials
Table 3: Key Research Reagent Solutions for Path Integration Studies
| Item | Specification | Research Function | Example Application |
|---|---|---|---|
| Head-Mounted Display VR System | Meta Quest 2 or equivalent with 6DoF tracking | Presents immersive virtual environments and tracks head movement | Creates controlled testing environments without external cues [12] [15] |
| Path Integration Software | Custom VR applications with curved path paradigms | Presents navigation tasks and records performance metrics | Standardized assessment of PI abilities across research sites [10] [13] |
| Bayesian Modeling Framework | Hierarchical Bayesian models with parameters for error sources | Decomposes PI errors into cognitive components | Identifies "memory leak" as specific deficit in SCD [10] |
| AD Blood Biomarker Panels | Plasma p-tau181, p-tau217, GFAP, NfL, Aβ42/40 ratio | Provides molecular correlates of AD pathology | Validates PI deficits against established AD biomarkers [12] [16] |
| Tau-PET Imaging | [^18F]-MK-6240 or comparable tau tracers | Quantifies tau pathology in medial temporal lobe | Correlates rotation errors with entorhinal cortex tau burden [13] |
The integration of VR-based path integration assessment with modern AD biomarkers represents a powerful approach for detecting preclinical Alzheimer's disease. The protocols outlined here enable researchers to quantify subtle navigation deficits that emerge years before conventional cognitive symptoms. Particularly promising is the specific association between rotation errors and tau pathology in the entorhinal cortex, which aligns perfectly with the known neuropathological progression of AD [13]. For drug development professionals, these sensitive behavioral measures offer potential endpoints for clinical trials targeting early AD stages, possibly requiring smaller sample sizes or shorter trial durations than traditional cognitive measures. Future research directions should focus on standardizing these protocols across sites, establishing normative values across ages, and validating their predictive value for longitudinal cognitive decline.
Spatial Navigation Deficits as a Behavioral Proxy for Preclinical Neurofibrillary Tangle Accumulation
This application note details a novel, non-invasive methodology for detecting early Alzheimer's disease (AD) pathophysiology by quantifying spatial navigation deficits, specifically path integration (PI) errors, using immersive virtual reality (VR). The protocol is grounded in the established neuropathological sequence of AD, where neurofibrillary tangles (NFTs) initially accumulate in the entorhinal cortex (EC)—a brain region critical for spatial navigation and cognitive map formation [12] [17] [18]. The progressive deterioration of grid cells and place cells within the EC and hippocampal formation disrupts spatial coding, manifesting as measurable navigation deficits years before overt clinical symptoms emerge [17] [19].
The core innovation presented here is the combination of a 3D VR-based behavioral assay with plasma biomarkers to create a sensitive, combinatorial biomarker for preclinical AD. This approach addresses the critical need for accessible, cost-effective, and non-invasive diagnostic tools that can identify at-risk individuals during the prolonged preclinical phase, thereby enabling timely therapeutic interventions [12] [18] [19].
Alzheimer's disease is a continuum with a protracted preclinical phase that can span decades. The Braak staging system posits that NFTs, composed of hyperphosphorylated tau protein, first appear in the transentorhinal and entorhinal cortices [12] [18]. The EC houses grid cells, which are neurons that create a coordinate system for spatial navigation and are essential for path integration—the process of using self-motion cues to update one's position in space [12] [17].
Damage to this network, as occurs with early NFT pathology, directly impairs spatial navigation. Consequently, subtle deficits in navigation tasks serve as a functional readout of the underlying structural and molecular pathology in the EC [12] [17] [19]. While conventional biomarkers like amyloid-PET or CSF analysis are informative, they are invasive, expensive, and not universally available. Behavioral proxies like VR navigation offer a complementary, non-invasive strategy for initial screening and risk stratification [18] [19].
The following diagram illustrates the logical pathway linking AD pathology to the measurable behavioral proxy.
Quantitative Findings from Key Studies
Recent clinical studies have robustly correlated VR-navigation deficits with established biomarkers of AD. The key quantitative findings from a study of 111 healthy adults are summarized below [12] [18].
Table 1: Correlations Between Path Integration (PI) Errors and AD Biomarkers in Healthy Adults (N=111)
| Variable | Correlation with PI Errors | Statistical Significance (p-value) | Notes |
|---|---|---|---|
| Age | Positive Correlation | < 0.001* | PI errors increase with age, commencing around age 50. |
| Plasma GFAP | Positive Correlation | 0.0332* | Significant correlation in multivariate analysis. |
| Plasma p-tau181 | Positive Correlation | 0.0128* | Identified as the most significant predictor via machine learning. |
| Plasma NfL | Positive Correlation | Reported as significant | |
| ApoE ε4 Allele | Positive Association | 0.037* | Genetic risk factor linked to increased PI errors. |
| Entorhinal Cortex Thickness | Negative Correlation | Not significant after age adjustment | Correlation did not survive age correction in linear regression. |
Table 2: Predictor Importance for Path Integration Errors
| Predictor | Relative Importance | Key Statistic |
|---|---|---|
| Plasma p-tau181 | Highest | ROC analysis identified it as the top predictor [12]. |
| Plasma GFAP | High | t-value = 2.16 [12] [18]. |
| ApoE ε4 Genotype | Moderate | Coefficient = 0.650 [18]. |
Detailed Experimental Protocol
This section provides a step-by-step protocol for implementing the VR-based path integration task, as detailed by Shima et al. [12] [18].
Participant Selection and Criteria
- Recruitment: Recruit healthy adult participants (e.g., age range 22-79).
- Screening: Exclude individuals based on the following criteria:
- Inability to complete the task due to VR-induced sickness.
- Scores below standard cutoffs on cognitive screenings (e.g., MMSE < 26, ACE-R < 89).
- History of stroke, neurological, or psychiatric disorders.
- Incomplete data for core biomarkers or VR tasks.
- Final Cohort: The protocol described was validated on a final cohort of 111 participants [12] [18].
Equipment and Materials
Table 3: Research Reagent Solutions and Essential Materials
| Item | Specification / Example | Function / Rationale |
|---|---|---|
| VR Headset | Meta Quest 2 or equivalent | Provides an immersive, head-mounted 3D virtual reality experience. |
| Input Device | Joystick / Hand Controllers | Allows participants to control forward/backward movement and orientation. |
| VR Software | Custom-built 3D environment | Renders a virtual arena for navigation tasks; allows precise control of stimuli and data logging. |
| Biomarker Assays | Plasma kits for p-tau181, GFAP, NfL | Provides molecular correlates of AD pathology from blood samples. |
| Genetic Test | ApoE Genotyping | Identifies individuals with the primary genetic risk factor for AD. |
| MRI Scanner | 3 Tesla MRI | Measures structural correlates like entorhinal cortex thickness. |
Step-by-Step Procedure
The testing sequence for participants should be conducted in the following order on the same day: blood tests, cognitive assessments, VR-based PI evaluation, and MRI scanning [12] [18]. The workflow for the core VR experiment is detailed below.
1. VR Environment Setup:
- Create a virtual arena (e.g., 20-virtual-meter diameter) surrounded by walls, devoid of distal landmarks to force reliance on path integration [12].
- Ensure the environment is displayed via a head-mounted display that tracks head orientation.
2. Participant Habituation:
- Allow participants to freely move and navigate within the virtual arena using the joystick.
- This step is critical to minimize anxiety and acclimatize participants to the VR interface, reducing confounds from VR-induced sickness [12].
3. Path Integration Task:
- Task: A simple outbound-and-return trial.
- Outward Journey: The participant is guided along a predefined, multi-segment path (e.g., two legs forming a triangle) to a hidden target location. The target is not visibly marked.
- Return Journey: The participant is instructed to navigate directly back to the starting point using the most direct route, relying solely on self-motion cues (vestibular, proprioceptive) integrated during the outward journey [12] [18].
- Control: Lateral movements should be controlled by physically turning the head and body, not the joystick, to enhance ecological validity and engage vestibular processing [12].
4. Data Acquisition:
- The primary outcome measure is the PI error, defined as the Euclidean distance (in virtual meters) between the participant's final stopping position and the true, original starting point [12] [18].
- Log continuous positional data throughout the trial.
Data Analysis and Integration
- Statistical Analysis: Perform multivariate linear regression to assess the covariance of PI errors with biomarker levels (GFAP, p-tau181, NfL, etc.) and age.
- Machine Learning: Apply predictor importance ranking algorithms (e.g., random forest) and receiver operating characteristic (ROC) curves to identify the most potent predictors of navigation performance [12] [18].
- Multi-Modal Integration: Combine PI error data with plasma p-tau181 levels and ApoE status to create a composite biomarker with enhanced predictive power for early AD detection [12].
The integration of quantitative spatial navigation assessment via immersive VR with fluid biomarkers represents a transformative approach for identifying individuals in the preclinical stage of AD. The protocol outlined herein provides a validated, non-invasive method to detect functional deficits linked to the earliest sites of NFT pathology.
Future directions should focus on the standardization of VR paradigms across research sites, longitudinal validation of these digital biomarkers, and the integration of artificial intelligence to refine predictive models. This combinatorial approach holds significant promise for enriching clinical trial cohorts and advancing the development of early therapeutic interventions [12] [18] [19].
Distinguishing Egocentric vs. Allocentric Navigation Deficits in Aging and MCI
Quantitative Data Synthesis
The following tables synthesize key quantitative findings from recent studies on egocentric and allocentric navigation deficits, providing a consolidated resource for researchers.
Table 1: Diagnostic Accuracy of Spatial Navigation Strategies in Alzheimer's Disease Continuum [20]
| Navigation Strategy | Sensitivity | Specificity | Diagnostic Odds Ratio Profile |
|---|---|---|---|
| Allocentric (World-Centered) | 84% | 83% | Balanced detection of AD cases and healthy controls |
| Egocentric (Body-Centered) | 72% | 81% | Limited sensitivity, better specificity |
| Frame-Switching | 84% | 66% | High AD detection but more false positives |
| Combined Egocentric-Allocentric | - | 94% | Highest specificity for confirming AD |
Table 2: Correlations Between Path Integration Errors and Plasma Biomarkers in Healthy Adults (n=111) [12] [18]
| Biomarker / Factor | Correlation with PI Errors | Statistical Significance (p-value) | Multivariate Analysis Result |
|---|---|---|---|
| Plasma p-tau181 | Significant Positive Correlation | p = 0.0128 | Most significant predictor of PI errors via machine learning |
| Plasma GFAP | Significant Positive Correlation | p = 0.0332 | Significant independent correlation with PI errors |
| Plasma NfL | Significant Positive Correlation | < 0.05 | Significant univariate correlation |
| Age | Significant Positive Correlation | < 0.001 | Strong positive association |
| ApoE ε4 Genotype | Positive Association | p = 0.037 | Coefficient = 0.650 |
| Entorhinal Cortex Thickness | Negative Correlation | Not significant after age adjustment | Age-confounded effect |
Experimental Protocols
Protocol 1: VR-Based Path Integration and Allocentric Task
This protocol details the assessment of path integration (egocentric) and landmark-based allocentric navigation using an immersive head-mounted display (HMD) system [12] [18] [21].
2.1.1 Materials and Equipment
- Head-Mounted Display (HMD): Meta Quest 2 or 3 for immersive VR experience [12] [21].
- Software Platform: Unity Game Engine for task development, ensuring accessibility and open-source potential [21].
- Virtual Environment: A 20-virtual meter (vm) diameter arena surrounded by 3 vm high walls, containing distal landmarks (e.g., lighthouse, cabin, mountains) [12] [21].
- Response Interface: Joystick for movement control and in-game pointer for location judgments [12] [21].
2.1.2 Step-by-Step Procedure
- Participant Preparation and Tutorial
Path Integration (Egocentric) Task
- Position participant in a hallway with obscured external landmarks (e.g., using fog) [21].
- Instruct participant to navigate down the hallway using the joystick, relying solely on self-motion cues (vestibular and proprioceptive inputs) [12].
- At the end of the trajectory, prompt participant to point toward the remembered start location using the in-game pointer [21].
- Record the angular and distance error between the pointed location and the actual start location as the egocentric navigation error [12].
Allocentric Spatial Memory Task
Task Variations and Parameters
2.1.3 Data Analysis
- Primary Metrics:
- Statistical Analysis: Perform multivariate linear regression to assess relationships between navigation errors and biomarkers (e.g., plasma p-tau181, GFAP), controlling for age and other covariates [12] [18].
Protocol 2: VR Contextual Threat Learning and Spatial Mapping
This protocol uses a non-immersive VR paradigm to assess how spatial mapping supports contextual threat learning, which is often impaired in MCI and AD [22].
2.2.1 Materials and Equipment
- VR System: Desktop-based (non-immersive) or HMD-based VR system [22].
- Virtual Environment: A circular environment containing distal (clouds, sun, mountains) and local (beehives) cues, divided into distinct safe and dangerous zones [22].
- Physiological Recording: Galvanic skin response (GSR) apparatus to measure skin conductance response (SCR) as an index of threat conditioning [22].
- Questionnaires: State-Trait Anxiety Inventory (STAI) Forms Y-1 and Y-2 [22].
2.2.2 Step-by-Step Procedure
- Pre-Task Assessment
- Administer STAI questionnaires to assess baseline state and trait anxiety levels [22].
Conditioning Phase
- Instruct participant to freely navigate the virtual environment and "pick" flowers that appear randomly.
- Apply a mild electric shock (or other aversive stimulus) with a predetermined probability (35%, 50%, or 60%) when flowers are picked in the dangerous zone. No shocks are administered in the safe zone [22].
- Conduct multiple trials (e.g., 16 conditioning trials interspersed with spatial memory trials) [22].
Spatial Memory Task Interleaving
- After every 4 conditioning trials, administer a spatial memory trial.
- Present four neutral objects in different environmental quadrants.
- In the first 4 trials, participants collect objects from their original locations.
- Over subsequent trials (e.g., 16), participants are asked to return each object to its original location, with feedback provided after each placement [22].
- Record the object placement distance error from the original location [22].
Post-Task Assessment and Debriefing
- Re-administer the STAI Form Y-1 to measure post-task state anxiety [22].
- Ask participants to verbally identify the dangerous and safe zones to categorize them as "learners" or "non-learners" based on correct identification [22].
- Test recall of object names and locations from the spatial memory task [22].
2.2.3 Data Analysis
- Primary Metrics:
- Learning Categorization: Percentage of participants correctly identifying both zones.
- Spatial Memory Performance: Mean object placement distance error for learners vs. non-learners.
- Physiological Threat Response: Difference in SCR between dangerous and safe zones.
- Anxiety Correlation: Comparison of state and trait anxiety scores between learners and non-learners [22].
The Scientist's Toolkit: Research Reagent Solutions
Table 3: Essential Materials and Reagents for VR Navigation and Biomarker Studies
| Item | Function/Application in Research | Specific Examples/Models |
|---|---|---|
| Immersive VR Headset | Creates immersive 3D environments for naturalistic navigation assessment. | Meta Quest 2, Meta Quest 3 [12] [21] |
| Game Development Software | Platform for building and customizing VR navigation tasks; enables open-source tool development. | Unity Game Engine [21] |
| Biomarker Assay Kits | Quantifies plasma biomarkers for correlational analysis with navigation performance. | Kits for p-tau181, GFAP, NfL, Aβ40, Aβ42 [12] [18] |
| 3T MRI Scanner | Provides high-resolution structural imaging for measuring brain volume (e.g., entorhinal cortex thickness). | 3T clinical MRI scanner [12] [18] |
| ApoE Genotyping Kit | Determines genetic risk factor (ApoE ε4 status) for Alzheimer's disease. | Commercially available genotyping kits [12] [18] |
| Galvanic Skin Response Apparatus | Measures skin conductance response (SCR) as a physiological index of threat learning in conditioning paradigms. | Biopac Systems, ADInstruments [22] |
| Standardized Cognitive Batteries | Assesses general cognitive status and excludes dementia; used for participant screening. | MMSE, ACE-R, MoCA-J [12] [18] |
Visual Workflows and Neural Circuitry
The following diagrams illustrate the experimental workflow for assessing navigation deficits and the underlying neural circuitry vulnerable in early Alzheimer's disease.
Experimental Workflow for Navigation Deficit Assessment
Neural Circuitry of Spatial Navigation
Correlating Navigation Errors with Braak Staging in the Preclinical Disease Continuum
The preclinical detection of Alzheimer's disease (AD) represents a critical challenge in developing effective therapeutic interventions. Spatial navigation impairment, particularly in path integration, has emerged as a promising cognitive marker that may precede overt memory complaints and correlate with the underlying neuropathological progression of AD, as defined by the Braak staging framework [23] [24]. This protocol details methodologies for correlating specific navigation error types with in vivo Braak staging using tau-PET imaging, providing researchers with standardized approaches for identifying individuals in the preclinical AD continuum.
The entorhinal cortex (EC), containing grid cells essential for spatial mapping and navigation, constitutes the initial site for neurofibrillary tangle (NFT) development in Braak stages I-II [18] [24]. As tau pathology progresses through the medial temporal lobe (MTL) to posterior cortical regions (Braak stages III-IV), corresponding deficits emerge in different navigation domains [23] [25]. Virtual reality (VR) navigation tasks sensitive to these early pathological changes offer non-invasive, cost-effective methods for large-scale screening and monitoring of at-risk populations.
Theoretical Framework and Key Findings
Braak Staging and Spatial Navigation Systems
AD pathology follows a predictable progression pattern with tau pathology first emerging in the transentorhinal cortex (Braak stage I), spreading to the posteromedial entorhinal cortex and hippocampus (Braak stages II-III), then to posterior cortical regions (Braak stage IV) in early clinical stages, and finally to the entire neocortex (Braak stages V-VI) in dementia [23]. This pathological progression parallels the neural circuitry supporting distinct navigation strategies:
- Path Integration: Supported by grid cells in the entorhinal cortex, enabling calculation of current position by continuously updating self-motion cues [18] [24]
- Wayfinding (Allocentric Navigation): Supported by the hippocampus and posterior MTL structures, creating cognitive maps of the environment [23]
- Route Learning (Egocentric Navigation): Supported by the posterior parietal cortex, precuneus, and caudate nucleus [23]
Key Quantitative Correlations
Recent studies have established specific correlations between navigation error types and AD biomarkers across the preclinical continuum. The table below summarizes key quantitative findings from recent research.
Table 1: Correlation Between Navigation Errors and AD Biomarkers in Preclinical Disease
| Navigation Error Type | Associated Biomarker | Correlation Strength | Braak Stage Association | Research Evidence |
|---|---|---|---|---|
| Rotation Errors | Tau-PET in MTL | Significant association (p<0.05) | Braak I-III | [24] |
| Path Integration Errors | Plasma p-tau181 | Significant predictor (p=0.0128) | Braak I-II | [18] |
| Wayfinding Deficits | CSF Aβ42 & p-tau181 | Significant association (p<0.05) | Braak III-IV | [23] |
| Route Learning Deficits | CSF Aβ42 | Significant association (p<0.001) | Braak IV | [23] |
| Allocentric Navigation Deficits | Posterior MTL volume | Significant correlation (p<0.01) | Braak III-IV | [23] |
Table 2: Navigation Performance Across Clinical Stages of AD
| Clinical Stage | Path Integration (Pure) | Path Integration (Landmark) | Wayfinding | Route Learning |
|---|---|---|---|---|
| Clinically Normal (Aβ-) | Normal | Normal | Normal | Normal |
| Preclinical AD (Aβ+) | Impaired | Normal | Mildly Impaired | Normal |
| Mild Cognitive Impairment | Severely Impaired | Impaired | Impaired | Impaired |
| AD Dementia | Severely Impaired | Severely Impaired | Severely Impaired | Severely Impaired |
Experimental Protocols
Path Integration Assessment with Virtual Reality
Purpose: To detect early grid cell dysfunction in preclinical AD by quantifying rotation and distance errors during path integration.
Equipment:
- Head-mounted 3D VR system with motion tracking
- "Apple Game" or similar visual path integration software [24]
- Data recording system with timestamp capability
Procedure:
- Participant Preparation: Secure head-mounted display and ensure proper fit. Verify comfortable field of view and absence of visual obstructions.
- Task Instruction: "You will be placed in a virtual environment without landmarks. Your task is to remember the starting position and return to it after passive displacement."
- Pure Path Integration (PPI) Trial:
- Participant views starting point with a visible target
- Screen blanks during passive displacement along two legs of a triangle with a turn angle between 30° and 150°
- Participant uses joystick to return to remembered starting position
- 8 trials with varying turn angles and distances
- Landmark-Supported Path Integration (LPI) Trial:
- Identical to PPI but with a visible landmark throughout displacement
- 8 trials with identical parameters to PPI trials
- Data Collection:
- Record rotation error (angular deviation from correct return direction)
- Record distance error (absolute distance from correct starting position)
- Record trial completion time
Analysis:
- Calculate mean rotation and distance errors for PPI and LPI conditions
- Compute landmark benefit score: (PPI error - LPI error) / PPI error
- Perform regression analysis with tau-PET signal in MTL subregions
Allocentric vs. Egocentric Navigation Assessment
Purpose: To differentiate navigation strategy deficits associated with posterior MTL (Braak III-IV) versus parietal (Braak IV) pathology.
Equipment:
- Non-immersive VR navigation software (e.g., Virtual Supermarket Test, Sea Hero Quest) [23] [6]
- Tablet computer or desktop computer with joystick
- Response recording system
Procedure:
- Allocentric Navigation (Wayfinding) Task:
- Participant studies map of virtual environment for 2 minutes
- Map removed, participant navigates to remembered locations from different starting points
- Measure: Path efficiency, distance traveled, success rate
- Egocentric Navigation (Route Learning) Task:
- Participant follows predetermined route through virtual environment
- Immediately after, recreates the same route from same starting point
- Measure: Number of correct turns, sequence errors, distance accuracy
- Perspective Taking/Wayfinding Task:
- Participant learns location of objects in virtual environment
- Tested on ability to identify correct environment from shifted viewpoints
- Measure: Accuracy, reaction time
Analysis:
- Compare allocentric versus egocentric performance ratios
- Correlate allocentric deficits with posterior MTL volume
- Correlate egocentric deficits with parietal thickness and CSF Aβ42
Biomarker Assessment and Braak Staging
Purpose: To establish correlation between navigation errors and in vivo Braak staging using tau-PET.
Equipment:
- Tau-PET scanner with [18F]-MK-6240 or [18F]-flortaucipir tracers [26] [24]
- Structural MRI scanner (3T recommended)
- CSF collection kit for Aβ42, t-tau, p-tau181 analysis
Procedure:
- Tau-PET Acquisition:
- Administer [18F]-MK-6240 tracer (target dose: 185 MBq)
- Acquire static PET images 90-110 minutes post-injection
- Reconstruct images using standardized processing pipeline
- Braak Staging Implementation:
- Process tau-PET data with standardized preprocessing
- Calculate SUVR values using inferior cerebellar gray reference region
- Apply Braak region of interest (ROI) definitions:
- Braak I-II: Transentorhinal/entorhinal cortex
- Braak III-IV: Hippocampus, limbic regions
- Braak V-VI: Neocortical regions
- Define tau positivity using established thresholds (e.g., SUVR >1.24 for [18F]-MK6240) [26]
- CSF Biomarker Analysis:
- Collect CSF via lumbar puncture
- Measure Aβ42, t-tau, p-tau181 using ELISA or similar assays
- Define amyloid positivity using established cutoffs
Analysis:
- Calculate global and regional tau burden
- Assign participants to PET-based Braak stages
- Perform multivariate regression between navigation errors and regional tau burden
Visualization of Neuroanatomical Correlations
The following diagram illustrates the relationship between Braak staging progression and the corresponding navigation deficits.
Diagram Title: Relationship Between Braak Staging and Navigation Deficits
The Scientist's Toolkit: Research Reagent Solutions
Table 3: Essential Research Materials and Their Applications
| Reagent/Resource | Function/Application | Example Specifications |
|---|---|---|
| [18F]-MK-6240 Tau PET Tracer | In vivo detection and quantification of neurofibrillary tangles | Dose: 185 MBq; Imaging: 90-110 min post-injection [24] |
| [18F]-AZD4694 Amyloid PET Tracer | Assessment of cerebral amyloid deposition | SUVR threshold: >1.55 for positivity [26] |
| Head-Mounted VR Display | Immersive spatial navigation assessment | 3D capability, motion tracking, minimum 90° field of view [18] |
| Path Integration Software | Quantification of rotation and distance errors | "Apple Game" paradigm, PPI and LPI conditions [24] |
| Virtual Navigation Test Battery | Assessment of allocentric/egocentric strategies | Virtual Supermarket Test, Sea Hero Quest [23] [6] |
| CSF Immunoassay Kits | Measurement of Aβ42, t-tau, p-tau181 | ELISA-based, established cutoffs for amyloid positivity [23] [24] |
| APOE Genotyping Kit | Genetic risk stratification | Detection of ε2, ε3, ε4 alleles [24] |
| FreeSurfer Software Suite | Structural MRI segmentation and volumetric analysis | Version 7.2+, automated MTL subregion segmentation [24] |
Data Analysis and Interpretation Guidelines
Statistical Approaches
- Primary Analysis: Multivariate linear regression models predicting navigation errors from regional tau-PET SUVR values, adjusting for age, gender, education, and video game experience [24]
- Secondary Analysis: Receiver operating characteristic (ROC) analysis to determine optimal navigation error cutpoints for identifying preclinical AD
- Longitudinal Analysis: Linear mixed-effects models to assess change in navigation performance relative to tau accumulation
Interpretation Criteria
- Preclinical AD Signature: Significant rotation errors in PPI condition with preserved LPI performance, coupled with elevated MTL tau-PET signal (Braak I-II) [24]
- Early MCI Signature: Combined PPI and wayfinding deficits with tau-PET signal extending to hippocampus (Braak III-IV) [23]
- Advanced MCI Signature: Additional route learning deficits with parietal atrophy and neocortical tau spread (Braak V-VI) [23]
Quality Control Measures
- VR Task Validation: Ensure test-retest reliability >0.8 in control population
- PET Data Quality: Monitor injected dose, specific activity, and motion artifacts
- Blinded Assessment: Maintain blinding of navigation scorers to biomarker status
- Data Sharing: Adhere to standardized data formats for cross-study comparisons
The correlation between specific navigation error types and PET-based Braak staging provides a sensitive framework for detecting and monitoring preclinical AD. Rotation errors in path integration tasks specifically reflect early tau pathology in the entorhinal cortex, while subsequent allocentric and egocentric deficits track disease progression through the MTL and neocortex. The standardized protocols outlined in this document enable consistent implementation across research sites, facilitating the use of VR navigation assessment as a sensitive cognitive biomarker in clinical trials targeting preclinical AD populations.
Implementing VR Navigation Protocols in Clinical Research and Trial Settings
Virtual reality (VR) technology has emerged as a powerful tool for the early detection of Alzheimer's disease (AD), offering immersive, ecologically valid assessments of spatial navigation and memory that are among the first cognitive functions to decline in AD pathophysiology. The entorhinal cortex, where Alzheimer's neurofibrillary tangles originate, contains grid cells that perform spatial mapping and navigation capabilities through path integration [12]. This neurobiological link makes VR-based navigation tasks particularly sensitive to early AD-related changes. Current VR platforms for AD research leverage commercially available hardware like the Meta Quest 2 alongside professional game engines such as Unity and Unreal Engine, creating controlled, replicable environments that simulate real-world navigation challenges while capturing rich digital behavioral data [12] [27] [28]. These platforms overcome limitations of traditional pencil-and-paper cognitive tests by providing more engaging, ecologically valid assessments that can detect subtle deficits in spatial navigation and memory before obvious clinical symptoms emerge [27] [28]. The hierarchical application of 3D VR path integration assessment with plasma p-tau181 biomarkers shows particular promise as a combinatorial approach for early AD neurodegeneration detection [12].
Hardware Platforms: From Consumer HMDs to Research Systems
Consumer-Grade VR Systems
Meta Quest 2 has been successfully implemented in AD research for assessing path integration (PI) abilities. This standalone head-mounted display (HMD) features integrated movement tracking and controller input, allowing participants to navigate virtual environments using a joystick while the system captures navigation performance metrics [12]. In recent studies, researchers have utilized the Meta Quest 2 to create a 20-virtual meter diameter arena where participants perform navigation tasks, with the system quantifying PI errors that correlate with established AD biomarkers including plasma GFAP and p-tau181 levels [12]. The wireless nature of the Meta Quest 2 provides greater freedom of movement and reduces setup complexity compared to tethered systems, making it suitable for clinical and research settings.
Research-Grade VR Systems
HTC Vive Pro Eye offers enhanced tracking capabilities and integrated eye-tracking sensors, providing additional metrics for cognitive assessment. This system features a resolution of 2880 × 1600 pixels, a 98-degree field of view, 90 Hz refresh rate, and eye-tracking accuracy of 0.5°–1.1° [29]. The embedded eye-tracking technology uses the HTC SRanipal SDK to capture filtered gaze data at 90 Hz, enabling researchers to document which virtual objects participants are viewing during tasks [29]. The HTC Vive systems typically employ lighthouse laser-based tracking that generates reference points for photosensor-attached headsets and controllers, precisely locating their positions in space as users navigate virtual environments and interact with objects [27]. For research requiring maximum graphical fidelity, these systems can be operated in PC-VR mode connected to high-performance workstations with specialized GPUs.
Table 1: Key Hardware Platforms for VR-Based Alzheimer's Research
| Hardware Platform | Key Specifications | Research Applications | Notable Advantages |
|---|---|---|---|
| Meta Quest 2 | Standalone HMD, joystick controllers, inside-out tracking | Path integration assessment, spatial navigation tasks | Wireless operation, accessible pricing, easy setup |
| HTC Vive Pro Eye | 2880×1600 resolution, 90Hz refresh, eye-tracking (0.5°–1.1° accuracy) | Visual attention studies, complex navigation tasks | Precision tracking, rich gaze data, research-grade sensors |
| HTC Vive (Standard) | Lighthouse tracking, 110° FOV, motion controllers | Hidden object tests, virtual Morris water maze | Mature ecosystem, high tracking accuracy, modular |
| PC-VR Systems | GPU-enhanced workstations (e.g., NVIDIA RTX 3080), tethered HMDs | High-fidelity visual environments, complex scenes | Maximum graphical performance, handling of large datasets |
Software Platforms and Game Engines
Unity Game Engine
The Unity engine provides a comprehensive development environment for creating VR-based cognitive assessments. Researchers have utilized Unity to develop sophisticated virtual environments such as the Hidden Objects Test (HOT), which simulates a photorealistic living room where participants must locate household items placed in various locations [27]. Unity's flexibility enables the creation of 360-degree panoramic environments with interactive elements, supporting the implementation of complex scoring systems that evaluate prospective memory, item free-recall, place free-recall, item recognition, and place-item matching [27]. The engine's support for C# scripting allows researchers to implement custom trial logic, data collection mechanisms, and performance metrics specific to cognitive assessment. Unity's XR Foundation toolkit provides standardized APIs for implementing VR interactions across different hardware platforms, facilitating the development of research applications that can run on multiple HMD systems with minimal modification.
Unreal Engine
Unreal Engine offers high-fidelity graphics capabilities and a robust VR development framework that has been employed in construction safety research with potential applications to AD assessment. Unreal Engine's Blueprint visual scripting system enables researchers without extensive programming background to prototype and implement virtual environments more accessible [29]. The engine's sophisticated material and lighting systems allow for the creation of highly realistic environments that enhance ecological validity, potentially increasing the translational value of cognitive assessments. Unreal Engine's native support for the OpenXR standard ensures compatibility with a wide range of VR hardware, while its performance optimization features enable the creation of complex virtual environments that maintain stable frame rates essential for preventing VR-induced sickness in vulnerable populations [29].
Table 2: Software Platforms for VR Alzheimer's Research
| Software Platform | Development Features | Research Implementation | Technical Advantages |
|---|---|---|---|
| Unity Engine | C# scripting, XR Interaction Toolkit, customizable UI | Hidden Objects Test, path integration tasks | Cross-platform support, extensive documentation, asset store |
| Unreal Engine | Blueprint visual scripting, high-fidelity graphics, OpenXR | Complex environment simulation, realistic rendering | Superior graphics, material editor, cinematic quality |
| Godot Engine | OpenXR support, open-source, lightweight architecture | Scientific visualization (ASCRIBE-XR), data exploration | No royalty fees, growing plugin ecosystem, flexible |
| Custom SDKs | Hardware-specific APIs (e.g., VIVE SRanipal, Oculus Integration) | Eye-tracking integration, performance optimization | Direct hardware access, vendor-supported, optimized performance |
Experimental Protocols for VR-Based Alzheimer's Assessment
Path Integration Assessment Protocol
The Path Integration (PI) assessment protocol evaluates a participant's ability to calculate their current position by continuously updating head orientation and movement over time using self-motion cues, independent of external landmarks [12]. This protocol specifically targets the entorhinal cortex function, making it particularly relevant for early AD detection.
Implementation Methodology:
- Environment Setup: Create a 20-virtual meter diameter circular arena surrounded by 3 vm-height walls using Unity or Unreal Engine [12].
- Hardware Configuration: Configure Meta Quest 2 HMD with joystick controller input. Ensure proper fit and comfort to minimize motion sickness.
- Participant Familiarization: Allow 5-10 minutes of free movement within a practice arena containing obstacles to acclimatize participants to VR navigation.
- Task Administration: Present a series of navigation trials where participants must return to their starting position after being guided along a circuitous path without landmark cues.
- Data Collection: Record continuous position data, head orientation, movement trajectory, and timing metrics. Calculate PI error as the distance between the actual and participant-estimated starting position.
- Performance Metrics: Quantify absolute error distance, angular error, and trial completion time across multiple trials.
This protocol typically requires 20-30 minutes to administer and has demonstrated significant correlations with plasma p-tau181 levels and other AD biomarkers in healthy adults [12].
Hidden Objects Test (HOT) Protocol
The Hidden Objects Test assesses visuospatial memory by requiring participants to memorize and locate common household objects hidden in a virtual living room environment [27].
Implementation Methodology:
- Environment Design: Create a photorealistic virtual living room divided into nine sections with five spaces configured to hide 1-2 items each [27].
- Stimulus Selection: Select nine household items from categories including tools/electronics, foods, wearable items, and other common household objects.
- Task Structure:
- Prospective Memory Task (3 points): Participants must remember to execute three directions at the end of the test.
- Item Free-Recall (9 points): Participants recall the identities of hidden objects.
- Place Free-Recall (9 points): Participants recall the locations of hidden objects.
- Item Recognition (9 points): Participants recognize previously hidden objects from distractors.
- Place-Item Matching (9 points): Participants correctly match objects to their locations.
- Scoring: Calculate total score (maximum 39 points) and individual subtest scores.
- Path Analysis: Track participant movement trajectories, including total distance traveled, duration, speed, number of outliers from optimal path, and stay points (positions where participants remain for >2 seconds) [27].
The HOT successfully differentiates between Alzheimer's disease, amnestic mild cognitive impairment, and normal controls, with patients showing significantly more wandering behavior rather than direct paths to hidden objects [27].
Integrated Biomarker Correlation Protocol
The Integrated Biomarker Correlation Protocol combines VR navigation assessment with biomarker collection to establish clinically relevant correlations.
Implementation Methodology:
- Participant Screening: Recruit healthy adults (typically aged 22-79) with normal cognitive scores (MMSE ≥26, ACE-R ≥89) [12].
- Biomarker Collection: Collect blood samples for plasma biomarkers (GFAP, NfL, Aβ40, Aβ42, p-tau181) and ApoE genotyping.
- Assessment Sequence: Conduct testing in the following order on the same day: blood tests, cognitive assessments, VR-based PI evaluation, and MRI scanning [12].
- Data Integration: Perform multivariate linear regression, logistic regression, and machine learning-based predictor importance ranking to identify relationships between PI errors and biomarker levels.
- Validation: Establish diagnostic accuracy through receiver operating characteristic curves and determine optimal cutoff values for clinical screening.
This integrated approach has demonstrated that plasma p-tau181 is the most significant predictor of path integration errors, supporting the combinatorial use of 3D VR navigation and plasma biomarkers for early AD detection [12].
Quantitative Findings and Research Validation
VR-based spatial navigation assessments have demonstrated significant correlations with established Alzheimer's disease biomarkers and shown strong discriminatory power between diagnostic groups.
Table 3: Quantitative Findings from VR Alzheimer's Detection Studies
| Assessment Type | Population | Key Quantitative Findings | Correlation with Biomarkers |
|---|---|---|---|
| Path Integration (PI) | 111 healthy adults (22-79 years) | PI errors significantly increase with age (p<0.05) | Positive correlation with plasma GFAP (t=2.16, p=0.033) and p-tau181 (t=2.53, p=0.013) [12] |
| Hidden Objects Test (HOT) | 17 AD, 14 aMCI, 15 NC | Total HOT score significantly differs among groups (p<0.001) | N/A (clinical diagnosis as reference) [27] |
| Walking Trajectory Analysis | 17 AD, 14 aMCI, 15 NC | Number of stay points significantly higher in AD vs NC (p=0.003) and aMCI vs NC (p=0.019) [27] | N/A (clinical diagnosis as reference) |
| VR Morris Water Maze | AD, MCI, controls | Effective transfer between real and VR environments (p<0.05) [28] | N/A (established paradigm validation) |
The Scientist's Toolkit: Essential Research Reagents and Materials
Table 4: Essential Research Materials for VR Alzheimer's Studies
| Research Reagent | Specification/Model | Function in Research | Implementation Notes |
|---|---|---|---|
| Head-Mounted Display | Meta Quest 2 or HTC Vive Pro Eye | Presents immersive virtual environments, tracks head movement | Choose standalone (Quest) for flexibility or PC-tethered (Vive) for advanced features |
| VR Development Engine | Unity 2022.3+ or Unreal Engine 5.1+ | Creates controlled, replicable virtual environments | Unity offers easier prototyping; Unreal provides higher visual fidelity |
| Eye-Tracking System | HTC SRanipal SDK or integrated eye-tracking | Captures visual attention patterns, fixation duration | Essential for assessing visual search strategies in cognitive tasks |
| Spatial Navigation Task | Custom path integration or Hidden Objects Test | Assesses entorhinal cortex and hippocampal function | Select based on target population (PI for preclinical, HOT for clinical) |
| Biomarker Assay Kits | Plasma p-tau181, GFAP, NfL measurements | Provides pathological correlation for VR findings | Critical for validating VR measures against established AD biomarkers |
| Data Analysis Pipeline | Python/R with custom VR analytics | Processes movement trajectories, performance metrics | Should include path analysis, performance scoring, and statistical correlation |
The integration of consumer VR hardware like Meta Quest with professional game engines such as Unity and Unreal Engine has created powerful, accessible platforms for detecting early Alzheimer's disease through spatial navigation assessment. These technologies enable the development of ecologically valid cognitive tests that closely mimic real-world navigation challenges while providing precise quantitative metrics of performance. The correlation between path integration errors measured by VR systems and established AD biomarkers like plasma p-tau181 demonstrates the clinical relevance of these digital assessment tools. As VR hardware continues to evolve with enhanced resolution, tracking accuracy, and comfort, and as game engines become more sophisticated in their simulation capabilities, VR-based cognitive assessment promises to become an increasingly valuable component of early AD detection protocols in both research and clinical settings. The hierarchical application of 3D VR spatial navigation assessment followed by plasma biomarker testing represents a particularly promising approach for scalable, non-invasive early detection of Alzheimer's disease pathophysiology.
Spatial memory, the cognitive function that enables individuals to encode, store, and retrieve information about their surroundings and spatial relationships, has emerged as a crucial domain for early detection of Alzheimer's disease (AD) [30]. This capacity supports navigation and wayfinding abilities that are essential for daily independence yet frequently deteriorate in the preclinical stages of neurodegenerative conditions [31]. Traditional assessment methods, including paper-and-pencil tests and laboratory paradigms, often lack ecological validity and fail to capture the complexities of real-world navigation [30]. Immersive Virtual Reality (VR) and Mixed Reality (MR) technologies now enable the creation of controlled, replicable environments that simulate real-world navigation with high precision while maintaining experimental control [31] [30].
The diagnostic significance of spatial memory assessment lies in its neural substrates. Path integration and landmark-based navigation engage brain regions—including the hippocampus, entorhinal cortex, and parahippocampal cortex—that are among the earliest affected by Alzheimer's pathology [31] [30]. These technologies show particular promise for identifying individuals at risk for neurodegenerative diseases before significant cognitive decline becomes apparent [32]. VR-based assessments can detect subtle spatial disorientation in populations with Mild Cognitive Impairment (MCI) more sensitively than traditional paper-and-pencil tests [31], offering a powerful tool for preclinical detection.
Table: Key Spatial Memory Processes and Their Neural Correlates
| Spatial Process | Definition | Primary Neural Substrates | Relevance to AD Detection |
|---|---|---|---|
| Path Integration | Egocentric navigation using self-motion cues to update position continuously [30] | Posterior parietal cortex, precuneus [30] | Highly sensitive to early AD pathology in parietal regions |
| Landmark-Based Navigation | Allocentric navigation using external landmarks for orientation [30] | Hippocampus, parahippocampal cortex, retrosplenial cortex [30] | Engages hippocampus, one of the first regions affected by AD |
| Cognitive Mapping | Mental representation of environment enabling alternative route planning [30] | Hippocampus (place cells), entorhinal cortex (grid cells) [30] | Compromised in early AD, affecting navigational flexibility |
| Object-Location Memory | Recall of spatial relationships between objects and reference points [30] | Hippocampus, parahippocampal cortex [30] | Shows decline in MCI and preclinical AD stages |
Theoretical Foundations and Neural Mechanisms
Reference Frames in Spatial Memory
Spatial memory operates through two primary reference frames that organize spatial information. Egocentric representations encode spatial information in relation to the agent's own body, utilizing sensory and motor properties to coordinate perception with movement [30]. This body-centered framework is particularly effective in small-scale, peripersonal space and supports immediate action and interaction with the environment [30]. In contrast, allocentric representations define spatial information based on external landmarks or environmental boundaries, independent of the observer's position [30]. This world-centered framework plays a crucial role in large-scale, extrapersonal space and long-term spatial planning, creating map-like mental representations of environments [30].
The distinction between these reference frames is critical for understanding early Alzheimer's detection. Allocentric navigation depends heavily on hippocampal function and is often impaired in the early stages of AD, while egocentric navigation relies more on posterior parietal regions and may remain relatively preserved until later disease stages [30]. Efficient navigation typically requires the integration of both egocentric and allocentric representations, enabling dynamic updates in spatial orientation and switching between reference frames as needed [30]. The posterior parietal cortex, particularly area 7a, plays a crucial role in this transformation by integrating visual and proprioceptive information [30].
Neural Substrates of Spatial Navigation
The neural circuitry underlying spatial memory forms a complex network of interconnected brain structures. The hippocampus serves as the core of spatial memory, encoding spatial representations through place cells that fire when an individual occupies specific locations in the environment [30]. This mechanism is complemented by grid cells in the medial entorhinal cortex, which provide a structured metric system for navigation by firing at multiple locations in a hexagonal grid pattern [30]. Additional specialized neurons include head-direction cells in the anterior thalamus and postsubiculum that signal directional orientation, and boundary vector cells in the subiculum and medial entorhinal cortex that respond to environmental boundaries [30].
The egocentric reference frame is primarily processed by the posterior parietal cortex, which integrates sensory inputs to coordinate spatial perception with movement [30]. The precuneus plays a pivotal role in transforming multiple egocentric representations into action-relevant information [30]. Conversely, the allocentric reference frame is encoded by the retrosplenial and parahippocampal cortices, which process large-scale environmental features and encode stable, viewpoint-independent spatial layouts [30]. The progressive neuropathology of Alzheimer's disease follows a trajectory that directly affects these critical regions, explaining the sensitivity of spatial navigation tasks for early detection [30].
VR Paradigm Design: Path Integration
Theoretical Basis and Experimental Rationale
Path integration represents a fundamental egocentric navigation process wherein individuals continuously update their position during movement by integrating self-motion cues, including vestibular, proprioceptive, and optic flow information [30]. This path integration mechanism enables navigation without external landmarks by computing a vector back to the starting point through the continuous monitoring of velocity and direction changes [30]. In the context of Alzheimer's disease detection, path integration tasks are particularly valuable because they engage neural circuits in the posterior parietal cortex and connected regions that show early functional alterations in preclinical AD stages [30].
The diagnostic sensitivity of path integration tasks stems from their dependence on the integration of multiple sensory inputs and continuous updating of spatial relationships—cognitive processes that are highly vulnerable to early neurodegenerative changes [31]. Studies have demonstrated that individuals with Mild Cognitive Impairment (MCI) show significant deficits in path integration abilities compared to healthy controls, with these deficits predicting conversion to Alzheimer's dementia [31]. Furthermore, path integration performance correlates with tau pathology in medial temporal and parietal regions, providing a behavioral marker of underlying neuropathology [32].
Detailed Experimental Protocol
Virtual Environment Setup: Create a featureless, circular virtual environment with a radius of 50 virtual units, rendered in a neutral gray color (#5F6368) to eliminate distal landmarks. The environment should be implemented using a head-mounted display (HMD) with a minimum resolution of 1920×1080 per eye and a refresh rate of 90Hz to minimize motion sickness. The virtual space should include only a starting position marker and a target location, both represented by non-directional symbols to prevent beaconing strategies.
Task Procedure: Participants begin at a designated starting point facing a neutral direction. The target location is briefly illuminated (2 seconds) before disappearing. Participants then navigate through a multi-segment path consisting of 3-5 straight segments connected by turns ranging from 30° to 150°. Between segments, visual input is temporarily obscured by a brief fading screen (500ms) to prevent continuous visual tracking. After completing the path, participants must navigate directly back to the original target location from their final position using a joystick or controller. The testing session includes 12 trials of varying complexity, with path lengths increasing progressively from 15 to 45 virtual units.
Table: Path Integration Outcome Measures and Diagnostic Significance
| Measure | Calculation Method | Cognitive Process Assessed | Diagnostic Value for MCI/AD |
|---|---|---|---|
| Absolute Error | Euclidean distance between responded and correct target position | Overall path integration accuracy | High: Significantly increased in MCI [31] |
| Angular Error | Difference in degrees between correct and responded return direction | Angular path integration precision | Moderate-High: Sensitive to early parietal dysfunction [30] |
| Distance Error | Absolute difference between correct and responded distance | Linear distance estimation ability | Moderate: Correlates with entorhinal cortex integrity [30] |
| Trial Completion Time | Time from path completion to response submission | Processing speed and decision confidence | Moderate: Often prolonged in preclinical AD [32] |
| Path Efficiency | Ratio of ideal path length to actual path length | Navigational planning and execution | High: Reveals strategic deficits in MCI [31] |
Data Collection Parameters: Collect continuous positional data at 90Hz sampling rate, including x,y coordinates, head direction, and velocity. Calculate the following primary dependent variables: (1) absolute error (Euclidean distance between responded and correct target position), (2) angular error (directional error in homing response), (3) path efficiency (ratio of ideal to actual path length), and (4) trial completion time. Secondary measures should include velocity profiles, directional consistency, and head movement patterns.
VR Paradigm Design: Landmark-Based Navigation
Theoretical Basis and Experimental Rationale
Landmark-based navigation represents an allocentric spatial strategy that depends on the identification, encoding, and utilization of prominent environmental features for orientation and navigation [30]. This cognitive process requires the formation of viewpoint-independent representations of space that remain stable regardless of the observer's position, engaging hippocampal and parahippocampal regions particularly vulnerable to early Alzheimer's pathology [30]. Landmark-based tasks provide a sensitive measure of cognitive mapping abilities, which enable flexible navigation and the generation of novel routes beyond previously traveled paths [30].
The diagnostic value of landmark-based navigation assessment stems from its reliance on the integrity of the hippocampal formation. Neuropathological studies have established that tau pathology begins in the transentorhinal cortex before spreading to the hippocampus, making tasks that depend on these regions particularly sensitive to early neurodegenerative changes [32]. Individuals with Mild Cognitive Impairment often display specific deficits in allocentric navigation while preserving egocentric abilities, creating a dissociable cognitive profile that predicts conversion to Alzheimer's dementia [31]. Furthermore, landmark-based tasks can differentiate between normal aging and preclinical AD, as healthy older adults typically maintain the ability to use salient landmarks despite declines in other cognitive domains [30].
Detailed Experimental Protocol
Virtual Environment Setup: Design a rich, detailed virtual environment (e.g., a town square, park, or building complex) containing 8-12 distinct, visually unique landmarks (e.g., fountain, distinctive building, sculpture). The environment should include both proximal landmarks (positioned along routes) and distal landmarks (visible from multiple locations) to assess different aspects of landmark utilization. The virtual space should contain a network of interconnected pathways with 5-7 critical decision points where multiple routes converge.
Task Procedure: The landmark-based navigation assessment consists of three sequential phases:
Exploration Phase (5 minutes): Participants freely explore the environment with all landmarks visible. They are instructed to learn the spatial layout and landmark locations but receive no specific navigational goals.
Landmark Recognition Phase: Participants view a series of images including both familiar landmarks from the environment and novel distractors. For each image, they indicate whether the landmark was present in the virtual environment and rate their confidence on a 5-point scale.
Navigation Phase: Participants complete 8 route-finding trials from starting locations to designated targets. In 4 trials, they can use all landmarks (landmark-rich condition); in the other 4 trials, only distal landmarks are visible (landmark-reduced condition). After completing the navigation trials, participants perform a map-drawing task to assess their cognitive map of the environment.
Table: Landmark-Based Navigation Outcome Measures and Interpretation
| Measure | Calculation Method | Cognitive Process Assessed | Diagnostic Significance |
|---|---|---|---|
| Route Learning Accuracy | Percentage of correct trials in navigation phase | Ability to encode and recall landmark-route associations | High: Significantly impaired in MCI [31] |
| Landmark Recognition Sensitivity | d-prime from signal detection theory | Landmark encoding and recognition memory | Moderate-High: Correlates with hippocampal volume [30] |
| Allocentric Spatial Bias | Ratio of allocentric to egocentric strategies in navigation | Preference for landmark-based versus self-movement strategies | High: Reduced allocentric bias predicts AD conversion [31] |
| Map Drawing Accuracy | Scoring of landmark placement and spatial relationships | Quality of cognitive map representation | High: Compromised in early AD due to hippocampal dysfunction [30] |
| Proximal vs. Distal Landmark Use | Difference in performance between landmark conditions | Flexibility in landmark utilization | Moderate: Shows specific pattern in MCI [31] |
Data Collection Parameters: Record complete navigational paths with x,y coordinates and head direction at 90Hz. Code navigational strategies for each trial as primarily egocentric or allocentric based on participant behavior and verbal reports. Measure landmark identification accuracy, reaction times, and confidence ratings. Assess map drawings using a standardized scoring system that evaluates the relative positioning of landmarks, route accuracy, and overall spatial configuration.
Implementation Considerations and Technical Specifications
VR Hardware and Software Requirements
Successful implementation of spatial navigation paradigms requires careful consideration of technical specifications. Head-Mounted Displays should provide a minimum resolution of 1920×1080 per eye, a refresh rate of 90Hz or higher, and a field of view of at least 100 degrees to ensure sufficient immersion while minimizing cybersickness [31]. Tracking systems must support 6 degrees of freedom (6DOF) for both head and hand tracking, with sub-centimeter positional accuracy to capture subtle navigational behaviors. For optimal performance, the rendering pipeline should maintain a consistent frame rate of 90fps or higher, as frame rate drops can induce cybersickness and confound performance measures [31].
Software development should utilize established game engines such as Unity or Unreal Engine, which provide robust support for VR development and package management. The virtual environments should implement appropriate scale metrics, where 1 virtual unit corresponds to 1 meter in real-world scale, to ensure ecological validity [33]. Environmental textures and lighting should be optimized to maintain visual clarity without compromising performance. To enhance reproducibility across research sites, developers should document all technical parameters, including lighting models, texture resolutions, and physics engine settings.
Participant Considerations and Safety Protocols
Research with older adult populations and clinical groups requires specific adaptations to ensure valid data collection and participant safety. Comprehensive screening should exclude individuals with significant visual impairments (uncorrected acuity worse than 20/50), vestibular disorders, or conditions that predispose them to seizures [31]. For participants with presbyopia, HMDs with adjustable diopters or custom lens inserts may be necessary to ensure visual clarity.
To mitigate cybersickness, which occurs more frequently in older adults, implement several preventative measures: provide adequate familiarization sessions (minimum 10 minutes), ensure stable high frame rates, avoid sudden acceleration patterns, and include rest breaks every 10-15 minutes during testing [31]. The testing environment should include physical safety measures such as clear play space boundaries and supervisor oversight throughout the session. For participants unfamiliar with VR technology, extend practice sessions and provide simplified input devices to reduce cognitive load and technology anxiety [31].
Table: Research Reagent Solutions for VR Spatial Navigation Studies
| Resource Category | Specific Tool/Platform | Primary Function | Implementation Considerations |
|---|---|---|---|
| VR Development Platforms | Unity 3D with XR Interaction Toolkit | Virtual environment creation and behavior scripting | Requires C# programming expertise; extensive asset store available |
| Unreal Engine with VR Template | High-fidelity environment rendering | Steeper learning curve but superior graphical quality | |
| Spatial Analysis Software | Matlab with Psychtoolbox | Quantitative analysis of navigation paths | Strong statistical and visualization capabilities |
| Python (NumPy, SciPy, Matplotlib) | Custom analysis pipeline development | Flexible open-source alternative with machine learning extensions | |
| Behavioral Coding Tools | Noldus The Observer XT | Systematic behavior annotation and coding | Integrates with positional data for multimodal analysis |
| ELAN Linguistic Annotator | Time-synchronized behavioral coding | Free alternative with flexible coding schemes | |
| Data Acquisition Systems | HMD Integrated Tracking (Inside-Out) | Position and orientation data collection | Convenient but may have lower precision than external systems |
| External Motion Capture (Optitrack) | High-precision positional tracking | Gold standard for accuracy but requires dedicated lab space | |
| Neuropsychological Batteries | CANTAB Paired Associates Learning | Traditional visual memory assessment | Provides benchmark against established cognitive measures |
| MoCA or MMSE | Global cognitive screening | Essential for characterizing participant cohorts |
The VR paradigms for assessing path integration and landmark-based navigation detailed in this protocol offer robust, ecologically valid tools for detecting subtle spatial memory impairments in preclinical Alzheimer's disease. By targeting specific neural circuits vulnerable to early neuropathology, these tasks demonstrate superior sensitivity to incipient decline compared to traditional neuropsychological measures [31] [30]. The quantitative metrics generated through these protocols provide multidimensional profiles of spatial navigation abilities that can track disease progression and potentially evaluate intervention efficacy.
Future developments in this field will likely include the integration of artificial intelligence and machine learning approaches to identify complex patterns in navigational behavior that may not be evident through conventional analysis methods [32]. The combination of VR with neurophysiological monitoring (EEG, fNIRS, eye-tracking) during navigation tasks offers promising avenues for multimodal biomarker development [30]. Additionally, the creation of standardized normative databases across age groups and cultures will enhance the clinical utility of these paradigms. As VR technology becomes more accessible and affordable, these assessment tools may eventually transition from research settings to clinical applications, enabling widespread early detection of Alzheimer's disease and other neurodegenerative conditions [31].
The standardization of experimental protocols is a critical foundation for the advancement of reliable and reproducible research into early Alzheimer's disease (AD) detection using virtual reality (VR) spatial navigation tasks. Spatial navigation deficits represent one of the earliest cognitive markers of AD, often manifesting years before clinical diagnosis [32]. VR technology provides unparalleled opportunities to assess these subtle deficits in controlled, ecologically valid environments [34]. However, the lack of standardized protocols across research laboratories has hampered the comparability and replication of findings, presenting a significant barrier to the validation and clinical adoption of these promising digital biomarkers [35] [34].
This application note addresses the critical need for protocol standardization by providing detailed methodologies for participant instruction, equipment calibration, and task sequencing specifically tailored for VR spatial navigation research in preclinical AD populations. By establishing rigorous, standardized procedures, researchers can enhance data quality, improve cross-study comparisons, and accelerate the development of VR-based cognitive biomarkers for early detection of Alzheimer's pathology.
Participant Instructions Standardization
Pre-Task Briefing Protocol
Consistent participant instruction is paramount for obtaining valid and reliable performance data in VR spatial navigation tasks. The following standardized briefing protocol should be administered verbatim to all participants:
- Purpose Statement: "This study investigates how people navigate and remember virtual environments. You will be asked to explore a virtual space and complete tasks that assess your ability to find your way and remember locations."
- Task Instructions: For allocentric navigation tasks: "Your goal is to learn the locations of objects in relation to each other, as if you were forming a mental map of the area." For egocentric navigation tasks: "Your goal is to learn a sequence of turns and directions based on your own viewpoint." [36]
- Interface Familiarization: "You will use a [joystick/keyboard/mouse] to move through the environment. You will have a dedicated training session to become comfortable with the controls before the main task begins." [37]
- Symptom Monitoring: "It is possible to experience discomfort or dizziness during VR exposure. Please inform the investigator immediately if you experience any such symptoms. You may take breaks or discontinue the session at any time without penalty."
Cognitive Strategy Assessment
Following task completion, administer a standardized debriefing questionnaire to identify the navigational strategies employed by participants. This is crucial for interpreting behavioral data, as individuals use diverse strategies (allocentric vs. egocentric) that engage different neural systems [36]. Example questions include:
- "Did you try to create a mental map of the overall layout, or did you instead remember a sequence of turns?"
- "To what extent did you rely on specific objects or buildings to guide your navigation?"
Calibration Procedures
Technical Calibration
A pre-experiment calibration routine ensures consistent visual and technical presentation across all participants and sessions.
- Headset Fit Check: Verify the VR headset is secured comfortably with a clear, focused display for each participant.
- Interpupillary Distance (IPD) Adjustment: Manually adjust the IPD to match each participant's measurement to ensure visual clarity and reduce eyestrain.
- Tracking Verification: Confirm the VR system is accurately tracking head rotations and, if applicable, translations. For setups utilizing rotational exploration in a swivel chair, ensure the tracking of yaw-plane movements is functional [38].
Participant-Specific Calibration
Before the main task, participants must complete a standardized training protocol to minimize the confounding effects of variable VR familiarity and interface skill on navigation performance [37].
- Interface Training: A minimum 5-minute practice session in a neutral, non-experimental virtual environment. Participants should practice basic locomotion (forward/backward movement, turns) and interaction with the HID until they report comfort and demonstrate basic proficiency.
- Task Paradigm Familiarization: A brief, simplified version of the core task (e.g., a single trial of the Virtual Water Task or a shortened VSCT exploration phase) should be administered to ensure the participant understands the goals and procedures [35] [38].
Task Sequencing
Core Experimental Sequence
A standardized sequence for a comprehensive VR spatial navigation assessment session should be implemented as follows, with total session duration not exceeding 60-75 minutes to prevent fatigue.
Table 1: Standardized Task Sequence for VR Spatial Navigation Assessment
| Order | Phase | Duration | Primary Objective | Key Measures |
|---|---|---|---|---|
| 1 | Informed Consent & Pre-Briefing | 10 min | Explain procedures, obtain consent, screen for contraindications. | N/A |
| 2 | Baseline Neuropsychological Battery | 20 min | Assess global cognitive status and other domains. | Standardized test scores (e.g., MMSE, MoCA) |
| 3 | VR Setup & Technical Calibration | 5 min | Fit headset, adjust IPD, verify tracking. | Technical log |
| 4 | Interface Training & Familiarization | 5-10 min | Acclimatize to VR controls and basic task logic. | Proficiency rating, subjective comfort |
| 5 | Core VR Navigation Task | 15-20 min | Assess spatial navigation ability. | See Table 2 |
| 6 | Post-Task Debrief & Strategy Report | 5 min | Identify participant's navigational strategy. | Debriefing questionnaire responses |
| 7 | Headset Removal & Break | 5 min | Reset before optional follow-up. | N/A |
| 8 | Optional: Non-Spatial Control Task (if required by design) | 10 min | Control for general memory and attention. | Task-specific accuracy and reaction time |
This structured sequence controls for order effects, minimizes learning confounds between different cognitive assessments, and ensures participant comfort and safety throughout the session. The inclusion of a non-spatial control task, such as a verbal memory task, can help isolate spatial reasoning deficits from general memory decline [38].
Sequencing within the Virtual Spatial Configuration Task (VSCT)
For implementations of the VSCT, which is designed to evaluate cognitive map formation with minimal locomotion, the internal task sequence is critical. The following workflow details the standardized procedure, which restricts movement to rotational exploration in a swivel chair to reduce motion sickness and improve accessibility for populations with impaired mobility [38].
Figure 1: Experimental workflow for the Virtual Spatial Configuration Task (VSCT). This diagram outlines the standardized sequence from active exploration to spatial recall testing, highlighting the key components of the protocol [38].
Data Collection and Performance Metrics
For the core VR navigation task, a standardized set of quantitative and qualitative metrics must be collected to comprehensively assess spatial ability. These metrics can be categorized into primary performance and secondary behavioral indices.
Table 2: Standardized Metrics for VR Spatial Navigation Task Performance
| Metric Category | Specific Metric | Definition & Computational Method | Cognitive Process Assessed |
|---|---|---|---|
| Primary Performance Metrics | Navigation Efficiency | Path length taken to reach goal ÷ shortest possible path length. | Wayfinding efficiency, planning. |
| Allocentric Pointing Error | Absolute angular difference (degrees) between participant's pointing direction and correct direction to a landmark from a novel vantage point. | Cognitive map accuracy [39]. | |
| Trial Completion Time | Elapsed time (seconds) from trial start to successful goal location. | Overall task proficiency. | |
| Search Strategy | Classification of strategy type (e.g., allocentric, egocentric, serial search) based on behavioral patterns and post-task report. | Neural systems engaged [36]. | |
| Secondary Behavioral Metrics | Head Direction Variance | Variability in head direction (degrees) during exploration or learning phases. | Environmental sampling, visual exploration. |
| Velocity Profile | Instantaneous speed of virtual movement during navigation. | Locomotor control, decisional pauses. | |
| Proximity to Landmarks | Time spent or path proximity within a defined radius of salient landmarks. | Landmark utilization strategy. |
The Scientist's Toolkit: Research Reagent Solutions
The following table outlines the essential "research reagents" — the key materials and tools — required to implement a standardized VR spatial navigation lab for Alzheimer's disease research.
Table 3: Essential Research Reagents for VR Spatial Navigation Studies
| Item | Function/Description | Specification Notes |
|---|---|---|
| Immersive VR System | Presents the virtual environment and tracks head movements. | Must include a head-mounted display (HMD) with rotational and positional tracking. |
| Swivel Chair | Enables rotational exploration for tasks like the VSCT. | Standard office swivel chair; provides vestibular/proprioceptive feedback during 360° exploration [38]. |
| Human Interface Device (HID) | Allows user to control virtual locomotion and interaction. | Joystick, gamepad, or keyboard; choice must be standardized and reported, as skill affects performance [37]. |
| Virtual Water Task (VWT) Platform | Assesses allocentric spatial navigation and memory. | Software implementing a hidden goal platform in a circular virtual arena; requires standardized arena shape, platform size, and trial procedures [35]. |
| Virtual Spatial Configuration Task (VSCT) | Assesses cognitive map formation of object layouts. | Software featuring an exploration phase (restricted to rotation) followed by a recall phase testing spatial relationships [38]. |
| Spatial Pointing Task | Quantifies the accuracy of allocentric spatial knowledge. | Software that presents a virtual environment and prompts participants to point to remembered landmarks from a specified orientation [39] [36]. |
| Data Analysis Pipeline | Processes raw tracking data into quantitative metrics. | Custom or commercial software for calculating metrics like path length, heading error, and dwell time from log files. |
In the pursuit of early Alzheimer's disease (AD) detection, virtual reality (VR) spatial navigation tasks have emerged as powerful, non-invasive diagnostic tools. These tests quantify subtle deficits in neural pathways affected in the earliest stages of AD pathology, often before overt cognitive symptoms appear [12]. The entorhinal cortex and hippocampal formation, where neurofibrillary tangles first develop in AD, contain grid cell networks essential for spatial mapping and navigation capabilities [12]. By measuring specific performance metrics, researchers can detect functional impairments in these regions years before traditional diagnostic methods.
This document provides application notes and experimental protocols for quantifying two critical classes of metrics in VR spatial navigation research: Mean Error Distance in path integration tasks and Allocentric Accuracy in spatial memory tasks. These metrics show significant correlations with established AD biomarkers and demonstrate predictive value for progression to dementia [40]. The standardized methodologies outlined here are designed to enable consistent implementation across research settings, facilitating comparability between studies and accelerating validation of VR navigation as a digital biomarker for preclinical AD detection.
Research demonstrates consistent relationships between VR navigation metrics and Alzheimer-related biomarkers across different populations. The following tables summarize key quantitative findings from recent studies.
Table 1: Correlations Between Path Integration Errors and Plasma Biomarkers in Healthy Adults (n=111) [12] [18]
| Biomarker | Correlation with PI Errors | Statistical Significance | Multivariate Analysis |
|---|---|---|---|
| Plasma GFAP | Positive correlation | Significant | t-value = 2.16, p = 0.0332 |
| Plasma p-tau181 | Positive correlation | Significant | t-value = 2.53, p = 0.0128 |
| Plasma NfL | Positive correlation | Significant | - |
| ApoE ε4 allele | Positive association | Coefficient = 0.650, p = 0.037 | - |
Table 2: Spatial Navigation Performance Predicting Dementia Conversion in SCD/MCI Patients [40]
| Patient Group | Follow-up Period | Predictive Metric | Odds Ratio for Dementia |
|---|---|---|---|
| SCD & MCI (n=332) | 2-year | FMT Total Time (per 10s increase) | OR 1.10, 95% CI 1.04-1.16 |
| SCD & MCI (n=332) | 4-year | FMT Total Time (per 10s increase) | OR 1.10, 95% CI 1.04-1.16 |
| SCD & MCI (n=332) | Baseline | FMT Total Time with P-tau | Significant association (p<0.05) |
| SCD & MCI (n=332) | Baseline | FMT Total Time with NfL | Significant association (p<0.05) |
Table 3: Working Memory Influence on Allocentric Spatial Accuracy in Healthy Adults (n=123) [41]
| Working Memory Group | Spatial Errors in Boxes Room Task | Learning Effect Across Trials |
|---|---|---|
| High WMC (K>3.3) | Fewer allocentric errors | Significant improvement across blocks |
| Low WMC (K<2.88) | More allocentric errors | Significant improvement across blocks |
Experimental Protocols
Protocol 1: Path Integration Task with Head-Mounted VR
Objective: To quantify egocentric navigation ability by measuring Mean Error Distance in a path integration task where participants navigate without external landmarks [12].
Equipment:
- Meta Quest 2 head-mounted VR system [12]
- Joystick for movement control [12]
- Standardized swivel chair [21]
Virtual Environment:
- 20-virtual meter (vm) diameter circular arena [12]
- Walls 3 vm in height [12]
- No distal landmarks for orientation [12]
Procedure:
- Participant Preparation: Seat participant in swivel chair. Instruct them on joystick operation: forward/backward movement controlled by joystick, lateral movements require physical rotation [12].
- Familiarization Phase: Allow free movement in virtual arena with obstacles for 5 minutes to acclimate to VR environment and reduce cybersickness [12].
- Task Instruction: Explain that the goal is to return to the starting point after a series of displacements without visual cues.
- Path Integration Trial:
- Participant moves along a predetermined pathway while external cues are obscured.
- At pathway end, participant estimates direction and distance to starting point.
- System records the actual versus estimated position.
- Data Collection: Repeat for 8-10 trials with different pathways.
Data Analysis:
- Calculate Mean Error Distance: the average absolute distance between actual and estimated positions across all trials [12].
- Compute angular error in heading direction.
- Perform regression analysis with biomarker levels (GFAP, p-tau181, NfL) [12].
Protocol 2: Allocentric Spatial Memory Assessment
Objective: To measure allocentric (world-centered) navigation accuracy using landmark-based spatial memory tasks in immersive VR [21].
Equipment:
- Meta Quest 3 head-mounted VR system [21]
- Unity Game Engine environment [21]
- Mountain landscape virtual environment with distinctive landmarks (e.g., red lighthouse, cabin) [21]
Procedure:
- Environment Encoding:
- Participant views environment from starting room with clear visibility of landmarks [21].
- Allow 2 minutes for mental mapping of landmark positions.
- Navigation Phase:
- Fog obscures distant view as participant moves through hallway [21].
- Participant uses joystick and physical rotation to navigate.
- Allocentric Testing:
- At navigation end, participant identifies landmark locations on map.
- System records accuracy of landmark position estimates.
- Alternative Method (Boxes Room):
Data Analysis:
- Calculate Allocentric Accuracy: percentage of correct landmark position identifications [21].
- Measure error rate in Boxes Room task (number of incorrect boxes opened before finding all rewards) [41].
- Analyze learning curve across trial blocks [41].
Participant Screening and Biomarker Assessment
Participant Recruitment:
- Target populations: Healthy adults (age 22-79), patients with Subjective Cognitive Decline (SCD), and Mild Cognitive Impairment (MCI) [12] [40].
- Exclusion criteria: MMSE<26, history of stroke, neurological/psychiatric disorders, inability to complete VR tasks due to cybersickness [12].
Cognitive Assessment Battery:
- Mini-Mental State Examination (MMSE) [12]
- Addenbrooke's Cognitive Examination-Revised (ACE-R) [12]
- Montreal Cognitive Assessment (MoCA-J) [12]
- Geriatric Depression Scale-15 (GDS-15) [12]
Biomarker Collection:
- Blood samples for plasma biomarkers (GFAP, NfL, Aβ40, Aβ42, p-tau181) [12]
- APOE ε4 genotyping [12]
- CSF biomarkers (Aβ42/40 ratio, P-tau, NfL) when available [40]
- 3T MRI for entorhinal cortex thickness and hippocampal volume [12] [40]
Visualization of Experimental Workflows
VR Navigation Assessment Workflow
Navigation Metrics and Biomarker Relationships
The Scientist's Toolkit: Research Reagent Solutions
Table 4: Essential Materials and Equipment for VR Navigation Research
| Item | Function/Application | Example Specifications |
|---|---|---|
| Head-Mounted VR System | Presents immersive virtual environments for navigation tasks | Meta Quest 2/3 [12] [21] |
| Unity Game Engine | Platform for developing customized VR navigation environments | Version 2019.4+ [21] |
| Plasma Biomarker Assays | Quantifies Alzheimer-related pathology biomarkers | GFAP, p-tau181, NfL ELISA kits [12] |
| APOE Genotyping Kit | Determines genetic risk factor status | PCR-based genotyping [12] |
| 3T MRI Scanner | Measures structural brain changes (entorhinal cortex, hippocampus) | Siemens Tim Trio 3T [40] |
| Cognitive Assessment Tools | Standardized cognitive screening | MMSE, ACE-R, MoCA-J [12] |
| VR Navigation Software | Implements path integration and allocentric memory tasks | Custom Unity applications [12] [21] |
| Data Analysis Pipeline | Processes VR tracking data and computes performance metrics | Python/R with custom scripts [12] |
Integrating VR Assessment with Biomarker Collection in Trial Protocols
The early detection of Alzheimer's disease (AD) represents one of the most significant challenges in modern neuroscience. Traditional diagnostic methods, including conventional neuropsychological testing and biomarker collection through cerebrospinal fluid (CSF) analysis or PET imaging, face limitations due to cost, invasiveness, and poor sensitivity to early pathological changes [42] [43]. Virtual reality (VR) technology, particularly spatial navigation assessment, has emerged as a powerful non-invasive tool for detecting subtle cognitive changes associated with early AD pathology. When integrated strategically with biomarker collection, VR assessment creates a multimodal framework that significantly enhances early detection capabilities for both research and clinical trial applications.
Spatial navigation deficits are increasingly recognized as among the earliest cognitive manifestations of AD, attributable to the vulnerability of the entorhinal-hippocampal network where neurofibrillary tangle pathology first emerges [12] [20]. This protocol outlines methodologies for integrating VR-based spatial navigation assessment with biomarker collection to create a comprehensive, sensitive, and specific approach for early AD detection in clinical trial settings. The complementary nature of these modalities—with VR capturing real-world functional correlates of pathology and biomarkers providing molecular confirmation—creates a powerful synergistic effect that neither approach can achieve in isolation [44] [45].
Conceptual Framework and Scientific Rationale
Neurobiological Foundations of Spatial Navigation in AD
The entorhinal cortex (EC) serves as the neuroanatomical nexus linking VR navigation assessment and AD pathology. As the initial site of neurofibrillary tangle development in AD, the EC contains specialized grid cells that form the neural basis for path integration—the continuous updating of self-position during navigation using self-motion cues [12] [46]. This neurobiological foundation provides the mechanistic link between AD pathology and navigational impairment, making spatial navigation assessment a particularly sensitive behavioral marker for early detection.
Research demonstrates that path integration errors, quantified using immersive VR systems, show significant positive correlations with both age and key plasma biomarkers including glial fibrillary acidic protein (GFAP), neurofilament light chain (NfL), and phosphorylated tau (p-tau181) [12] [18] [46]. Multivariate analyses have identified plasma GFAP and p-tau181 as significantly correlated with path integration errors, with machine learning approaches identifying p-tau181 as the most significant predictor of navigation performance [12]. These findings establish the empirical foundation for integrating VR assessment with biomarker collection in clinical trial protocols.
Complementary Strengths of VR and Biomarker Modalities
VR-derived biomarkers and molecular biomarkers offer complementary strengths that, when combined, create a more robust detection framework than either approach alone:
VR-derived biomarkers excel at capturing real-world functional impairments with high ecological validity, providing continuous performance data that is sensitive to subtle decline and suitable for repeated administration [45] [47]. Studies demonstrate VR assessments can achieve 90% specificity in classifying mild cognitive impairment (MCI) [44].
Molecular biomarkers provide objective evidence of underlying AD pathology, with plasma p-tau181 showing particular promise as a predictor of navigation impairment [12] [46]. MRI biomarkers demonstrate 90.9% sensitivity for MCI detection [44].
The integration of these modalities creates a powerful synergistic effect. Research by Park et al. demonstrated that a multimodal support vector machine (SVM) model integrating both VR-derived and MRI biomarkers achieved superior performance (94.4% accuracy, 100% sensitivity, 90.9% specificity) compared to unimodal approaches [44] [45].
Figure 1: Conceptual Framework for Integrated VR and Biomarker Assessment in AD Detection
Quantitative Evidence Base
Diagnostic Accuracy of Spatial Navigation Strategies
Recent meta-analytic evidence demonstrates that different spatial navigation strategies show complementary diagnostic profiles across the AD continuum [20]. The table below summarizes the diagnostic accuracy of various spatial navigation approaches for AD detection:
Table 1: Diagnostic Accuracy of Spatial Navigation Strategies in AD Detection
| Navigation Strategy | Sensitivity | Specificity | Clinical Utility |
|---|---|---|---|
| Allocentric Tasks | 84% | 83% | Balanced detection of AD cases vs. healthy controls |
| Frame-Switching Tasks | 84% | 66% | Valuable for excluding AD but less reliable for confirmation |
| Combined Egocentric-Allocentric | Information missing | 94% | Highest specificity for ruling out non-AD cases |
| Egocentric Tasks | 72% | 81% | Limited sensitivity; abilities preserved until advanced stages |
Correlation Between VR Performance and Biomarkers
Studies investigating the relationship between VR navigation performance and AD biomarkers have revealed significant correlations that support their integrated use:
Table 2: Correlations Between VR Navigation Performance and AD Biomarkers
| Biomarker | Correlation with PI Errors | Statistical Significance | Clinical Interpretation |
|---|---|---|---|
| Plasma GFAP | Significant positive correlation | t-value = 2.16, p = 0.0332 | Reflects astroglial activation associated with early pathology |
| Plasma p-tau181 | Significant positive correlation | t-value = 2.53, p = 0.0128 | Most significant predictor of path integration impairment |
| Plasma NfL | Significant positive correlation | Information missing | Indicates neuroaxonal injury |
| ApoE ε4 Genotype | Positive association | Coefficient = 0.650, p = 0.037 | Genetic risk factor associated with navigation impairment |
Integrated Protocol Specifications
Participant Selection and Eligibility Criteria
Optimal participant selection is critical for successful implementation of integrated VR-biomarker protocols. Based on successful studies, the following eligibility framework is recommended:
Cohort Composition: Include healthy adults across a broad age range (22-79 years) to capture age-related decline trajectories, with oversampling in the 50+ age range where path integration errors typically commence [12] [46].
Inclusion Criteria: Normal cognitive screening scores (MMSE ≥26, ACE-R ≥89), absence of neurological or psychiatric disorders, capacity to provide informed consent, and ability to complete VR testing without significant motion sickness [12] [18].
Exclusion Criteria: History of stroke or other neurological conditions, significant visual or motor impairment preventing VR use, current psychoactive medication use that may affect cognitive performance, and contraindications for MRI (if included) [12] [45].
Sample size calculations should be based on effect sizes observed in previous studies. The Shima et al. study achieved robust correlations with 111 participants [12], while the Park et al. multimodal learning study demonstrated high classification accuracy with 54 participants [44].
VR Spatial Navigation Assessment Protocol
The following protocol specifications are adapted from validated methodologies used in recent research:
Equipment Requirements:
- Head-mounted display (HMD) with integrated tracking (e.g., Meta Quest 2)
- Joystick controller for navigation
- Dedicated testing space with safety considerations
- Performance recording and computational system
Virtual Environment Parameters:
- Circular arena approximately 20 virtual meters in diameter
- Enclosing walls approximately 3 virtual meters high
- Minimal landmark cues to emphasize path integration
- Customizable obstacle configurations
Path Integration Task Protocol:
- Familiarization Phase: Participants freely explore the virtual environment for 3-5 minutes to acclimate to VR navigation controls.
- Testing Phase: Participants navigate from a starting point to a hidden target location using only self-motion cues (no visual landmarks).
- Trial Structure: Minimum of 8 trials with varying starting positions and target locations.
- Primary Outcome Measure: Euclidean distance between actual and estimated target location (path integration error).
- Secondary Measures: Navigation time, head direction variability, velocity profiles.
This protocol specifically targets the entorhinal cortex-dependent path integration system, which shows particular vulnerability to early AD pathology [12] [46].
Biomarker Collection and Analysis Protocol
Concurrent with VR assessment, the following biomarker collection protocol is recommended:
Blood-Based Biomarker Collection:
- Timing: Fasting morning blood draw preferred, coordinated with VR testing timeline
- Sample Processing: Plasma separation within 2 hours of collection, storage at -80°C
- Target Analytes: p-tau181, GFAP, NfL, Aβ42/Aβ40 ratio
- Analytical Methods: Single molecule array (Simoa) technology recommended for superior sensitivity
Genetic Analysis:
- ApoE Genotyping: Standard PCR-based methods
- Reporting: ε4 carrier status with allele count
Optional Neuroimaging Parameters (if included):
- 3T MRI with T1-weighted volumetric sequencing
- Primary Region of Interest: Entorhinal cortex thickness
- Secondary Regions: Hippocampal volume, posterior cingulate cortex
The hierarchical application of 3D VR path integration assessment and plasma p-tau181 has been identified as a particularly effective combinatorial biomarker for early AD neurodegeneration [12] [46].
Figure 2: Integrated VR and Biomarker Assessment Workflow for Clinical Trial Protocols
Implementation Framework and Technical Specifications
The Scientist's Toolkit: Essential Research Reagents and Materials
Successful implementation of integrated VR-biomarker protocols requires specific technical resources and analytical tools:
Table 3: Essential Research Reagents and Solutions for Integrated VR-Biomarker Protocols
| Category | Specific Tools/Reagents | Function/Application | Technical Specifications |
|---|---|---|---|
| VR Hardware | Meta Quest 2 or equivalent HMD | Immersive spatial navigation assessment | 6DoF tracking, 90Hz+ refresh rate, joystick controller |
| VR Software | Custom path integration environment | Presentation of navigation tasks | 20m diameter virtual arena, performance logging |
| Biomarker Analysis | Simoa HD-1 Analyzer | Ultrasensitive biomarker quantification | Single molecule detection for p-tau181, GFAP, NfL |
| Genetic Analysis | ApoE genotyping kit | Genetic risk assessment | PCR-based ε2/ε3/ε4 allele discrimination |
| Neuroimaging | 3T MRI with T1-weighted sequences | Structural brain analysis | ≤1mm³ voxel resolution, entorhinal cortex segmentation |
| Data Integration | Multimodal machine learning pipeline | Integrated classification | SVM with RBF kernel, feature selection from both modalities |
Operational Considerations and Feasibility Metrics
Successful implementation requires attention to several operational factors:
Testing Sequence: Studies demonstrate optimal results with blood collection followed by cognitive assessment, VR testing, and finally MRI scanning in a single-day protocol [12].
VR Tolerance Management: Approximately 6.4% of participants may experience VR-induced sickness necessitating exclusion [12]. Implement acclimation protocols with gradual exposure.
Data Integration Pipeline: Establish standardized preprocessing for VR performance metrics (path integration error, navigation efficiency) alongside biomarker z-scores for multimodal machine learning.
Feasibility Metrics: Target >90% completion rate for entire assessment protocol, with balanced recruitment across age decades from 20-79 to capture age-related trajectories [12] [47].
Data Integration and Analytical Approaches
Multimodal Machine Learning Framework
The integration of VR and biomarker data requires sophisticated analytical approaches. Park et al. demonstrated the efficacy of a support vector machine (SVM) model with the following architecture [44] [45]:
Feature Selection and Preprocessing:
- VR-derived features: Hand movement speed, scanpath length, time to completion, error counts
- Biomarker features: p-tau181, GFAP, NfL concentrations, ApoE ε4 carrier status
- Neuroimaging features (if available): Entorhinal cortex thickness, hippocampal volume
Model Training and Validation:
- Cross-validation with stratified k-fold (k=5) to maintain class distribution
- Feature scaling to normalize across modalities
- Hyperparameter optimization via grid search
- Performance evaluation using accuracy, sensitivity, specificity, and AUC-ROC
This approach achieved 94.4% accuracy in distinguishing patients with MCI from healthy controls, significantly outperforming unimodal models [44].
Correlation and Multivariate Analysis
For studies focused on continuous measures rather than classification, multivariate linear regression provides the primary analytical framework. Shima et al. demonstrated significant correlations between path integration errors and plasma biomarkers after adjusting for age and other covariates [12] [46]. Recommended analytical sequence:
- Bivariate Correlations: Pearson correlations between PI errors and individual biomarkers
- Multivariate Regression: Model including age, gender, education, and multiple biomarkers
- Machine Learning Feature Importance: Random forest or XGBoost to rank predictor importance
- Mediation Analysis: Examine whether biomarker levels mediate age-PI error relationships
This analytical progression enables both detection of individual associations and understanding of complex multivariate relationships.
The integration of VR spatial navigation assessment with biomarker collection represents a transformative approach to early AD detection in clinical trial settings. This protocol leverages the complementary strengths of both modalities—VR's sensitivity to functional impairment and biomarkers' specificity for underlying pathology—to create a comprehensive detection framework with superior diagnostic accuracy.
Future developments in this field will likely include:
- Standardization of VR paradigms across research sites to enable multi-center trials
- Development of even more sensitive plasma biomarkers for earlier detection
- Integration of additional digital biomarkers (e.g., eye tracking, speech analysis)
- Longitudinal applications to track disease progression and treatment response
The hierarchical application of 3D VR path integration assessment followed by plasma p-tau181 measurement provides a particularly promising combinatorial biomarker for early AD neurodegeneration [12] [46]. This integrated approach paves the way for more sensitive clinical trials, timely therapeutic interventions, and improved patient outcomes throughout the AD continuum.
Overcoming Technical and Practical Challenges in VR Research Deployment
Mitigating VR-Induced Sickness in Older and Vulnerable Populations
Virtual reality (VR) spatial navigation tasks have emerged as a highly sensitive tool for detecting early pathophysiological changes in Alzheimer's disease (AD), often before clinical symptoms manifest [12] [18] [48]. However, the implementation of these paradigms in older and vulnerable populations, including those with early neurodegenerative changes, is frequently challenged by VR-induced sickness (also known as cybersickness), characterized by symptoms such as nausea, dizziness, and disorientation [49] [50]. This adverse effect not only risks participant attrition but can also confound cognitive performance metrics central to diagnostic accuracy. Recent data indicates that approximately 8% (9 of 114) of healthy adult participants withdrew from a VR navigation study due to VR-induced sickness, underscoring the practical significance of this challenge in research settings [12] [18]. This application note synthesizes current evidence and provides structured protocols to mitigate these effects, ensuring both data integrity and participant safety in sensitive research populations.
Understanding the Challenge: Age-Related Factors and Sensorimotor Mismatch
The etiology of VR sickness is frequently attributed to sensorimotor mismatches, a discrepancy between expected and actual sensory inputs across visual, vestibular, and proprioceptive modalities [49]. While traditional models suggested older adults would be more vulnerable to these conflicts due to age-related declines in sensory integration, recent empirical findings contradict this assumption.
Table 1: Factors Influencing VR Sickness Susceptibility in Older Adults
| Factor | Traditional Assumption | Recent Evidence | Research Implications |
|---|---|---|---|
| Age | Increased susceptibility with age [49] | Younger participants reported higher (worse) Simulator Sickness Questionnaire (SSQ) scores; older adults showed higher tolerance [49]. | Age alone is not a reliable predictor of VR sickness; recruitment strategies should not exclude based on age. |
| Sensorimotor Mismatch | Mismatches invariably increase sickness [49] | In tasks isolating proprioceptive conflict (no visual-vestibular conflict), mismatches did not significantly increase SSQ scores [49]. | Task design is critical; careful isolation of sensory conflicts can allow for challenging tasks without inducing sickness. |
| Cognitive & Physical Load | N/A | Mismatch groups reported higher exhaustion and frustration, indicating cognitive strain [49]. Age-related sensorimotor decline impacts usability [50]. | Monitor cognitive load and physical discomfort as distinct from, but related to, VR sickness. |
| Prior Experience | N/A | Limited VR experience in older adults is common [49] [51]. | Structured training and familiarization protocols are essential for novice users. |
Contrary to initial hypotheses, a randomized controlled trial (n=104, ages 19-84) found that younger participants reported significantly worse VR sickness symptoms on the Simulator Sickness Questionnaire (SSQ). Older participants demonstrated a higher tolerance, particularly in paradigms that deliberately induced proprioceptive mismatches during hand-object interaction without provoking visual-vestibular conflict [49]. This suggests that the type of sensory conflict is a critical determinant of tolerance. However, older adults may still experience greater cognitive strain and frustration from these mismatches, which can impact task engagement and performance [49] [50]. Age-related changes in vision, hearing, motor control, and cognition can hinder interaction with VR environments, potentially contributing to anxiety, disorientation, and reduced engagement [50].
Application Notes: Mitigation Strategies for Research Design
Based on the current evidence, the following mitigation strategies are recommended for researchers deploying VR navigation tasks in older and vulnerable populations.
1. Paradigm Selection and Isolation of Sensory Conflicts: Prioritize research paradigms that minimize visual-vestibular conflict. This can be achieved by using seated VR tasks [49] or employing teleportation-based locomotion instead of continuous joystick-based movement that can induce vection. Studies that successfully tested older adults often used tasks where participants remained seated, and the VR scene contained no optic flow or viewpoint movement, thus isolating proprioceptive mismatch from the more nauseogenic visual-vestibular conflict [49] [21].
2. Hardware and Software Optimization: Utilize commercially available, high-resolution headsets (e.g., Meta Quest 2/3) to reduce latency and improve visual clarity [51] [21]. Ensure the software maintains a high, stable frame rate. The pupillary distance (PD) should be measured and individually adjusted for each participant in the headset's software settings to optimize visual quality and reduce eye strain [49].
3. Structured Participant Acclimatization and Training: Implement a mandatory, self-paced familiarization period before data collection begins. This allows participants to adapt to the VR environment and practice using the controllers [50] [51]. Research shows that despite limited prior experience, older participants can quickly adapt to controllers and navigation when given appropriate training [51]. Providing clear, multi-sensory instructions (visual and auditory) during this phase is crucial [50].
4. Simplification of User Interfaces and Controls: Design intuitive and simplified control mechanisms to accommodate age-related cognitive and motor declines [50]. This includes using large, easy-to-see interface elements and minimizing the number of buttons required to perform tasks. The goal is to reduce cognitive load and physical discomfort, which supports sustained engagement [50].
5. Monitoring and Response Protocols: Actively monitor participants for signs of discomfort through direct observation and verbal check-ins. The use of standardized tools like the Simulator Sickness Questionnaire (SSQ) is recommended for quantitative assessment [49]. The finding that anxiety-provoking VR contexts can initially impair walking performance but that this response tapers over time also suggests that short, repeated exposures may build tolerance and should be considered in longitudinal study designs [52].
Experimental Protocol: A Workflow for VR Navigation Studies in Aging Research
The following workflow diagram and detailed protocol outline the key steps for implementing a VR spatial navigation study with integrated sickness mitigation strategies for older and at-risk populations.
Figure 1: Experimental workflow for VR studies with integrated sickness mitigation.
Detailed Protocol Steps:
Step 1: Participant Screening and Consent
- Objective: To identify individuals at potential high risk for VR sickness and ensure informed participation.
- Procedure: During recruitment, screen for a history of severe motion sickness, vestibular disorders, or epilepsy. The informed consent process must explicitly describe the potential for VR-induced sickness and the participant's right to withdraw at any time without penalty [12] [49].
- Documentation: Record relevant medical history and prior VR experience.
Step 2: Pre-Test Setup and Hardware Configuration
- Objective: To optimize physical comfort and display clarity, reducing one source of sensory strain.
- Procedure: Correctly fit the Head-Mounted Display (HMD), ensuring it is snug but not overly tight. Measure and set the Interpupillary Distance (IPD) for each participant using the device's software settings [49]. Secure controller straps to prevent dropping and provide verbal reassurance.
Step 3: Structured Familiarization Phase
- Objective: To acclimate participants to the VR medium and controls, reducing anxiety and initial disorientation.
- Procedure: Before the core experimental task, participants engage in a self-paced, interactive tutorial in a simple, neutral VR environment [21]. They should practice basic navigation (e.g., using the joystick to move, turning their head to look around) until they report feeling comfortable. Observations from usability studies suggest that this period is critical for novice users to build confidence [51].
Step 4: Baseline and Post-Task Sickness Assessment
- Objective: To quantify susceptibility and monitor the physiological impact of the VR exposure.
- Procedure: Administer the Simulator Sickness Questionnaire (SSQ) both before (after familiarization) and immediately after the main VR navigation task [49]. The SSQ measures symptoms of nausea, oculomotor strain, and disorientation. Compare pre- and post-scores to identify significant changes. Supplement with open-ended questions to gather qualitative feedback on the experience.
Step 5: Execution of Core VR Navigation Task with Monitoring
- Objective: To collect valid spatial navigation data while minimizing participant risk.
- Procedure: Conduct the task (e.g., a path integration or spatial memory paradigm) with the participant seated to minimize fall risk and visual-vestibular conflict [49] [21]. An experimenter should be present throughout to observe the participant and conduct brief verbal check-ins every 5-10 minutes. The protocol should be designed for a manageable duration, typically 30-60 minutes, to prevent fatigue [48].
Step 6: Data Integrity and Exclusion Criteria
- Objective: To establish clear, pre-defined criteria for data exclusion based on sickness.
- Procedure: Prior to analysis, review all datasets. Pre-specified exclusion criteria should include: participant withdrawal due to sickness, a post-task SSQ score exceeding a pre-determined threshold (e.g., ⅔ of the maximum score), or observer notes indicating severe distress that likely compromised task performance [12] [18].
The Scientist's Toolkit: Essential Research Reagents and Materials
Table 2: Key Research Reagents and Equipment for VR Navigation Studies
| Item | Specification / Example | Primary Function in Research |
|---|---|---|
| VR Head-Mounted Display (HMD) | Meta Quest 2/3 [51] [21], Oculus Rift S [49] | Provides immersive 3D visual and auditory stimuli. Inside-out tracking enables movement in 6 degrees of freedom. |
| VR Development Software | Unity Engine [49] [21], Unreal Engine [51] | Platform for creating and running custom VR navigation tasks and environments with high-quality graphics. |
| Sickness Assessment Tool | Simulator Sickness Questionnaire (SSQ) [49] | Validated metric to quantitatively track nausea, oculomotor, and disorientation symptoms before and after VR exposure. |
| Cognitive Assessment Batteries | MMSE, ACE-R, MoCA-J [12] [18] | Standardized neuropsychological tests to establish baseline cognitive status and participant eligibility. |
| Biomarker Assay Kits | Plasma p-tau181, GFAP, NfL [12] [18] [48] | Provide molecular correlates to validate VR-based cognitive findings against established Alzheimer's disease biomarkers. |
| Data Analysis Platform | Custom machine learning scripts, IBM SPSS [12] [51] | For statistical analysis, multivariate regression, and predictor importance ranking to link PI errors to biomarkers and age. |
The integration of VR spatial navigation tasks into the early detection pipeline for Alzheimer's disease represents a significant advance in non-invasive diagnostics. While VR-induced sickness presents a tangible challenge, the proactive application of targeted mitigation strategies—careful paradigm design, participant acclimatization, and continuous monitoring—can effectively manage this risk. The evidence indicates that older adults, including those vulnerable to neurodegenerative disease, can tolerate well-designed VR experiences, enabling researchers to leverage the rich, ecologically valid data these tools provide. By adopting these application notes and protocols, the scientific community can accelerate the translation of VR technology from a research tool into a viable component of clinical screening and monitoring.
Ensuring Accessibility and Usability for Diverse Cognitive Ability Levels
The application of Virtual Reality (VR) spatial navigation tasks represents a paradigm shift in the early detection of Alzheimer's disease (AD), offering a sensitive, non-invasive window into the function of the entorhinal cortex and hippocampus—the first brain areas affected by the disease's pathology [12] [21]. For these tools to be effective and ethically deployed in research, ensuring their accessibility and usability across a diverse spectrum of cognitive abilities is paramount. Research participants may include not only healthy older adults with natural, age-related cognitive changes but also individuals with Mild Cognitive Impairment (MCI) and early AD, all of whom must be able to interact with the technology meaningfully for the data to be valid. A failure in accessibility can introduce confounding variables, exclude key populations from research, and ultimately compromise the scientific integrity and translational potential of these promising digital biomarkers. This document provides detailed application notes and protocols to embed robust accessibility principles into the design and implementation of VR spatial navigation tasks for AD research.
Foundational Principles and Quantitative Evidence
The design of accessible VR tasks is grounded in the understanding of both the cognitive profiles of the target population and the technical aspects of VR that can impose barriers. The core principle is to minimize extraneous cognitive load, allowing the task to measure the target cognitive function (e.g., allocentric navigation) rather than the user's ability to overcome a poorly designed interface.
Key Spatial Memory Deficits in Early Alzheimer's Disease
Early AD pathophysiology specifically targets neural structures critical for navigation. Neurofibrillary tangles originate in the entorhinal cortex, which contains the grid cell network essential for path integration—the process of using self-motion cues to update one's position [12] [18]. This leads to a detectable decline in navigation abilities, which can be quantified as an increase in path integration errors in VR tasks [12]. Furthermore, AD impairs the ability to use and switch between different spatial reference frames:
- Egocentric Navigation: A body-centered strategy (e.g., "turn left after the red building"). This is relatively more resilient in healthy aging but is impaired in AD [21].
- Allocentric Navigation: A world-centered strategy that relies on a cognitive map of the environment and the relationships between landmarks (e.g., "the library is north of the town hall"). This is particularly vulnerable to early AD pathology [21] [30].
Quantitative Evidence Linking VR Metrics to AD Biomarkers
Recent research provides a compelling evidence base for VR navigation as a surrogate marker. The following table summarizes key quantitative findings from a recent study that correlated VR path integration (PI) errors with established AD plasma biomarkers in 111 healthy adults.
Table 1: Correlations Between VR Path Integration Errors and Alzheimer's Disease Biomarkers [12] [18]
| Variable | Correlation with PI Errors | Statistical Significance | Notes |
|---|---|---|---|
| Age | Significant positive correlation | p < 0.001 | PI errors increase with age, commencing around age 50 [12]. |
| Plasma GFAP | Significant positive correlation | p = 0.0332 | GFAP is a marker of astrocytic activation. |
| Plasma p-tau181 | Significant positive correlation | p = 0.0128 | Identified as the most significant predictor of PI errors via machine learning ranking [12]. |
| Plasma NfL | Significant positive correlation | Not specified | NfL is a marker of neuronal injury. |
| ApoE ε4 allele | Positive association | p = 0.037 | The major genetic risk factor for late-onset AD. |
| Entorhinal Cortex Thickness | Negative correlation | Not significant after age adjustment | Thinner cortex was associated with higher PI errors, but age was a confounding factor. |
Application Notes: Protocols for Accessible VR Task Design
Participant Screening and Inclusion Protocol
Objective: To identify eligible participants while accounting for factors that may affect VR usability and task performance.
- Pre-Screening:
- Administer standard cognitive tests (e.g., MMSE, MoCA) to characterize the cohort. For example, studies may exclude participants with MMSE < 26 or ACE-R total scores < 89 to focus on pre-clinical populations [12] [18].
- Assess for medical history of stroke, neurological/psychiatric disorders, and severe uncorrected visual or auditory impairments.
- Use the Geriatric Depression Scale (GDS-15) to account for the influence of mood [18].
- Informed Consent:
- The consent process must be adapted for clarity. Use simplified language, provide ample time for questions, and assess comprehension verbally.
- Explicitly state the right to withdraw at any time without penalty, especially if experiencing cybersickness.
Usability and Accessibility Evaluation Protocol (Adapted from Cognitive Walkthrough)
Objective: To proactively identify and rectify usability barriers in the VR software from the perspective of a first-time user with varying cognitive abilities [53].
- Method: Conduct a formative evaluation using cognitive walkthroughs with key stakeholders, including occupational therapists and neuropsychologists, as well as individuals with MCI where safe and appropriate.
- Procedure: Participants are guided through a script of tasks while observers document their actions, verbalizations, and difficulties.
- Key Tasks to Evaluate [53]:
- Reviewing the user manual for clarity.
- Donning and calibrating the Head-Mounted Display (HMD) and controllers.
- Navigating the software's main menu and selecting a task.
- Understanding in-task instructions and feedback.
- Performing basic interactions (e.g., using a joystick to move, selecting objects).
- Data Collection: Use a standardized observation sheet to record:
- Success/Failure at each subtask.
- Number and type of errors.
- Need for external assistance.
- Participant's subjective feedback and signs of frustration or confusion.
- Outcome Metric: Calculate an ease-of-use score (e.g., on a 5-point scale from 1=very easy to 5=very difficult) for each task to prioritize design refinements [53].
Accessible VR Design and In-Task Protocol
Objective: To implement specific design features that support users with diverse cognitive and sensory abilities.
Pre-Task Session:
- Equipment Fitting: Provide clear, step-by-step verbal and visual instructions for putting on the HMD. Use disposable face masks for hygiene [53].
- Seated Position: Conduct the task with the participant seated in a comfortable, swivel chair to minimize fall risk and vestibular conflict [21].
- Interactive Tutorial: Implement a mandatory, self-paced practice session within the VR environment. This allows users to familiarize themselves with locomotion, interaction mechanics, and the virtual interface without the pressure of being assessed [21].
Interface and Interaction Design:
- Visual Design:
- Color and Contrast: Ensure a minimum contrast ratio of 4.5:1 for text and critical elements. Avoid relying solely on color to convey information; supplement with symbols or textures. Overly saturated colors can cause eye strain; use them sparingly for key interactive elements [54] [55].
- Text and Icons: Use large, high-contrast, sans-serif fonts. Pair text with intuitive icons.
- Interaction Modalities:
- Input Methods: Support multiple forms of input, such as handheld controllers and voice commands, to accommodate different motor abilities [55].
- Interaction Simplicity: Design large clickable areas and avoid gestures that require high precision or strength. Consider gaze-based selection as an alternative [55].
- Adaptive Difficulty: Design the navigation task with multiple, pre-configured difficulty levels (e.g., by varying the number of landmarks, path complexity, or retention interval). This allows researchers to tailor the task to the individual's ability level, preventing floor or ceiling effects [21] [30].
- Visual Design:
Mitigating Cybersickness:
- A significant portion of participants (e.g., 9 out of 140 in one study) may be unable to complete the task due to VR-induced sickness [12].
- Protocol: Actively monitor for signs of discomfort. Provide clear instructions that the task can be paused or stopped immediately. Allow for frequent, mandatory breaks.
- Technical Adjustments: Ensure a high, stable frame rate. Use comfort modes for locomotion (e.g., "snap turning" instead of smooth rotation) that can be enabled or disabled.
The Researcher's Toolkit: Essential Materials and Reagents
Table 2: Key Research Reagent Solutions for VR-Based Spatial Navigation Research
| Item | Specification / Example | Primary Function in Research |
|---|---|---|
| VR Hardware Platform | Meta Quest 2/3, HTC VIVE Pro | Provides the immersive visual and interactive experience. Commercial off-the-shelf (COTS) headsets enhance accessibility and translational potential [12] [21]. |
| VR Spatial Navigation Software | Custom-built task (e.g., in Unity Game Engine) | Presents the navigational paradigm, records behavioral data (e.g., path trajectories, errors, completion time), and provides standardized stimuli [21]. |
| Plasma Biomarker Assay Kits | GFAP, NfL, Aβ40, Aβ42, p-tau181 | Provides molecular validation for correlative analysis with VR behavioral metrics, strengthening the biomarker claim [12] [18]. |
| Apolipoprotein E (ApoE) Genotyping Kit | PCR-based genotyping | Identifies genetic risk (ApoE ε4 allele) for stratified analysis and to study gene-behavior interactions [12] [18]. |
| Structural MRI Protocol | 3T MRI, T1-weighted sequence | Quantifies structural integrity of navigation-related brain areas (e.g., entorhinal cortex, hippocampal volume) for multimodal correlation [12] [18]. |
| Standardized Neuropsychological Batteries | MMSE, MoCA-J, ACE-R | Characterizes the cognitive status of the participant cohort and provides a baseline for comparing VR task performance [12] [18]. |
Experimental Workflow and Data Integration
The following diagram illustrates the integrated workflow for conducting an accessible VR navigation study, from participant recruitment to data synthesis.
Data Security and Patient Privacy in Cloud-Based VR Applications
The integration of cloud-based Virtual Reality (VR) applications into Alzheimer's disease research represents a transformative advancement for early detection methodologies, particularly in spatial navigation tasks. These immersive technologies enable the collection of highly granular behavioral data, offering unprecedented sensitivity in identifying preclinical cognitive markers [19] [48]. However, this capability introduces significant data security and patient privacy imperatives. VR systems for Alzheimer's research process multifaceted datasets encompassing performance metrics, voice interactions, physiological responses, and precise movement tracking—all constituting protected health information (PHI) under regulations like HIPAA and GDPR [56]. The confidentiality of this data is paramount, as breaches could compromise patient anonymity and erode the trust essential for longitudinal research. Furthermore, the cloud-based architecture necessary for scalable data storage and advanced artificial intelligence (AI) analytics expands the attack surface, requiring robust security frameworks specifically designed for the unique vulnerabilities of immersive healthcare applications [57] [56]. This document outlines comprehensive application notes and protocols to ensure that security and privacy are foundational components of VR-based Alzheimer's research initiatives.
Quantitative Analysis of Security Frameworks and Threats
A comparative analysis of existing security frameworks and documented vulnerabilities provides a foundation for developing robust protections in VR research environments.
Table 1: Comparative Analysis of Healthcare Data Security Frameworks Relevant to VR Research
| Regulatory Framework | Core Jurisdiction | Key Security Requirements | Direct Application to VR Research Data |
|---|---|---|---|
| Health Insurance Portability and Accountability Act (HIPAA) [56] | United States | Access controls, encryption of ePHI, breach notification protocols. | Mandates encryption for VR-collected biometric and performance data during storage and transmission. |
| General Data Protection Regulation (GDPR) [56] | European Union | Explicit consent, data minimization, comprehensive technical/organizational safeguards. | Governs processing of EU subjects' VR data, requiring clear consent for data collection and AI analysis. |
| California Consumer Privacy Act (CCPA) [56] | California, USA | Consumer rights to access, delete, and opt-out of data sale; security requirements. | Provides research participants with rights over their VR-derived behavioral data. |
| Institutional Security Protocols (e.g., from [57]) | Research Institutions | Role-Based Access Control (RBAC), Intrusion Detection Systems (IDS), AES encryption. | Technical implementation for securing the VR data pipeline from headset to cloud analytics. |
Table 2: Documented Data Security Vulnerabilities and Mitigation Strategies in Digital Health
| Vulnerability / Breach Case | Data Type Compromised | Reported Impact | Proposed Mitigation for VR Systems |
|---|---|---|---|
| Anthem Inc. Breach [56] | Personal identifiers, health records. | Exposed ePHI of 79 million individuals. | Implementation of end-to-end encryption and strict access controls modeled on [57]. |
| WannaCry Ransomware (NHS) [56] | Patient health records, hospital systems. | Disrupted critical healthcare services. | Regular security patches, network segmentation, and robust backup systems for VR data servers. |
| SingHealth Breach [56] | Personal data of 1.5 million patients. | Unauthorized access and exfiltration of records. | Multi-factor authentication and continuous monitoring via IDS as advocated in integrated frameworks [57]. |
| Theoretical VR-Specific Risk: Spatial Data Inference | VR navigation paths and cognitive performance. | Re-identification of participants through unique behavioral patterns. | Data anonymization and aggregation techniques that mask individual navigation signatures before cloud storage. |
Experimental Protocols for Security and Validation Testing
Implementing these protocols is essential for validating both the security posture and functional integrity of cloud-based VR research systems.
Protocol 1: Security Penetration Testing for VR Data Pipelines
Objective: To proactively identify and remediate vulnerabilities in the end-to-end data flow of a cloud-based VR application for Alzheimer's research.
Materials:
- VR Headset with integrated sensors (e.g., Oculus Rift S) [58].
- Client-side application (e.g., built in Unity engine) [57].
- Secure backend cloud database (e.g., with AES-256 encryption) [57].
- Network packet analyzer (e.g., Wireshark).
- Penetration testing toolkit (e.g., Metasploit).
Methodology:
- Data Transmission Security Test:
- Procedure: Capture data packets transmitted from the VR headset to the cloud server during a spatial navigation task. Analyze the packets to verify the implementation and strength of encryption (e.g., TLS 1.2+).
- Success Metric: 100% of data packets containing PHI are encrypted in transit, with no plaintext leakage of sensitive data.
- Authentication and Access Control Test:
- Procedure: Use credentialed researcher accounts with varying permission levels (e.g., Principal Investigator, Data Analyst). Attempt to access datasets outside of assigned permissions via the application programming interface (API). Test for privilege escalation vulnerabilities.
- Success Metric: RBAC system correctly enforces permissions, returning "access denied" errors for all unauthorized requests.
- Cloud Storage Integrity Test:
- Procedure: Verify that data at rest in cloud storage is encrypted using AES-256. Attempt to access storage volumes directly, bypassing the application's security layer.
- Success Metric: Data is inaccessible without proper decryption keys managed by the security framework.
- Intrusion Detection System (IDS) Test:
- Procedure: Simulate a malicious intrusion attempt (e.g., SQL injection) against the cloud database. Monitor the IDS for alerts and automated response actions.
- Success Metric: IDS generates an alert within a pre-defined time threshold (e.g., <5 minutes) and triggers a configured mitigation action [57].
Protocol 2: Validation of Privacy-Preserving Data Processing
Objective: To ensure that data anonymization and processing protocols comply with GDPR and HIPAA principles of data minimization and privacy.
Materials:
- Anonymization software toolkit.
- De-identified dataset from a VR spatial navigation task (e.g., object location memory task [48]).
- Data analysis environment (e.g., Python with SciPy library [58]).
Methodology:
- Data Anonymization Procedure:
- Procedure: Immediately upon data receipt from the VR client, remove all direct identifiers (e.g., name, email, IP address). Replace with a randomly generated participant code. Apply techniques to reduce re-identification risk from spatial navigation data, such as adding minimal random noise to precise movement coordinates.
- Validation Check: A third-party auditor attempts to re-identify individuals from the processed dataset using any available metadata. The procedure is successful if re-identification is not possible.
- Differential Privacy Implementation:
- Procedure: For aggregate data used in open-source scientific publications, apply differential privacy algorithms. This adds carefully calibrated statistical noise to the results, preventing the deduction of any single individual's information while preserving the accuracy of population-level trends.
- Validation Check: Statistical analysis confirms that the noisy aggregate data maintains scientific validity (e.g., p-values for group differences remain significant) while mathematically guaranteeing individual privacy.
The Scientist's Toolkit: Essential Research Reagent Solutions
Table 3: Key Materials and Tools for Secure VR Alzheimer's Research
| Item / Solution | Function in Research | Security & Privacy Relevance |
|---|---|---|
| Unity Game Engine [57] | Development platform for creating immersive VR spatial navigation tasks (e.g., virtual rooms, corridors). | Allows integration of encryption SDKs for data handling at the point of capture. |
| Oculus Rift S (HMD) [58] | Head-Mounted Display providing the immersive visual and auditory interface for participants. | Sensor data (head tracking, hand controllers) must be treated as PHI and secured. |
| Azure Voice SDK [57] | Enables bilingual voice interaction for intuitive user commands and AI companionship. | Voice recordings are highly sensitive; requires explicit consent and secure processing. |
| AES-256 Encryption Library [57] | Cryptographic standard for encrypting data both during transmission and while stored in the cloud. | Fundamental technical safeguard for ensuring data confidentiality and integrity. |
| Role-Based Access Control (RBAC) System [57] | Manages permissions for researchers accessing the cloud database. | Critical organizational control to ensure only authorized personnel can view or export patient data. |
| Intrusion Detection System (IDS) [57] | Monitors network traffic to and from the cloud server for suspicious patterns. | Provides continuous monitoring and early warning of potential security breaches. |
System Architecture and Data Flow Visualization
The following diagrams illustrate the secure architecture and data lifecycle for a cloud-based VR research application.
Diagram 1: Secure System Architecture for a cloud-based VR application, showing protected data flow from participant to researcher.
Diagram 2: Data Security Workflow detailing the sequential steps for protecting patient data throughout the research lifecycle.
The application of Virtual Reality (VR) spatial navigation tasks as cognitive biomarkers for early Alzheimer's disease (AD) detection represents a paradigm shift in neuropsychological research. However, the lack of standardized reporting and methodological consistency across studies threatens the validity, replication, and clinical translation of these promising digital biomarkers. The rapid emergence of extended reality (XR) technologies in healthcare has outpaced the development of methodological frameworks to ensure scientific rigor. Existing research often lacks proper controls, standardization, and transparent reporting, making comparisons between studies challenging and potentially compromising their ecological validity [59] [60] [61]. To address these critical gaps, the international consensus guideline "Reporting for the early-phase clinical evaluation of applications using extended reality" (RATE-XR) provides a structured framework for transparent reporting in early-phase XR clinical evaluations [59] [60]. This framework is particularly crucial for VR navigation research in AD, where subtle spatial navigation impairments detected through path integration (PI) errors may serve as among the earliest behavioral markers of entorhinal cortex pathology, preceding clinical symptoms by years [12] [46]. By adopting standardized reporting guidelines like RATE-XR, researchers can enhance methodological transparency, facilitate cross-study comparisons, and accelerate the validation of VR navigation as a sensitive, non-invasive tool for early AD detection.
The RATE-XR Reporting Framework
Development and Core Principles
The RATE-XR guideline was developed through a robust, consensus-based methodology involving diverse stakeholder categories. The development process involved a two-round modified Delphi process with international experts from 17 predefined stakeholder groups, including clinicians, researchers, methodologists, engineers, ethicists, and patient representatives [60] [62]. This comprehensive approach ensured that the guideline addresses the multifaceted challenges specific to XR clinical evaluations. The guideline comprises 17 XR-specific items (composed of 18 subitems) and 14 generic reporting items, each accompanied by detailed Explanation & Elaboration sections [59].
The core philosophy of RATE-XR emphasizes transparency, patient-centeredness, and balanced evaluation of XR applications in healthcare. It specifically addresses the unique challenges of early-phase XR research, including: the rapidly evolving nature of XR hardware and software; technical errors impacting reliability; ethical considerations in early research stages; user variability and familiarity with XR technology; and the absence of established methodologies [60]. For AD researchers utilizing VR navigation paradigms, this framework provides crucial guidance for reporting the technological implementation, methodological considerations, and human factors that might influence study outcomes and their interpretation.
Key Reporting Items for VR Navigation Research
Table 1: Essential RATE-XR Reporting Items for VR Navigation Studies in Alzheimer's Detection
| Reporting Category | Specific Item | Application to VR Navigation Research |
|---|---|---|
| XR System Description | Hardware specifications | Report HMD model (e.g., Meta Quest 2), compute system, tracking technology [12] |
| Software environment | Detail game engine (e.g., Unity), rendering pipeline, navigation interaction techniques [63] | |
| Content description | Describe virtual environment, tasks, and narrative elements [12] [64] | |
| Clinical Utility | Intended clinical use | Specify target population (e.g., preclinical AD) and context of use [12] [46] |
| Clinical endpoints | Define primary cognitive outcomes (e.g., path integration errors) [12] | |
| Safety | Adverse events | Report VR-induced sickness (9/140 participants in recent study [12]) |
| Mitigation strategies | Describe protocols for minimizing cybersickness [60] | |
| Human Factors | User characteristics | Document prior VR experience, age, sensory abilities [60] |
| Usability assessment | Report task completion rates, subjective feedback [65] | |
| Ethical Considerations | Patient-centeredness | Involve patients and clinicians in design process [60] |
| Data privacy | Address biometric data collection and protection [60] |
Application to VR Spatial Navigation for Alzheimer's Detection
Current Research Landscape
Recent research has demonstrated the considerable potential of VR spatial navigation tasks for early AD detection. A 2025 study by Shima et al. examined 111 healthy adults using a head-mounted 3D VR system to assess path integration (PI) errors in relation to established AD biomarkers [12] [46]. The researchers found significant positive correlations between PI errors and plasma biomarkers including GFAP (t-value = 2.16, p = 0.0332), p-tau181 (t-value = 2.53, p = 0.0128), and NfL levels [12]. Through multivariate analysis and machine learning approaches, they identified plasma p-tau181 as the most significant predictor of PI errors, suggesting that PI quantified by 3D VR navigation systems may serve as a valuable surrogate diagnostic tool for detecting early AD pathophysiology [46].
The biological rationale for this approach stems from the neuropathology of AD, which begins in the entorhinal cortex (EC)—a critical brain region for spatial navigation and path integration [12]. The EC contains grid cells that form part of the brain's navigation system, encoding self-location through path integration, which enables calculation of one's current position by continuously updating head orientation and movement over time using self-motion cues [12]. As neurofibrillary tangles initially accumulate in the EC in early AD, subtle navigation impairments detectable through sophisticated VR paradigms may emerge before overt cognitive symptoms [12] [46].
Critical Methodological Considerations
Table 2: Quantitative Findings from Recent VR Navigation Studies in Alzheimer's Research
| Study Reference | Participant Characteristics | VR Navigation Task | Key Quantitative Findings | Correlation with Biomarkers |
|---|---|---|---|---|
| Shima et al., 2025 [12] | 111 healthy adults (22-79 years) | Head-mounted VR path integration | PI errors increased with age; significant correlations with plasma biomarkers | GFAP (t=2.16, p=0.033); p-tau181 (t=2.53, p=0.013) |
| Comparison Study [61] | Across adult lifespan | Virtual vs. real environment navigation | VR involved longer distances, more errors, longer completion times | N/A |
| AR vs. VR Study [66] | Healthy participants & epilepsy patients | Treasure Hunt spatial memory task | Significantly better memory performance when walking (AR) vs. stationary (VR) | N/A |
When implementing VR navigation paradigms for AD research, several methodological considerations require careful attention through the RATE-XR framework:
Ecological Validity vs. Experimental Control: Studies directly comparing navigation in identical real-world and virtual environments have found significant differences in multiple measures, including distance covered, number of errors, task completion time, and perceived cognitive workload [61]. While these differences don't negate the value of VR approaches, they highlight the importance of transparent reporting about these limitations and caution when generalizing findings to real-world navigation abilities.
Physical Movement Integration: Research demonstrates that spatial memory performance is significantly better when participants physically walk during tasks compared to stationary VR navigation [66]. This has important implications for AD detection paradigms, as physical movement provides idiothetic cues (vestibular, proprioceptive) that are integrated with visual information for accurate spatial navigation—precisely the functions subserved by the entorhinal-hippocampal network vulnerable early in AD.
Navigation Metaphor Selection: The choice of navigation technique (teleportation, flying, walking) significantly impacts user experience and potentially cognitive performance [63]. Each metaphor engages different cognitive processes and may vary in sensitivity to early AD-related navigation deficits.
Detailed Experimental Protocol for VR Navigation Assessment
Participant Selection and Preparation
Inclusion/Exclusion Criteria: Following the approach by Shima et al., participants should be comprehensively screened using standard cognitive assessments (e.g., MMSE, ACE-R, MoCA-J) with established cutoffs (MMSE ≥26, ACE-R ≥89) to exclude those with cognitive impairment [12]. Medical history should be obtained to exclude participants with neurological or psychiatric disorders, stroke history, or conditions contraindicating VR use [12].
Pre-test Procedures: After obtaining written informed consent, participants should undergo baseline cognitive assessment, followed by blood collection for AD biomarkers (GFAP, NfL, Aβ40, Aβ42, p-tau181) and ApoE genotyping if applicable [12]. The VR equipment should be carefully fitted, with interpupillary distance adjusted for each participant. A structured adaptation period in a neutral virtual environment is recommended to acclimatize participants to the VR system and minimize cybersickness.
Ethical Considerations: The protocol should receive approval from an institutional ethics committee, and participants must provide written informed consent with explicit permission for collection of biometric and movement data [12] [60]. Participants should be informed of their right to withdraw at any point, and researchers should have a clear protocol for managing VR-induced sickness, including immediate suspension of the test if significant discomfort occurs.
VR Navigation Task Implementation
Apparatus Specification: The system should be precisely documented according to RATE-XR guidelines. The Shima et al. study used Meta Quest 2 HMDs displaying a 20-virtual meter diameter arena with 3vm high walls [12]. Movement was controlled via joystick, with forward/backward movement mapped to joystick control and lateral movements requiring physical rotation [12]. This specific technical configuration should be clearly reported to enable replication.
Path Integration Task Protocol: The navigation task should be designed to specifically assess path integration ability, which involves calculating one's current position by continuously updating self-motion cues, independent of external landmarks [12]. Participants should complete practice trials to ensure task comprehension. The main task involves discrete trials where participants navigate to hidden targets using only self-motion cues, with PI error quantified as the distance between the participant's final position and the target location.
Data Collection Parameters: The following quantitative measures should be systematically recorded: (1) Primary endpoint: Path integration error (distance in virtual meters between actual and estimated position); (2) Secondary measures: Time to completion, velocity profiles, head rotation patterns, and navigation strategy; (3) Subjective measures: Cybersickness symptoms, perceived task difficulty, and strategy questionnaires [12] [61].
Data Analysis and Interpretation
Primary Statistical Analysis: Multivariate linear regression should be used to assess the relationship between PI errors and biomarker levels, adjusting for potential confounders such as age [12]. Machine learning approaches (e.g., predictor importance ranking) can identify the most significant predictors of navigation performance [12].
Correlational Analysis: Correlation analyses should examine relationships between PI errors and specific AD biomarkers, with statistical significance determined at p<0.05. The Shima et al. study found plasma p-tau181 to be the most significant predictor of PI errors using this approach [12] [46].
Quality Control and Exclusion Criteria: Predefined criteria should be established for data exclusion, such as technical failures, protocol deviations, or excessive cybersickness (e.g., 9/140 participants excluded for VR-induced sickness in the Shima et al. study) [12]. These exclusions should be clearly reported following RATE-XR guidelines for transparency.
The Scientist's Toolkit: Essential Research Reagents and Materials
Table 3: Essential Research Materials for VR Navigation Studies in Alzheimer's Research
| Category | Specific Item | Function/Purpose | Example Specifications |
|---|---|---|---|
| XR Hardware | Head-Mounted Display (HMD) | Presents immersive virtual environment | Meta Quest 2 (2880 × 1600 resolution) [12] [65] |
| Motion Tracking System | Captures head and body movements | Inside-out tracking (Quest 2) or external sensors [12] | |
| Input Device | Enables navigation control | Joystick controller, hand tracking [12] [65] | |
| Software Platforms | Game Engine | Creates and renders virtual environment | Unity 3D with Mapbox SDK [65] [63] |
| XR Development Framework | Implements XR interactions | WebXR, OpenXR [63] | |
| Data Collection System | Logs behavioral metrics | Custom Unity scripts, LSLab [12] | |
| Assessment Tools | Cognitive Batteries | Screens for cognitive impairment | MMSE, ACE-R, MoCA-J [12] |
| Biomarker Assays | Provides pathological correlation | Plasma p-tau181, GFAP, NfL [12] [46] | |
| Cybersickness Scale | Monitors adverse effects | Simulator Sickness Questionnaire [12] | |
| Analysis Resources | Statistical Packages | Analyzes behavioral and biomarker data | R, Python with scikit-learn [12] |
| Spatial Analysis Tools | Quantifies navigation patterns | Custom MATLAB/Python scripts [12] |
The adoption of standardized reporting guidelines like RATE-XR represents a critical step toward establishing VR spatial navigation as a validated digital biomarker for early Alzheimer's disease detection. By ensuring comprehensive reporting of XR systems, methodological approaches, human factors, and ethical considerations, researchers can enhance the reliability, reproducibility, and clinical translation of their findings. The compelling correlation between path integration errors and AD-specific biomarkers such as p-tau181 underscores the potential of VR navigation paradigms to detect the earliest stages of AD pathology, potentially enabling intervention before significant cognitive decline occurs [12] [46].
Future research directions should include: (1) longitudinal studies tracking the progression of navigation impairments in relation to biomarker changes and cognitive decline; (2) multi-center validation studies using standardized VR paradigms to establish normative data and diagnostic cutoffs; (3) integration of VR navigation assessment with other digital biomarkers for improved sensitivity and specificity; and (4) development of adaptive VR tests that can dynamically adjust difficulty based on participant performance. Throughout these research endeavors, consistent application of reporting standards like RATE-XR will be essential for building a robust evidence base and ultimately translating VR navigation assessment from research tools to clinically validated diagnostic instruments.
Adaptive Task Difficulty and Bilingual Interfaces for Broader Global Trial Inclusion
Application Note: Rationale and Scientific Foundation
Incorporating adaptive task difficulty and bilingual interfaces into Virtual Reality (VR) spatial navigation tasks is critical for enhancing the validity, inclusivity, and global reach of clinical research for early Alzheimer's disease (AD) detection. These features directly address key methodological challenges in participant engagement, performance measurement, and cultural applicability.
The Imperative for Adaptive Task Difficulty
Cognitive training efficacy is controversial, with transfer of training gains to untrained tasks being a particular point of contention. A key factor mediating this transfer is adaptive task difficulty [67] [68].
- Neural Plasticity and Transfer: Evidence from functional MRI studies demonstrates that adaptive training, where task difficulty dynamically increases in response to user performance, results in broader transfer of training gains and changes in brain activity associated with more efficient processing. Specifically, adaptive training of working memory updating has been shown to produce far transfer to an untrained episodic memory task and is associated with activation decreases in the striatum and hippocampus [67] [68]. This suggests improved neural efficiency.
- The Challenge Point Framework: The theoretical basis for adaptivity is provided by the Challenge Point Framework, which posits that learning is optimized when there is a prolonged mismatch between environmental demand and functional supply. Adaptive algorithms maintain this "optimal" challenge level, preventing boredom from tasks that are too easy and frustration from tasks that are too difficult [69]. This is essential for maintaining participant engagement across varying levels of cognitive ability, from healthy aging to Mild Cognitive Impairment (MCI).
The Case for Bilingual and Multi-Modal Interfaces
To ensure global trial inclusivity and ecological validity, assessment tools must be accessible to diverse populations.
- Overcoming Digital Literacy Barriers: Systematic reviews on age-friendly design highlight that features like voice interaction are essential for improving usability and accessibility for older adults, who may face challenges with complex navigation systems and small touch targets [70].
- Enhancing Engagement and Cultural Relevance: Research on VR applications for AD demonstrates that bilingual interaction (e.g., English and Arabic) is a significant contributor to user engagement and emotional comfort. Tailoring the language and cultural content of an AI companion within a VR system leads to higher patient satisfaction and improved subjective mood [71]. Personalized, multi-modal interfaces that combine speech, touch, and gesture have been shown to enhance usability by 30% for older adults [72].
Protocol for Implementing an Adaptive VR Spatial Navigation Task
This protocol outlines the methodology for deploying a VR-based spatial navigation task with integrated adaptive difficulty and bilingual capabilities, suitable for global trials targeting early AD detection.
Core System Components and Research Reagents
Table 1: Essential Research Reagents and Technical Solutions
| Item Name | Type/Category | Brief Function Description |
|---|---|---|
| VR Head-Mounted Display (HMD) | Hardware | Provides an immersive, visually interactive environment for administering spatial navigation tasks. |
| Inertial Measurement Units (IMUs) | Hardware/Sensor | Tracks trunk posture and movement kinematics to monitor physical engagement and potential compensatory strategies [69]. |
| Voice Recognition SDK (e.g., Azure) | Software | Enables hands-free, bilingual interaction (e.g., English/Arabic) between the participant and the virtual system, improving accessibility [71]. |
| AI-Powered Companion Avatar | Software/Interface | Provides emotional support, task instructions, and engagement in the participant's native language, reducing feelings of isolation [71]. |
| Spatial Orientation Test (SOIVET) | Software/Task | A validated immersive VR task battery for assessing allocentric and egocentric spatial orientation, which is ecologically valid for detecting early AD deficits [73]. |
| Adaptive Difficulty Algorithm | Software/Logic | Dynamically adjusts task complexity (e.g., number of updating operations, path complexity) based on real-time user performance to maintain an optimal challenge level [67] [68] [69]. |
Quantitative Foundations for Adaptive Difficulty and Spatial Navigation
Table 2: Key Empirical Findings Supporting Protocol Design
| Concept | Quantitative/Experimental Findings | Relevance to Protocol |
|---|---|---|
| Adaptive Task Difficulty | Adaptive Working Memory Updating (WMU) training resulted in transfer to an untrained episodic memory task and activation decreases in striatum and hippocampus [67] [68]. | Justifies the implementation of a performance-based algorithm for spatial navigation tasks to promote neural plasticity and far transfer. |
| Spatial Navigation in AD | Individuals with AD and MCI due to AD present deficits in both allocentric and egocentric navigation strategies, with allocentric deficits appearing earlier in the preclinical stages [5] [30]. | Informs the choice of spatial tasks; the protocol must dissociate and measure both navigation strategies. |
| Tolerability of Immersive VR | Studies with the SOIVET tasks found a strong sense of presence and manageable cybersickness scores (e.g., M=4.19, SD=5.576 on a cybersickness questionnaire) in adults, with drop-outs being a rare occurrence [73]. | Supports the feasibility of using immersive VR with older adult populations, provided tolerability is monitored. |
| Multi-modal Personalization | Personalized multi-modal interfaces have been shown to enhance usability by 30% for older adults and facilitate independent living for those with MCI [72]. | Validates the inclusion of voice, simple gestures, and personalized AI companions to boost adherence and data quality. |
Detailed Experimental Workflow
The following diagram illustrates the logical workflow and integration of core system components within a single participant session.
Protocol Steps:
Participant Onboarding and Consent:
- Obtain informed consent, explaining the VR equipment and the potential for cybersickness.
- Administer a motion sickness history screening questionnaire [73] to identify susceptible individuals.
System Configuration and Baseline Assessment:
- Bilingual Interface Setup: The participant selects their preferred language (e.g., English or Arabic) for all system instructions and the AI companion's interactions [71].
- Baseline Profiling: Collect basic demographic data and, if applicable, a brief cognitive status assessment.
Task Execution with Adaptive Logic:
- The participant dons the VR HMD and enters the virtual environment (e.g., a maze or a route-learning cityscape [73]).
- The system presents a spatial navigation task, such as finding a hidden goal (assessing allocentric memory) or retracing a learned route (assessing egocentric memory) [5] [30].
- Real-Time Performance Monitoring: The system continuously records key metrics: navigation errors, time to completion, and path efficiency.
- Adaptive Algorithm Operation: A performance-based algorithm, rooted in the Challenge Point Framework [69], analyzes the data. The logic can be summarized as follows:
- IF performance accuracy over the last N trials > upper threshold THEN increase difficulty (e.g., add more landmarks, increase maze complexity, or extend the retention interval).
- IF performance accuracy < lower threshold THEN decrease difficulty.
- ELSE maintain current difficulty level.
- AI Companion Interaction: The virtual AI companion provides context-aware, bilingual feedback based on performance (e.g., encouragement after a failure, confirmation of success) to maintain emotional comfort and engagement [71].
Post-Session Data Handling and Analysis:
- Tolerability Assessment: Administer a cybersickness questionnaire (e.g., based on the Simulator Sickness Questionnaire [73]) immediately after the session.
- Data Export: Aggregate and anonymize all performance data, including the trial-by-trial difficulty level, for analysis. Key outcome variables should include learning curves, final achieved difficulty level, and metrics dissociating allocentric vs. egocentric navigation performance [5] [30].
This integrated protocol ensures that the cognitive demand is personalized for each participant, maximizing engagement and the sensitivity of the task to detect subtle cognitive changes, while the bilingual interface ensures the tool is valid and accessible across diverse global populations.
Validating VR Navigation Against Established Biomarkers and Traditional Cognitive Tests
Application Notes
Rationale and Scientific Context
The early detection of Alzheimer's disease (AD) pathophysiology is crucial for implementing timely therapeutic interventions. Neurofibrillary tangles in AD originate in the entorhinal cortex, a brain region essential for spatial navigation and path integration (PI)—the process of using self-motion cues to calculate one's position [18] [46]. Virtual Reality (VR) navigation tasks directly probe this early affected neural circuit, providing a functional measure that can precede overt cognitive symptoms. Recent advances in ultrasensitive blood-based biomarker assays now allow for the correlation of these functional navigation deficits with specific molecular pathologies, namely phosphorylated tau (p-tau181), glial fibrillary acidic protein (GFAP), and neurofilament light chain (NfL) [18] [74] [75]. This combination of digital and molecular biomarkers offers a powerful, non-invasive approach for identifying individuals in the preclinical stages of AD.
Key Quantitative Findings
The following table summarizes core quantitative relationships observed between VR navigation errors and plasma biomarkers, primarily derived from a study of 111 healthy adults (aged 22-79) [18] [46].
Table 1: Key Correlations between VR Path Integration Errors and Plasma Biomarkers
| Analysis Type | Biomarker / Factor | Statistical Result | Interpretation |
|---|---|---|---|
| Univariate Correlation | p-tau181 | Significant positive correlation | Higher p-tau181 levels are associated with greater navigation errors. |
| Univariate Correlation | GFAP | Significant positive correlation | Higher GFAP levels are associated with greater navigation errors. |
| Univariate Correlation | NfL | Significant positive correlation | Higher NfL levels are associated with greater navigation errors. |
| Multivariate Linear Regression | GFAP | t-value = 2.16, p = 0.0332 | GFAP is an independent predictor of PI errors after accounting for other factors. |
| Multivariate Linear Regression | p-tau181 | t-value = 2.53, p = 0.0128 | p-tau181 is an independent predictor of PI errors after accounting for other factors. |
| Machine Learning Predictor Importance | p-tau181 | Ranked as the most significant predictor | p-tau181 was identified as the strongest biomarker for predicting path integration performance. |
| ApoE ε4 & p-tau181 Interaction | ApoE ε4 allele | Coefficient = 0.650, p = 0.037 | The presence of an ApoE ε4 allele is associated with increased PI errors. |
| p-tau181 | Coefficient = -0.899, p = 0.041 | The association between p-tau181 and PI errors may be modulated by ApoE status. | |
| ROC Analysis | PI Error (≥5 vm) | Reliably flagged elevated p-tau181 | A navigation error threshold of ~5 virtual meters showed utility in identifying individuals with high p-tau181 [76]. |
Table 2: Biomarker Performance Across the Alzheimer's Disease Continuum
| Biomarker | Primary Pathological Association | Representative Finding (SCD vs. AD) | Representative Finding (MCI vs. AD) |
|---|---|---|---|
| p-tau181 | Tau pathology (neurofibrillary tangles) | p = 0.001 [74] | p = 0.026 [74] |
| GFAP | Astrocytic activation (reactive astrogliosis) | p = 0.003 [74] | p = 0.032 [74] |
| NfL | Neuroaxonal injury / neurodegeneration | p < 0.001 [74] | p = 0.002 [74] |
The integration of VR-derived path integration errors with plasma biomarkers, particularly p-tau181, creates a sensitive and specific combinatorial biomarker for early AD neurodegeneration [18] [75]. This hierarchical approach—using a non-invasive functional test to identify individuals who should subsequently undergo blood-based biomarker testing—holds significant promise for improving the accessibility and affordability of large-scale preclinical AD screening. This strategy paves the way for earlier enrollment in clinical trials and more timely therapeutic interventions.
Experimental Protocols
Protocol 1: VR Path Integration Assessment
Objective: To quantify path integration (spatial navigation) ability in a controlled, immersive virtual environment devoid of external landmarks.
Equipment and Reagents:
- Head-Mounted Display (HMD): Meta Quest 2 or equivalent HMD with integrated head-tracking [76].
- Software: Custom VR application designed for path integration assessment.
- Virtual Environment: A large, circular, featureless virtual arena (e.g., 90-meter diameter) [18].
- Input Device: Standard joystick or HMD-integrated controllers for navigation.
Procedure:
- Participant Setup: Seat the participant in a quiet, distraction-free room. Properly fit the HMD and ensure they are comfortable with the joystick/controller.
- Task Instruction: Inform the participant that they will be placed in a virtual arena. Their task is to navigate to two sequentially flagged locations and then return as accurately as possible to the starting point.
- Encoding Phase: The participant uses the joystick to navigate to the first flag. Upon reaching it, the flag disappears, and a second flag appears. They then navigate to the second flag.
- Recall/Testing Phase: After the second flag disappears, the participant is instructed to navigate directly back to the original starting point using the shortest path possible. No visual cues are present during this return leg.
- Data Recording: The VR software automatically records the Euclidean distance (in virtual meters) between the participant's final stopping position and the true starting point. This is the path integration error.
- Task Repetition: The task is typically repeated over multiple trials to obtain a stable average performance metric [18] [76].
Analysis:
- The primary outcome measure is the mean path integration error across all trials.
- Participants can be stratified into groups based on performance thresholds (e.g., error <5 vm vs. ≥5 vm) for further analysis [18].
Protocol 2: Quantification of Plasma Biomarkers (p-tau181, GFAP, NfL)
Objective: To measure concentrations of p-tau181, GFAP, and NfL in plasma samples using single-molecule array (Simoa) technology.
Equipment and Reagents:
- Analytical Platform: Simoa SR-X or HD-X Analyzer (Quanterix Corp.) [74] [75].
- Assay Kits:
- Simoa pTau-181 Advantage V2 Kit (Item #104111) for p-tau181.
- Simoa Human Neurology 2-Plex B (N2PB) Kit (Item #103520) for GFAP and NfL.
- Blood Collection: EDTA-coated vacuum blood collection tubes.
- Low-Binding Consumables: Pipette tips, microcentrifuge tubes, and storage vials.
Procedure:
- Blood Collection and Plasma Isolation:
- Biomarker Measurement:
- Thaw frozen plasma samples on ice and centrifuge briefly to pellet debris.
- Dilute samples 1:4 as per kit instructions.
- Load samples, calibrators, and quality controls onto the Simoa platform according to the manufacturer's protocol for the specific assay kit.
- Run the assay in a single session to minimize batch effects.
Analysis:
- The instrument software calculates biomarker concentrations (pg/mL) based on the calibration curve.
- Ensure all quality control samples fall within the accepted ranges provided by the manufacturer.
- Samples with concentrations above the upper limit of quantification should be re-run at a higher dilution [74].
Visualizations
Experimental and Analytical Workflow
Biomarker and Path Integration Relationship
The Scientist's Toolkit
Table 3: Essential Research Reagent Solutions and Materials
| Item | Function / Role in Research | Example Specifications / Notes |
|---|---|---|
| Immersive VR System | Presents controlled, reproducible 3D environments to assess spatial navigation and path integration. | Meta Quest 2 HMD; Custom VR software with a featureless arena task [18] [76]. |
| Simoa HD-X Platform | Enables ultrasensitive quantification of low-abundance neurological biomarkers in plasma via digital ELISA. | Essential for measuring p-tau181, GFAP, and NfL; provides high precision at sub-pg/mL levels [74] [75]. |
| p-tau181 Assay Kit | Specifically measures phosphorylated tau at residue 181 in plasma, a key marker of AD-related tau pathology. | Simoa pTau-181 Advantage V2 Kit; LLOQ ~2.23 pg/mL [74]. |
| Neurology Multiplex Kit | Allows simultaneous measurement of multiple biomarkers from a single plasma sample, conserving sample volume. | Simoa Human Neurology 2-Plex B (N2PB) for GFAP/NfL; or Neurology 4-Plex E for Aβ42/Aβ40/GFAP/NfL [75]. |
| EDTA Blood Collection Tubes | Prevents coagulation and preserves protein integrity for accurate plasma biomarker analysis. | Centrifugation must occur within 2 hours of collection for optimal results [74]. |
| Low-Binding Tubes | Minimizes adsorption of biomarker proteins to tube walls, preventing analyte loss and ensuring measurement accuracy. | Critical for all sample handling steps post-centrifugation, including aliquoting and storage [74]. |
| 3T MRI Scanner | Provides high-resolution structural imaging for correlative measures like entorhinal cortex thickness. | Used to validate VR findings against regional brain atrophy [18] [75]. |
This application note details a machine learning framework that identifies plasma phosphorylated tau (p-tau181) as the most significant predictor of path integration (PI) errors in a virtual reality (VR) navigation task. The integration of this digital behavioral biomarker with fluid biomarkers offers a novel, non-invasive approach for detecting early Alzheimer's disease (AD) pathophysiology in healthy adults, enabling timely intervention and improved patient stratification for clinical trials [18] [46] [12].
Alzheimer's disease (AD) pathology begins in the entorhinal cortex (EC), a brain region critical for spatial navigation and path integration—the process of using self-motion cues to track one's position [18] [12]. The early, preclinical phase of AD can last for decades, creating an urgent need for accessible, non-invasive diagnostic tools. VR-based spatial navigation tasks directly probe the function of the EC and associated grid cell networks, making them sensitive potential markers for early detection [18] [10].
This research is situated within a broader thesis that posits functional navigation deficits, measurable with immersive technology, can reveal early AD-related cognitive changes before they are detectable by standard neuropsychological tests. The work detailed herein validates this approach by demonstrating a robust statistical link between a core navigation metric (PI errors) and a key molecular driver of AD (p-tau181), as identified through advanced machine learning analyses [18] [12].
Experimental Protocols & Workflows
Participant Cohort and Clinical Characterization
A cohort of 111 healthy Japanese adults (aged 22-79) was selected from an initial 140 volunteers. Participants with cognitive impairment (MMSE < 26), a history of neurological/psychiatric disorders, or an inability to complete the task due to VR-induced sickness were excluded [18] [12].
Table 1: Participant Demographic and Cognitive Characteristics
| Variables | All Participants (n=111) | Participants with PI Error <5 vm (n=72) | Participants with PI Error ≥5 vm (n=39) | p-value |
|---|---|---|---|---|
| Age (years) | 54.8 ± 12.2 | 52.1 ± 12.2 | 59.8 ± 10.7 | <0.001* |
| Sex (Male/Female) | 43/68 | 33/39 | 10/29 | 0.037* |
| Education (years) | 14.1 ± 2.3 | 14.5 ± 2.4 | 13.5 ± 2.0 | 0.052 |
| MMSE Score | 29.1 ± 0.9 | 29.3 ± 0.8 | 28.9 ± 1.0 | 0.083 |
| APOE ε4 Positive, n (%) | 18 (16.2%) | 9 (12.5%) | 9 (23.1%) | Not Specified |
Protocol Steps:
- Informed Consent: Obtain written informed consent approved by the institutional ethics committee [12].
- Clinical Assessment: Collect demographic data and administer cognitive batteries (MMSE, ACE-R, MoCA-J) and mood assessments (GDS-15) to establish baseline cognitive status [18].
- Biomarker Sampling: Perform blood draws for subsequent plasma biomarker analysis and ApoE genotyping.
- VR Navigation Task: Administer the VR-based path integration task.
- Neuroimaging: Acquire structural MRI scans using a 3T scanner to measure entorhinal cortex thickness [18] [12].
All testing was completed on the same day in the specified order [18].
VR Path Integration Task Protocol
Objective: To quantify a participant's path integration error—the Euclidean distance between their estimated and the actual starting location [18] [12].
Equipment:
- Head-Mounted Display (HMD): Meta Quest 2 [77] [12].
- Control Interface: Joystick for forward/backward movement; physical turning for lateral orientation [12].
- Virtual Environment: A circular arena (20 virtual meters in diameter) surrounded by 3 vm-high walls [12].
Procedure:
- Habituation: Participants freely navigate the virtual arena to acclimate to the controls and environment [12].
- Task Execution:
- The participant, positioned at the start point (S), is instructed to navigate to two sequentially presented flagged locations (A and B).
- After reaching the second flag (B), the visual cue is removed.
- The participant must then navigate directly back to the remembered start location (S) using a joystick.
- Data Output: The primary metric is the PI error, defined as the Euclidean distance (in virtual meters) between the participant's final estimated position and the true start point (S) [18] [12].
Biomarker Assays and Genotyping
Plasma Biomarker Analysis: Plasma concentrations of key AD-related biomarkers were measured [18]:
- Glial Fibrillary Acidic Protein (GFAP)
- Neurofilament Light Chain (NfL)
- Amyloid-β 40 (Aβ40)
- Amyloid-β 42 (Aβ42)
- Phosphorylated Tau 181 (p-tau181)
Genotyping: Apolipoprotein E (ApoE) genotype was determined for each participant [18].
Statistical and Machine Learning Analysis Protocol
The core objective was to identify predictive relationships for PI errors and rank predictor importance [18].
Analytical Workflow:
- Initial Correlation Analysis: Perform univariate analyses (e.g., Pearson's correlation) to assess simple relationships between PI errors and age, plasma biomarkers, and ApoE status [18].
- Multivariate Linear Regression: Construct regression models with PI error as the dependent variable and demographic factors, ApoE status, and plasma biomarkers as independent variables. This controls for confounding effects and identifies independent predictors [18].
- Machine Learning for Predictor Importance: Employ machine learning algorithms (specific algorithms not named in the source) to rank the importance of all predictors in forecasting PI errors. This step is crucial for identifying the most potent variable [18].
- Logistic Regression & ROC Analysis: Use logistic regression to model the binary outcome (e.g., high vs. low PI error). Generate Receiver Operating Characteristic (ROC) curves to evaluate the diagnostic performance of key predictors, notably p-tau181, and to determine optimal cutoff values [18].
Key Findings and Data Synthesis
The analysis revealed significant correlations between PI errors and several biological and demographic variables [18].
Table 2: Summary of Key Correlations with Path Integration Errors
| Variable | Correlation with PI Error | Statistical Significance | Notes |
|---|---|---|---|
| Age | Positive | p < 0.001 | PI errors increased with advancing age [18]. |
| Plasma GFAP | Positive | p = 0.0332 | Significant independent predictor in multivariate model [18]. |
| Plasma NfL | Positive | Not Fully Specified | Significant in initial correlations [18]. |
| Plasma p-tau181 | Positive | p = 0.0128 | Most significant predictor in ML ranking [18]. |
| ApoE ε4 Allele | Positive | p = 0.037 | Associated with higher PI errors [18]. |
| Entorhinal Cortex Thickness | Negative | Not Significant | Correlation did not survive age adjustment [18]. |
Machine Learning Outcome: p-tau181 as Top Predictor
The machine learning analysis provided the central finding of the study [18]:
- Predictor Importance Ranking: Plasma p-tau181 was identified as the most significant predictor of PI errors, outperforming other plasma biomarkers, ApoE status, and age [18].
- ROC Analysis: The performance of p-tau181 as a predictor was further validated using ROC curves, confirming its high discriminatory power [18].
- Combinatorial Biomarker Potential: The hierarchical application of the VR PI task followed by plasma p-tau181 measurement was proposed as an effective two-step screening method for early AD neurodegeneration [18] [12].
The Scientist's Toolkit: Research Reagent Solutions
Table 3: Essential Materials and Reagents for Protocol Replication
| Item | Function/Application | Example/Note |
|---|---|---|
| Immersive VR Headset | Presents 3D virtual environment and tracks head orientation. | Meta Quest 2 [77] [12]. |
| VR Navigation Software | Generates the virtual arena and controls task logic. | Custom software for a circular arena with cue objects [12]. |
| Plasma p-tau181 Assay | Quantifies concentration of phosphorylated tau in blood plasma. | SiMoA (Single Molecule Array) technology is a leading method for ultra-sensitive detection [78]. |
| ApoE Genotyping Kit | Determines ApoE ε4 carrier status, a major genetic risk factor for AD. | Commercially available PCR-based kits [18]. |
| Cognitive Batteries | Assesses global cognitive status and excludes impairment. | Mini-Mental State Examination (MMSE), MoCA-J [18]. |
This protocol demonstrates that machine learning can effectively distill complex multimodal data (digital behavioral, fluid biomarker, genetic) to identify p-tau181 as the foremost predictor of path integration deficits in a healthy population. This finding strongly supports the integration of VR navigation tasks as functional digital biomarkers in the early detection of Alzheimer's disease.
Future Directions: Subsequent research should focus on longitudinal studies to validate the predictive power of this combinatorial approach for clinical progression to MCI and AD. Furthermore, expanding cohorts to diverse populations and standardizing VR protocols across research sites will be essential for widespread adoption and application in clinical trial recruitment and therapeutic monitoring.
The early and accurate detection of cognitive impairment, particularly in the context of Alzheimer's disease (AD) and mild cognitive impairment (MCI), represents a critical challenge in neurology and drug development. Traditional cognitive screening tools like the Mini-Mental State Examination (MMSE) and the Montreal Cognitive Assessment (MoCA) have been clinical mainstays for decades. However, their limitations in detecting subtle, early deficits have driven research into more sensitive alternatives. Virtual reality (VR), particularly VR-based spatial navigation tasks, emerges as a powerful tool that leverages the known vulnerability of the entorhinal-hippocampal network in early AD pathology. This document provides a comparative analysis of the sensitivity of VR-based assessments against standard 2D tests, supported by quantitative data and detailed experimental protocols for research application.
Quantitative Comparison of Assessment Modalities
Table 1: Comparative Sensitivity of Cognitive Assessment Tools for MCI and Early AD
| Assessment Tool | Reported Sensitivity for MCI | Key Cognitive Domains Assessed | Key Advantages | Key Limitations |
|---|---|---|---|---|
| MMSE [79] [80] | 18% - 25% | Orientation, Registration, Attention, Recall, Language, Visuospatial | Brief (5-10 min), widely recognized, simple to administer | Low sensitivity for MCI; lacks executive function assessment; ceiling effects |
| MoCA [79] [80] | 90% - 100% | Executive Functions, Visuospatial, Memory, Attention, Language, Orientation | High sensitivity for MCI; includes executive function tasks; includes education correction | Longer (10-15 min); requires specific materials |
| VR-based Spatial Navigation [81] [82] [6] | 70.7% - 100% (varies by specific task) | Allocentric Navigation, Egocentric Navigation, Path Integration, Spatial Memory | High ecological validity; assesses specific early-AD neural circuits; can detect pre-clinical deficits | Requires hardware; potential for cybersickness; ongoing protocol standardization |
Table 2: Quantitative Efficacy of VR Interventions for Cognitive Rehabilitation in MCI
| Intervention Type | Pooled Effect Size (Hedges's g) | Statistical Significance (p-value) | Certainty of Evidence (GRADE) |
|---|---|---|---|
| VR-based Cognitive Training [81] | 0.52 (95% CI: 0.15 to 0.89) | p = 0.05 | Moderate |
| VR-based Games [81] | 0.68 (95% CI: 0.12 to 1.24) | p = 0.02 | Low |
| Overall VR Interventions [81] | 0.60 (95% CI: 0.29 to 0.90) | p < 0.05 | Moderate |
Experimental Protocols for VR Spatial Navigation Assessment
The following protocols detail methodologies for assessing spatial navigation, a core domain impacted in early Alzheimer's disease.
Protocol 1: VR Path Integration Task for Preclinical Biomarker Correlation
This protocol is designed to correlate navigation performance with established plasma biomarkers of AD in healthy adults, aiming to detect the earliest signs of pathology [46] [12].
- Objective: To investigate the relationship between path integration (PI) errors measured in a VR environment and levels of AD biomarkers (e.g., p-tau181, GFAP) for the development of a non-invasive surrogate marker.
- Population: Cognitively healthy adults (e.g., aged 22-79). Exclusion criteria include MMSE<26, history of neurological disorders, and inability to complete the task due to VR-induced sickness [12].
- Equipment:
- VR System: Head-mounted display (HMD) with joystick controller (e.g., Meta Quest 2).
- Software: Custom task built in a game engine (e.g., Unity).
- Biomarker Analysis: Equipment for plasma biomarker analysis (p-tau181, GFAP, NfL, Aβ40/Aβ42).
- MRI Scanner: For structural imaging (e.g., entorhinal cortex thickness measurement).
- Procedure:
- Participant Preparation: Obtain informed consent. Collect blood samples for biomarker analysis prior to VR testing.
- VR Task Setup: Participant wears HMD while seated in a swivel chair. The virtual environment is a blank, featureless circular arena.
- Task - Outbound Path: The participant uses the joystick to navigate from a start point to a target object along a predefined, circuitous path. The environment provides no external landmarks.
- Task - Return Phase: After the target is reached, the participant must return to the start point along the most direct route (i.e., a straight line) using only self-motion cues (vestibular, proprioceptive) integrated during the outbound path.
- Data Collection: The primary outcome is the PI error, calculated as the Euclidean distance between the participant's final position and the true start position.
- Data Analysis:
- Perform multivariate linear regression to assess the correlation between PI error and plasma biomarker levels, controlling for age.
- Use machine learning (e.g., predictor importance ranking) and ROC curves to identify the strongest predictors of PI performance.
Protocol 2: Allocentric vs. Egocentric Navigation Assessment
This protocol isolates and assesses two primary spatial navigation strategies, known to rely on distinct neural circuits affected in early AD [6] [21].
- Objective: To separately quantify allocentric (world-centered) and egocentric (self-centered) navigation impairments in individuals with MCI or early AD.
- Population: Patients with MCI/early AD and matched healthy controls.
- Equipment:
- VR System: HMD (e.g., Meta Quest 3) that allows for physical rotation and joystick movement.
- Software: Custom immersive environment featuring distinct landmarks (e.g., lighthouse, cabin) [21].
- Procedure:
- Encoding Phase: The participant is placed in a "starting room" with a clear view of the virtual landscape and its key landmarks. They are given time to encode the spatial layout.
- Egocentric Navigation Test: The participant moves down a hallway with the external view obscured (e.g., by fog). At the end, they must point back to the start location using only their sense of self-movement.
- Allocentric Navigation Test: Immediately after, the participant must identify the locations of the previously seen landmarks (lighthouse, cabin) on a map or by pointing, requiring a mental representation of the environment independent of their own position.
- Data Collection: Accuracy is measured for both tasks: angular error for egocentric pointing and distance error for landmark placement.
- Data Analysis:
- Compare performance between patient and control groups using t-tests or ANOVA.
- Correlate allocentric performance scores with biomarkers or hippocampal volume.
Protocol 3: Sea Hero Quest (SHQ) for Real-World Disorientation Prediction
This protocol uses an off-the-shelf VR game to assess navigation and its relevance to real-world functioning [6].
- Objective: To investigate if navigation impairments measured in a VR game can predict real-world spatial disorientation in patients with AD.
- Population: Community-dwelling AD patients and healthy controls.
- Equipment: Tablet or mobile phone running the Sea Hero Quest game.
- Procedure:
- VR Testing: Participants play levels of SHQ, which involves navigating a boat through a virtual environment to find checkpoints. Key metrics are wayfinding distance and wayfinding duration.
- Community Navigation Testing: On a separate day, participants complete the Detour Navigation Test (DNT) in their own neighborhood. They are led on a circuitous route and then must find the most direct way back to the start.
- Data Collection: A composite disorientation score is calculated from the DNT. SHQ performance metrics are automatically recorded.
- Data Analysis:
- Perform linear regression to determine if SHQ wayfinding metrics significantly predict the DNT composite score.
Conceptual Workflow: From VR Assessment to Early Detection
The following diagram illustrates the logical pathway and scientific rationale for using VR spatial navigation tasks in early Alzheimer's disease detection research.
The Scientist's Toolkit: Essential Research Reagents and Materials
Table 3: Key Research Reagent Solutions for VR Navigation Studies
| Item | Function/Application | Example Specifications/Notes |
|---|---|---|
| Immersive VR Headset | Presents 3D virtual environments; tracks head orientation. | Meta Quest 2/3 [12]; Provides 6 degrees of freedom (6-DOF) tracking. |
| VR Development Platform | Software for creating and controlling custom VR navigation tasks. | Unity Game Engine [21]; Allows for precise control of stimuli and data logging. |
| Biomarker Assay Kits | Correlate behavioral performance with molecular pathology. | Plasma p-tau181, GFAP, NfL assays [46] [12]; Critical for validating VR tasks against AD biomarkers. |
| Standardized Cognitive Batteries | For baseline classification and comparison with VR metrics. | MoCA-J [12], ACE-R [12], MMSE [79]; Used to characterize participant cohorts. |
| Data Analysis Suite | For statistical analysis and machine learning modeling. | R, Python, SPSS; Used for regression, ROC analysis, and predictor importance ranking [46] [12]. |
Receiver Operating Characteristic (ROC) analysis is a fundamental statistical method for evaluating the performance of diagnostic tests, biomarkers, and classification models. Originally developed during World War II for radar signal detection, ROC analysis has become indispensable in clinical epidemiology, psychology, and machine learning for assessing how well a test can discriminate between two states or conditions [83] [84]. In Alzheimer's disease research, this methodology is particularly crucial for establishing optimal diagnostic thresholds for emerging tools like virtual reality spatial navigation tasks, especially during the preclinical stage when intervention may be most effective.
The core components of ROC analysis include the true positive rate, which represents the proportion of actual positives correctly identified, and the false positive rate, which represents the proportion of actual negatives incorrectly classified as positive [85]. By plotting these two parameters against each other across all possible threshold values, researchers obtain a visual representation of the trade-off between sensitivity and specificity that characterizes every diagnostic test. The resulting ROC curve provides insights that single-threshold metrics cannot capture, enabling the selection of optimal cut-off points based on clinical requirements and cost-benefit considerations [83].
Theoretical Foundations of ROC Curves and AUC
Key Concepts and Terminology
- True Positive Rate: Also known as sensitivity or probability of detection, calculated as TP/(TP+FN)
- False Positive Rate: Also known as 1-specificity or probability of false alarm, calculated as FP/(TN+FP)
- Diagonal Line: Represents the line of no-discrimination where the test performs no better than random guessing
- Perfect Classification: Located at the point (0, 1) in ROC space, indicating 100% sensitivity and 100% specificity [85] [84]
Area Under the Curve Interpretation
The Area Under the ROC Curve provides a single measure of overall diagnostic performance independent of any particular threshold. The AUC represents the probability that the classifier will rank a randomly chosen positive instance higher than a randomly chosen negative instance [86]. The following table outlines the standard interpretation of AUC values:
| AUC Value | Classification Performance | Probability of Correct Ranking |
|---|---|---|
| 0.5 | No discrimination | 50% |
| 0.7-0.8 | Acceptable | 70-80% |
| 0.8-0.9 | Excellent | 80-90% |
| >0.9 | Outstanding | >90% |
ROC Analysis Protocol for Diagnostic Test Evaluation
Experimental Workflow for ROC Analysis
The following diagram illustrates the comprehensive workflow for conducting ROC analysis in diagnostic test development:
Step-by-Step Protocol
Phase 1: Study Design and Data Collection
- Define Gold Standard: Establish a reference method against which the new diagnostic test will be compared (e.g., PET imaging for Alzheimer's pathology) [83]
- Recruit Participants: Include individuals across the disease spectrum (cognitively unimpaired, preclinical, prodromal) to ensure adequate representation of both positive and negative cases
- Collect Test Results: Administer the diagnostic test (e.g., VR spatial navigation task) to all participants and record continuous or ordinal outcomes
Phase 2: Threshold Variation and Calculation
- Vary Decision Threshold: Systematically apply different cut-off points to the test results to classify subjects as positive or negative
- Calculate Classification Metrics: For each threshold, construct a 2x2 contingency table and calculate:
- True Positive Rate = TP / (TP + FN)
- False Positive Rate = FP / (FP + TN)
Phase 3: ROC Construction and Analysis
- Plot ROC Curve: Graph TPR against FPR for all threshold values
- Calculate AUC: Determine the area under the ROC curve using non-parametric or parametric methods
- Compare with Null: Assess whether the AUC is significantly different from 0.5 (random discrimination)
Phase 4: Threshold Selection and Validation
- Select Optimal Threshold: Apply clinical context and cost-benefit considerations to identify the most appropriate operating point
- Validate Performance: Assess the chosen threshold in an independent validation cohort
Application to VR Spatial Navigation in Alzheimer's Detection
Current Evidence for Spatial Navigation Tests
Virtual reality spatial navigation tasks show particular promise for preclinical Alzheimer's detection due to the early vulnerability of entorhinal and rhinal cortices. The following table summarizes quantitative performance data from recent studies:
| Assessment Tool | Target Population | AUC for Aβ+ Status | AUC for Tau+ Status | Reference |
|---|---|---|---|---|
| Conceptual Matching Task | Preclinical AD | 0.77 (Aβ+ CU vs Aβ- CU) | Not reported | [87] |
| Virtual Supermarket Test | Mild AD | Not reported | Not reported | [6] |
| Sea Hero Quest | Mild AD | Not reported | Not reported | [6] |
| Path Integration (VR) | Preclinical AD | Correlated with p-tau181 | Not reported | [18] |
| PACC5 | Preclinical AD | 0.58-0.63 | Not reported | [87] |
Experimental Protocol for VR Navigation ROC Studies
Participant Recruitment and Classification
- Inclusion Criteria: Recruit cognitively unimpaired adults aged 50+ with appropriate informed consent
- Sample Size: Minimum of 100 participants to ensure adequate statistical power for ROC analysis
- Reference Standard: Classify participants using gold-standard biomarkers (amyloid PET, tau PET, or CSF analysis) into Aβ-positive (preclinical AD) and Aβ-negative groups [87]
VR Navigation Task Administration
- Apparatus: Use immersive head-mounted displays with rotational chair to minimize motion sickness while providing vestibular and proprioceptive feedback [38]
- Task Design: Implement spatial navigation paradigms targeting specific brain regions:
- Path Integration: Assesses grid cell function in entorhinal cortex [18]
- Allocentric Navigation: Evaluates hippocampal function through map-based navigation
- Egocentric Navigation: Tests parietal lobe function through body-centered navigation
- Performance Metrics: Record continuous variables such as:
- Path integration error distance
- Navigation speed and efficiency
- Wayfinding accuracy
- Task completion time
Data Analysis and Interpretation
- ROC Analysis: Perform ROC analysis using biomarker status as reference standard
- Comparison with Established Tests: Compare AUC values with standard cognitive assessments (e.g., PACC5) [87]
- Multivariate Adjustments: Assess potential confounding by age, education, and APOE ε4 status
The Scientist's Toolkit: Essential Research Reagents and Materials
| Research Tool | Function/Application | Example Use in AD Research |
|---|---|---|
| VR Head-Mounted Display | Presents immersive virtual environments | Spatial navigation assessment [18] |
| Rotational Chair | Provides vestibular input during navigation | Reduces VR-induced sickness [38] |
| Biomarker Assays | Gold-standard pathology confirmation | Aβ and tau status determination [87] |
| Statistical Software | ROC curve analysis and AUC calculation | Diagnostic performance evaluation [85] |
| Cognitive Test Battery | Comparison with standard assessments | Establishing incremental value [87] |
Threshold Selection Strategies and Clinical Implementation
Approaches to Optimal Cut-point Determination
The process of selecting the optimal threshold involves both statistical and clinical considerations, as illustrated below:
Youden's Index Method
- Calculation: J = max[sensitivity + specificity - 1] across all thresholds
- Application: Identifies the threshold that maximizes the overall correct classification rate
- Limitations: Does not account for differences in clinical consequences of false positives versus false negatives
Cost-Benefit Analysis
- Considerations: Incorporates clinical context, prevalence, and relative costs of misclassification
- Implementation: Particularly important when false positives lead to unnecessary invasive procedures or false negatives result in missed treatment opportunities
Clinical Context Considerations
- Screening Context: Prioritize high sensitivity to minimize false negatives
- Confirmatory Testing: Prioritize high specificity to minimize false positives
- Preclinical AD: Balance both while considering psychological impact of labeling
Special Considerations for Preclinical AD Detection
The application of ROC analysis to preclinical Alzheimer's detection presents unique methodological challenges:
Spectrum Bias Considerations
- Ensure participant inclusion represents the full spectrum of target population
- Include both clearly healthy individuals and those with subtle, preclinical pathology
- Account for potential confounding conditions that might affect test performance
Longitudinal Validation
- Assess whether diagnostic thresholds predict future clinical progression
- Evaluate test-retest reliability for serial monitoring applications
- Establish minimally important change thresholds for tracking disease progression
Integration with Multimodal Biomarkers
- Develop combined algorithms incorporating fluid biomarkers, imaging, and cognitive measures
- Evaluate incremental value of VR navigation beyond established biomarkers
- Establish hierarchical testing approaches to maximize efficiency and cost-effectiveness [18]
ROC analysis provides a robust methodological framework for establishing diagnostic thresholds for VR spatial navigation tasks in preclinical Alzheimer's detection. The AUC serves as a key metric for evaluating overall diagnostic performance, while the selection of optimal operating points requires careful consideration of clinical context and application requirements. As research advances, standardized protocols for ROC analysis will facilitate comparison across studies and accelerate the development of sensitive, specific, and clinically feasible tools for early Alzheimer's detection.
Differentiating Alzheimer's from Other Dementias Using Spatial Navigation Profiles
Spatial navigation impairments represent one of the earliest and most specific cognitive markers of Alzheimer's disease (AD), preceding clinical diagnosis by many years. The entorhinal cortex, where neurofibrillary tangles first originate in AD, contains a grid cell network essential for spatial mapping and navigation capabilities [18]. This application note provides detailed protocols and analytical frameworks for utilizing virtual reality (VR) spatial navigation tasks to differentiate AD from other dementias and normal cognitive aging, supporting early detection and differential diagnosis in research and clinical trial settings.
The progressive nature of spatial navigation deficits aligns with Braak staging of neurofibrillary pathology, making it a sensitive behavioral biomarker. Recent advances in VR technology and standardized assessment protocols now enable precise quantification of navigation performance that correlates with established molecular biomarkers [18]. This document outlines standardized methodologies for implementing these assessments in research settings.
Quantitative Data Synthesis
Spatial Navigation Performance Across Populations
Table 1: Comparative Spatial Navigation Performance Across Diagnostic Groups
| Diagnostic Group | Sample Size | Navigation Measure | Effect Size (Hedge's g) | Standardized Mean Difference | Significance |
|---|---|---|---|---|---|
| Alzheimer's Disease | 941 | Overall Navigation Performance | — | 1.97 | p < 0.05 [88] |
| Cognitively Healthy Older Adults | 1,468 | Overall Navigation Performance | — | Reference | Reference [88] |
| Healthy Adults (Age 50+) | 111 | Path Integration Error | — | — | Correlated with plasma p-tau181 [18] |
| Middle-aged to Older Adults (55-75) | 108 | SCMT-I Errors | — | — | Age-associated increase [89] |
Biomarker Correlations with Spatial Navigation
Table 2: Correlations Between Spatial Navigation Performance and AD Biomarkers
| Biomarker | Navigation Measure | Correlation Strength | Statistical Significance | Predictive Value |
|---|---|---|---|---|
| Plasma p-tau181 | Path Integration Errors | t-value = 2.53 | p = 0.0128 | Most significant predictor [18] |
| Plasma GFAP | Path Integration Errors | t-value = 2.16 | p = 0.0332 | Significant predictor [18] |
| Plasma NfL | Path Integration Errors | Positive correlation | Significant | Contributing predictor [18] |
| APOE ε4 genotype | Path Integration Errors | Coefficient = 0.650 | p = 0.037 | Modest predictor [18] |
| Age | SCMT-I Errors/Retrieval Time | Strong positive correlation | Significant | Primary influencing factor [89] |
Experimental Protocols
Virtual Reality Path Integration Assessment
Protocol ID: VR-PI-001 Based on: Koike et al., 2025 [18] Purpose: To quantify path integration errors using immersive VR technology as a surrogate marker for entorhinal cortex dysfunction.
Equipment Requirements:
- Head-mounted display (HMD) with 3D VR capability
- Motion tracking system
- Custom VR navigation software with path integration task
- Data recording and analysis workstation
Procedure:
- Participant Preparation: Secure informed consent. Exclude participants with conditions that may cause VR-induced sickness. Record demographic data, medical history, and cognitive screening scores (MMSE, ACE-R, MoCA-J).
- System Calibration: Adjust HMD for proper fit and clear vision. Calibrate motion tracking to ensure accurate movement capture.
- Task Instructions: Explain that participants must navigate to a briefly visible target using self-motion cues without landmark guidance.
- Practice Trial: Conduct 2-3 practice trials to ensure task understanding.
- Experimental Trials:
- Present target location briefly (2-3 seconds)
- Remove visual target cue
- Participant navigates to remembered location using self-motion cues only
- Record final position error relative to target
- Repeat for minimum of 10 trials with varying target locations
- Data Collection: Record trial-by-trial error distance, navigation path, completion time, and movement kinematics.
Analysis:
- Calculate mean error distance across trials
- Compute correlation with biomarker levels (p-tau181, GFAP, NfL)
- Perform multivariate regression adjusting for age, education, and APOE status
- Generate receiver operating characteristic (ROC) curves for diagnostic accuracy
Virtual Supermarket Test (VST)
Protocol ID: VST-002 Based on: Coughlan et al., 2022 [6] Purpose: To assess egocentric and allocentric navigation strategies in a clinically accessible format.
Equipment Requirements:
- iPad or tablet device
- VST application
- Standardized assessment environment
Procedure:
- Setup: Position participant comfortably with iPad at fixed distance.
- Task Administration:
- Present 14 video trials of shopping trolley moving through virtual supermarket
- Vary trial duration (20-40 seconds) and number of turns (3-5)
- After each trial, administer three question types:
- Egocentric orientation: "Point to where you started."
- Allocentric orientation: "Mark your starting position on a map."
- Heading direction: "Point to the destination you just arrived at."
- Scoring: Record accuracy for each question type separately.
Analysis:
- Calculate separate scores for egocentric, allocentric, and heading direction
- Compare performance to age-matched norms
- Examine pattern of deficits (egocentric vs. allocentric predominance)
Detour Navigation Test (DNT)
Protocol ID: DNT-003 Based on: Coughlan et al., 2022 [6] Purpose: To assess real-world navigation ability in familiar community environments.
Procedure:
- Route Selection: Identify a standardized 400-500 meter route in participant's neighborhood.
- Practice Phase: Guide participant along entire route once.
- Testing Phase:
- Start at beginning of route
- Accompany participant along route until predetermined detour point
- Instruct participant to find way back to route after detour
- Record navigation without intervention unless safety concern
- Data Collection:
- Record composite disorientation score
- Document number of wrong turns
- Note need for intervention
- Record completion time
Analysis:
- Calculate composite disorientation score incorporating errors and assistance needed
- Correlate DNT performance with VR navigation measures
- Assess predictive value for real-world getting lost episodes
Visualization Framework
Path Integration as an Early AD Biomarker
Diagram 1: Path Integration as an Early AD Biomarker. This workflow illustrates the proposed pathway from initial entorhinal cortex pathology to measurable path integration (PI) errors detectable through virtual reality (VR) assessment, and their correlation with established molecular biomarkers for early Alzheimer's disease diagnosis [18].
Navigation Assessment Protocol Integration
Diagram 2: Navigation Assessment Protocol Integration. This workflow outlines the comprehensive assessment protocol integrating virtual reality navigation tasks with molecular biomarker analysis and real-world validation for differential diagnosis of Alzheimer's disease [18] [6].
The Scientist's Toolkit
Table 3: Essential Research Reagent Solutions for VR Navigation Studies
| Category | Specific Tool/Reagent | Research Function | Example Application |
|---|---|---|---|
| VR Platforms | Head-mounted 3D VR System | Provides immersive navigation environment with motion tracking | Path integration assessment [18] |
| VR Platforms | Virtual Supermarket Test (VST) | Assesses egocentric/allocentric navigation on tablet devices | Navigation strategy profiling [6] |
| VR Platforms | Sea Hero Quest (SHQ) | Measures wayfinding ability in game-based format | Large-scale spatial navigation assessment [6] |
| Biomarker Assays | Plasma p-tau181 | Quantifies phosphorylated tau levels | Correlation with path integration errors [18] |
| Biomarker Assays | Plasma GFAP | Measures astrocytic activation marker | Correlation with navigation performance [18] |
| Biomarker Assays | Plasma NfL | Assesses axonal damage | Association with spatial disorientation [18] |
| Cognitive Assessments | SCMT-I (Spatial Context Memory Test) | Evaluates spatial-context memory using real-world simulation | Detecting age-related memory decline [89] |
| Cognitive Assessments | Mini-ACE | Provides sensitive cognitive screening | Participant characterization [6] |
| Genetic Analysis | APOE Genotyping | Determines ε4 allele status | Risk stratification [18] |
| Neuroimaging | 3T MRI with Entorhinal Cortex Segmentation | Quantifies medial temporal lobe structure | Correlating navigation with brain volume [18] |
Conclusion
VR spatial navigation represents a paradigm shift in early Alzheimer's detection, offering a non-invasive, cost-effective, and highly sensitive functional biomarker that aligns with the earliest known sites of neuropathology. The strong correlation between path integration errors and plasma p-tau181 levels underscores its potential for screening and enriching preclinical trial cohorts. For the drug development pipeline, this technology provides a tangible functional outcome measure to complement biomarker data, potentially streamlining clinical trials for disease-targeted therapies. Future directions must focus on large-scale longitudinal validation, standardization of protocols across platforms, and integration of VR metrics as exploratory endpoints in therapeutic trials to fully realize its potential in changing the trajectory of Alzheimer's disease.
References
- 1. Entorhinal cortex dysfunction in Alzheimer's disease - PMC [https://pmc.ncbi.nlm.nih.gov/articles/PMC9877178/]
- 2. Impairment of entorhinal cortex network activity in ... [https://www.frontiersin.org/journals/aging-neuroscience/articles/10.3389/fnagi.2024.1402573/full]
- 3. Entorhinal cortex pathology in Alzheimer's disease - PubMed [https://pubmed.ncbi.nlm.nih.gov/1669339/]
- 4. Entorhinal cortex: a good biomarker of mild cognitive ... [https://pubmed.ncbi.nlm.nih.gov/26444348/]
- 5. Virtual Reality and Serious Videogame-Based Instruments ... [https://pmc.ncbi.nlm.nih.gov/articles/PMC11965194/]
- 6. Predicting real world spatial disorientation in Alzheimer's ... [https://www.nature.com/articles/s41598-022-17634-w]
- 7. Protocol for Short- and Longer-term Spatial Learning ... [https://www.frontiersin.org/journals/behavioral-neuroscience/articles/10.3389/fnbeh.2017.00197/full]
- 8. Anatomically Refined Entorhinal Cortex Segmentation ... [https://www.frontiersin.org/journals/aging-neuroscience/articles/10.3389/fnagi.2025.1682106/full]
- 9. Decoding Spatial Memory Retrieval in Cubical Space Using ... [https://pmc.ncbi.nlm.nih.gov/articles/PMC8168467/]
- 10. Path integration impairments reveal early cognitive changes in ... [https://pmc.ncbi.nlm.nih.gov/articles/PMC12407072/]
- 11. Grid cells accurately track movement during path ... [https://www.nature.com/articles/s41593-025-02054-6]
- 12. Virtual reality navigation for the early detection of ... [https://www.frontiersin.org/journals/aging-neuroscience/articles/10.3389/fnagi.2025.1571429/full]
- 13. Rotation errors in path integration are associated with ... [https://pmc.ncbi.nlm.nih.gov/articles/PMC11786419/]
- 14. Misdirected: Increased Dementia Risk Associated with ... [https://www.dzne.de/en/news/press-releases/press/misdirected-increased-dementia-risk-associated-with-errors-of-the-brains-compass/]
- 15. The feasibility and practicality of auxiliary detection ... [https://www.sciencedirect.com/science/article/pii/S2405844024007795]
- 16. Blood biomarkers of Alzheimer's disease and progression ... [https://www.nature.com/articles/s41467-025-66728-2]
- 17. Spatial memory deficits in Alzheimer's disease and their ... [https://pmc.ncbi.nlm.nih.gov/articles/PMC9878455/]
- 18. Virtual reality navigation for the early detection ... [https://pmc.ncbi.nlm.nih.gov/articles/PMC12405256/]
- 19. Preclinical Cognitive Markers of Alzheimer Disease and Early ... [https://medinform.jmir.org/2025/1/e62914]
- 20. The complementary role of egocentric and allocentric ... [https://www.sciencedirect.com/science/article/pii/S014976342500380X]
- 21. Using Virtual Reality to find signs of Alzheimer's disease [https://www.centreforbrainhealth.ca/news/using-virtual-reality-to-find-signs-of-alzheimers-disease/]
- 22. Using virtual reality to study spatial mapping and threat ... [https://www.nature.com/articles/s41539-025-00305-6]
- 23. Different Profiles of Spatial Navigation Deficits In ... [https://pmc.ncbi.nlm.nih.gov/articles/PMC9201637/]
- 24. Rotation errors in path integration are associated with ... [https://alzres.biomedcentral.com/articles/10.1186/s13195-025-01679-w]
- 25. Clinical Correlates of the PET-based Braak Staging ... [https://www.sciencedirect.com/science/article/pii/S2274580724000888]
- 26. Rates of clinical progression according to biological ... [https://pmc.ncbi.nlm.nih.gov/articles/PMC12434706/]
- 27. Development and preliminary validation of a virtual reality ... [https://www.frontiersin.org/journals/aging-neuroscience/articles/10.3389/fnagi.2023.1236084/full]
- 28. The Role of Virtual Reality in Screening, Diagnosing, and ... [https://pmc.ncbi.nlm.nih.gov/articles/PMC7893135/]
- 29. Protocol to evaluate the effectiveness of a virtual-reality ... [https://pmc.ncbi.nlm.nih.gov/articles/PMC11367548/]
- 30. Virtual reality and mixed reality in the assessment of spatial ... [https://www.explorationpub.com/Journals/edht/Article/101151]
- 31. Immersive Technologies Targeting Spatial Memory Decline [https://pmc.ncbi.nlm.nih.gov/articles/PMC12466985/]
- 32. JMIR Medical Informatics - Preclinical Cognitive Markers of Alzheimer ... [https://medinform.jmir.org/2025/1/e62914/]
- 33. A quantitative comparison of virtual and physical ... [https://www.nature.com/articles/s41598-024-55253-9]
- 34. Virtual Reality and Serious Videogame-Based Instruments for... [https://pubmed.ncbi.nlm.nih.gov/38403731/]
- 35. Virtual Water Task: Procedures and Protocols for the ... - Sciety [https://sciety.org/articles/activity/10.31234/osf.io/jq5xz_v1?utm_source=sciety_labs_article_page]
- 36. The cognitive map in humans: Spatial navigation and beyond [https://pmc.ncbi.nlm.nih.gov/articles/PMC6028313/]
- 37. Evaluation of a conceptual framework for predicting navigation ... [https://journals.plos.org/plosone/article?id=10.1371/journal.pone.0184682]
- 38. Pre-protocol of the Virtual Spatial Configuration Task (VSCT) [https://pmc.ncbi.nlm.nih.gov/articles/PMC12501587/]
- 39. The impact of human agents on spatial navigation and ... [https://www.frontiersin.org/journals/virtual-reality/articles/10.3389/frvir.2025.1497237/full]
- 40. Spatial Navigation and Its Association With Biomarkers and ... [https://pmc.ncbi.nlm.nih.gov/articles/PMC9651458/]
- 41. Allocentric Spatial Memory Performance in a Virtual Reality ... [https://pmc.ncbi.nlm.nih.gov/articles/PMC7465242/]
- 42. Alzheimer's disease digital biomarkers multidimensional ... [https://www.nature.com/articles/s41746-025-01640-z]
- 43. Description of the Method for Evaluating Digital Endpoints ... [https://www.researchprotocols.org/2022/8/e35442]
- 44. Integrating Biomarkers From Virtual Reality and Magnetic ... [https://pubmed.ncbi.nlm.nih.gov/38631021/]
- 45. Integrating Biomarkers From Virtual Reality and Magnetic ... [https://www.jmir.org/2024/1/e54538/]
- 46. Virtual reality navigation for the early detection of ... [https://pubmed.ncbi.nlm.nih.gov/40908958/]
- 47. A Fully-Immersive and Automated Virtual Reality System to ... [https://www.frontiersin.org/journals/aging-neuroscience/articles/10.3389/fnagi.2020.604670/full]
- 48. How VR Technology is Changing the Game for Alzheimer's ... [https://www.cogneurosociety.org/how-vr-technology-is-changing-the-game-for-alzheimers-disease/]
- 49. Impact of sensorimotor mismatch on virtual reality sickness ... [https://pmc.ncbi.nlm.nih.gov/articles/PMC12226871/]
- 50. Immersive virtual reality for older adults: Challenges and ... [https://www.sciencedirect.com/science/article/pii/S1568163725001175]
- 51. Development and usability of VRainSUD's cognitive ... [https://www.nature.com/articles/s41598-025-00922-6]
- 52. Using virtual reality to prevent falls in older adults [https://www.gmu.edu/news/2025-07/using-virtual-reality-prevent-falls-older-adults]
- 53. Usability Evaluation Through Cognitive Walkthrough - PMC [https://pmc.ncbi.nlm.nih.gov/articles/PMC11978233/]
- 54. What are the considerations for color and contrast in VR ... [https://milvus.io/ai-quick-reference/what-are-the-considerations-for-color-and-contrast-in-vr-design]
- 55. Designing Inclusive User Interfaces in VR [https://medium.com/@vr.africa_15385/designing-inclusive-user-interfaces-in-vr-93c67f4bea81]
- 56. Data privacy in healthcare: Global challenges and solutions [https://pmc.ncbi.nlm.nih.gov/articles/PMC12138216/]
- 57. A smart secure virtual reality immersive application for alzheimer’s and dementia patients | Scientific Reports [https://www.nature.com/articles/s41598-025-14624-6]
- 58. Preliminary study on the feasibility of virtual reality-based ... [https://pmc.ncbi.nlm.nih.gov/articles/PMC12495198/]
- 59. RATE-XR Qualitative Study Guideline [https://pubmed.ncbi.nlm.nih.gov/39612482/]
- 60. Reporting Guidelines for the Early-Phase Clinical ... [https://www.jmir.org/2024/1/e56790/]
- 61. Comparing spatial navigation in a virtual environment vs. ... [https://www.sciencedirect.com/science/article/abs/pii/S0747563224000785]
- 62. RATE-XR Qualitative Study Guideline - PMC [https://pmc.ncbi.nlm.nih.gov/articles/PMC11619188/]
- 63. Designing, testing and adapting navigation techniques for ... [https://www.sciencedirect.com/science/article/pii/S0097849322000875]
- 64. An immersive first-person navigation task for abstract ... [https://www.nature.com/articles/s41598-021-84599-7]
- 65. Dynamic Visualization of VR Map Navigation Systems ... [https://www.mdpi.com/2220-9964/12/3/133]
- 66. Improved spatial memory for physical versus virtual navigation [https://pmc.ncbi.nlm.nih.gov/articles/PMC12247154/]
- 67. Adaptive task difficulty influences neural plasticity and transfer ... [https://pubmed.ncbi.nlm.nih.gov/30521951/]
- 68. Adaptive task difficulty influences neural plasticity and ... [https://www.sciencedirect.com/science/article/abs/pii/S1053811918321475]
- 69. Let the force guide you: a performance-based adaptive ... [https://www.frontiersin.org/journals/human-neuroscience/articles/10.3389/fnhum.2022.968669/full]
- 70. Optimizing mobile app design for older adults: systematic ... [https://pmc.ncbi.nlm.nih.gov/articles/PMC12350549/]
- 71. A smart secure virtual reality immersive application for ... [https://pmc.ncbi.nlm.nih.gov/articles/PMC12368147/]
- 72. Personalized multi-modal interfaces for cognitive aging [https://www.sciencedirect.com/science/article/pii/S2950307825000876]
- 73. Two new virtual reality tasks for the assessment of spatial ... [https://pmc.ncbi.nlm.nih.gov/articles/PMC6022991/]
- 74. Plasma GFAP, NfL and pTau 181 detect preclinical stages ... [https://pmc.ncbi.nlm.nih.gov/articles/PMC11035722/]
- 75. Associations between trajectories of plasma biomarkers for ... [https://www.nature.com/articles/s41380-025-03166-y]
- 76. Virtual Reality Navigation for Early Alzheimer's Detection [https://vrforhealth.com/2025/09/07/%F0%9F%A7%AD-sundayresearchdive-virtual-reality-navigation-for-early-alzheimers-detection]
- 77. Virtual Reality Navigation for Early Alzheimer's Detection [https://vrforhealth.com/2025/09/07/%F0%9F%A7%AD-sundayresearchdive-virtual-reality-navigation-for-early-alzheimers-detection/]
- 78. Semantic intrusion errors are associated with plasma Ptau ... [https://www.frontiersin.org/journals/neurology/articles/10.3389/fneur.2023.1179205/full]
- 79. Montreal Cognitive Assessment vs the Mini-Mental State ... [https://pmc.ncbi.nlm.nih.gov/articles/PMC11837847/]
- 80. MoCA vs. MMSE: A comprehensive guide for mental health ... [https://www.simplepractice.com/blog/moca-vs-mmse/]
- 81. Effectiveness of VR-based cognitive training and games on ... [https://pmc.ncbi.nlm.nih.gov/articles/PMC12634598/]
- 82. Video Games and Gamification for Assessing Mild ... [https://www.sciencedirect.com/org/science/article/pii/S2368795925000745]
- 83. Receiver Operating Characteristic (ROC) Curve Analysis for ... [https://pmc.ncbi.nlm.nih.gov/articles/PMC3755824/]
- 84. Receiver operating characteristic [https://en.wikipedia.org/wiki/Receiver_operating_characteristic]
- 85. What is a ROC Curve and How to Interpret It [https://www.displayr.com/what-is-a-roc-curve-how-to-interpret-it/]
- 86. Classification: ROC and AUC | Machine Learning [https://developers.google.com/machine-learning/crash-course/classification/roc-and-auc]
- 87. Preclinical detection of Alzheimer's disease pathology ... [https://pmc.ncbi.nlm.nih.gov/articles/PMC12501345/]
- 88. SPATIAL NAVIGATION IN ALZHEIMER'S DISEASE [https://pmc.ncbi.nlm.nih.gov/articles/PMC11692747/]
- 89. The modified spatial context memory test for assessing ... [https://www.sciencedirect.com/science/article/pii/S0168010225001397]